High market volatility has been a defining feature of 2020. But even during less eventful years, market volatility is inevitable—especially in the short-run.
In financial markets, volatility measures exactly how risky a particular asset is over a period of time, so when an asset’s price fluctuates quickly within a short timeframe, it is considered highly volatile.
Standard deviation is one way of calculating and measuring volatility statistically. Over the past two decades, a wide range of volatility indices on different asset classes, as well as volatility exchange-traded products, have been developed.
Today, we'll take a deeper look at one such index and an exchange-traded note (ETN) idea ideal for short-term investing:
The VIX Index
The CBOE Volatility Index (CBOE:VIX) became the first implied volatility index when it was introduced by the Chicago Board Options Exchange (CBOE) in 1993. Its calculation was later revised in 2003. Also known as the "fear-index" or "fear-gauge," market participants regard the VIX index as the premier benchmark for US stock market volatility.
VIX is based on the S&P 500 Index (SPX), which is regarded as the core index for US equities. The detailed calculation of the VIX index is beyond the scope of this article. But at its core, the VIX number shows the market's expectation of 30-day forward-looking volatility, implied by the prices of S&P options. Implied volatility is what the market is “implying” the volatility of an asset will be in the future, based on changes in option prices.
Implied volatility is derived from the cost of the option on an asset (such as an index or a stock). It is a dynamic number, reflecting market developments. For example, when a company is about to release earnings or makes a major announcement on a product, such as a potential vaccine, traders may revise trading patterns on specific options.
As a result, prices of those options may fluctuate up or down, independent of the actual stock price movement, so if there were no options traded on a given index or stock, there would be no way to calculate implied volatility. It is important to remember that implied volatility is based on consensus in the marketplace, but not necessarily a definite predictor of movement in asset prices.
VIX is regarded as a useful tool for investors to appreciate the sentiment in broader US equity markets. Overall, the index tends to spike when the S&P 500 drops sharply, and it usually declines steadily during bull markets.

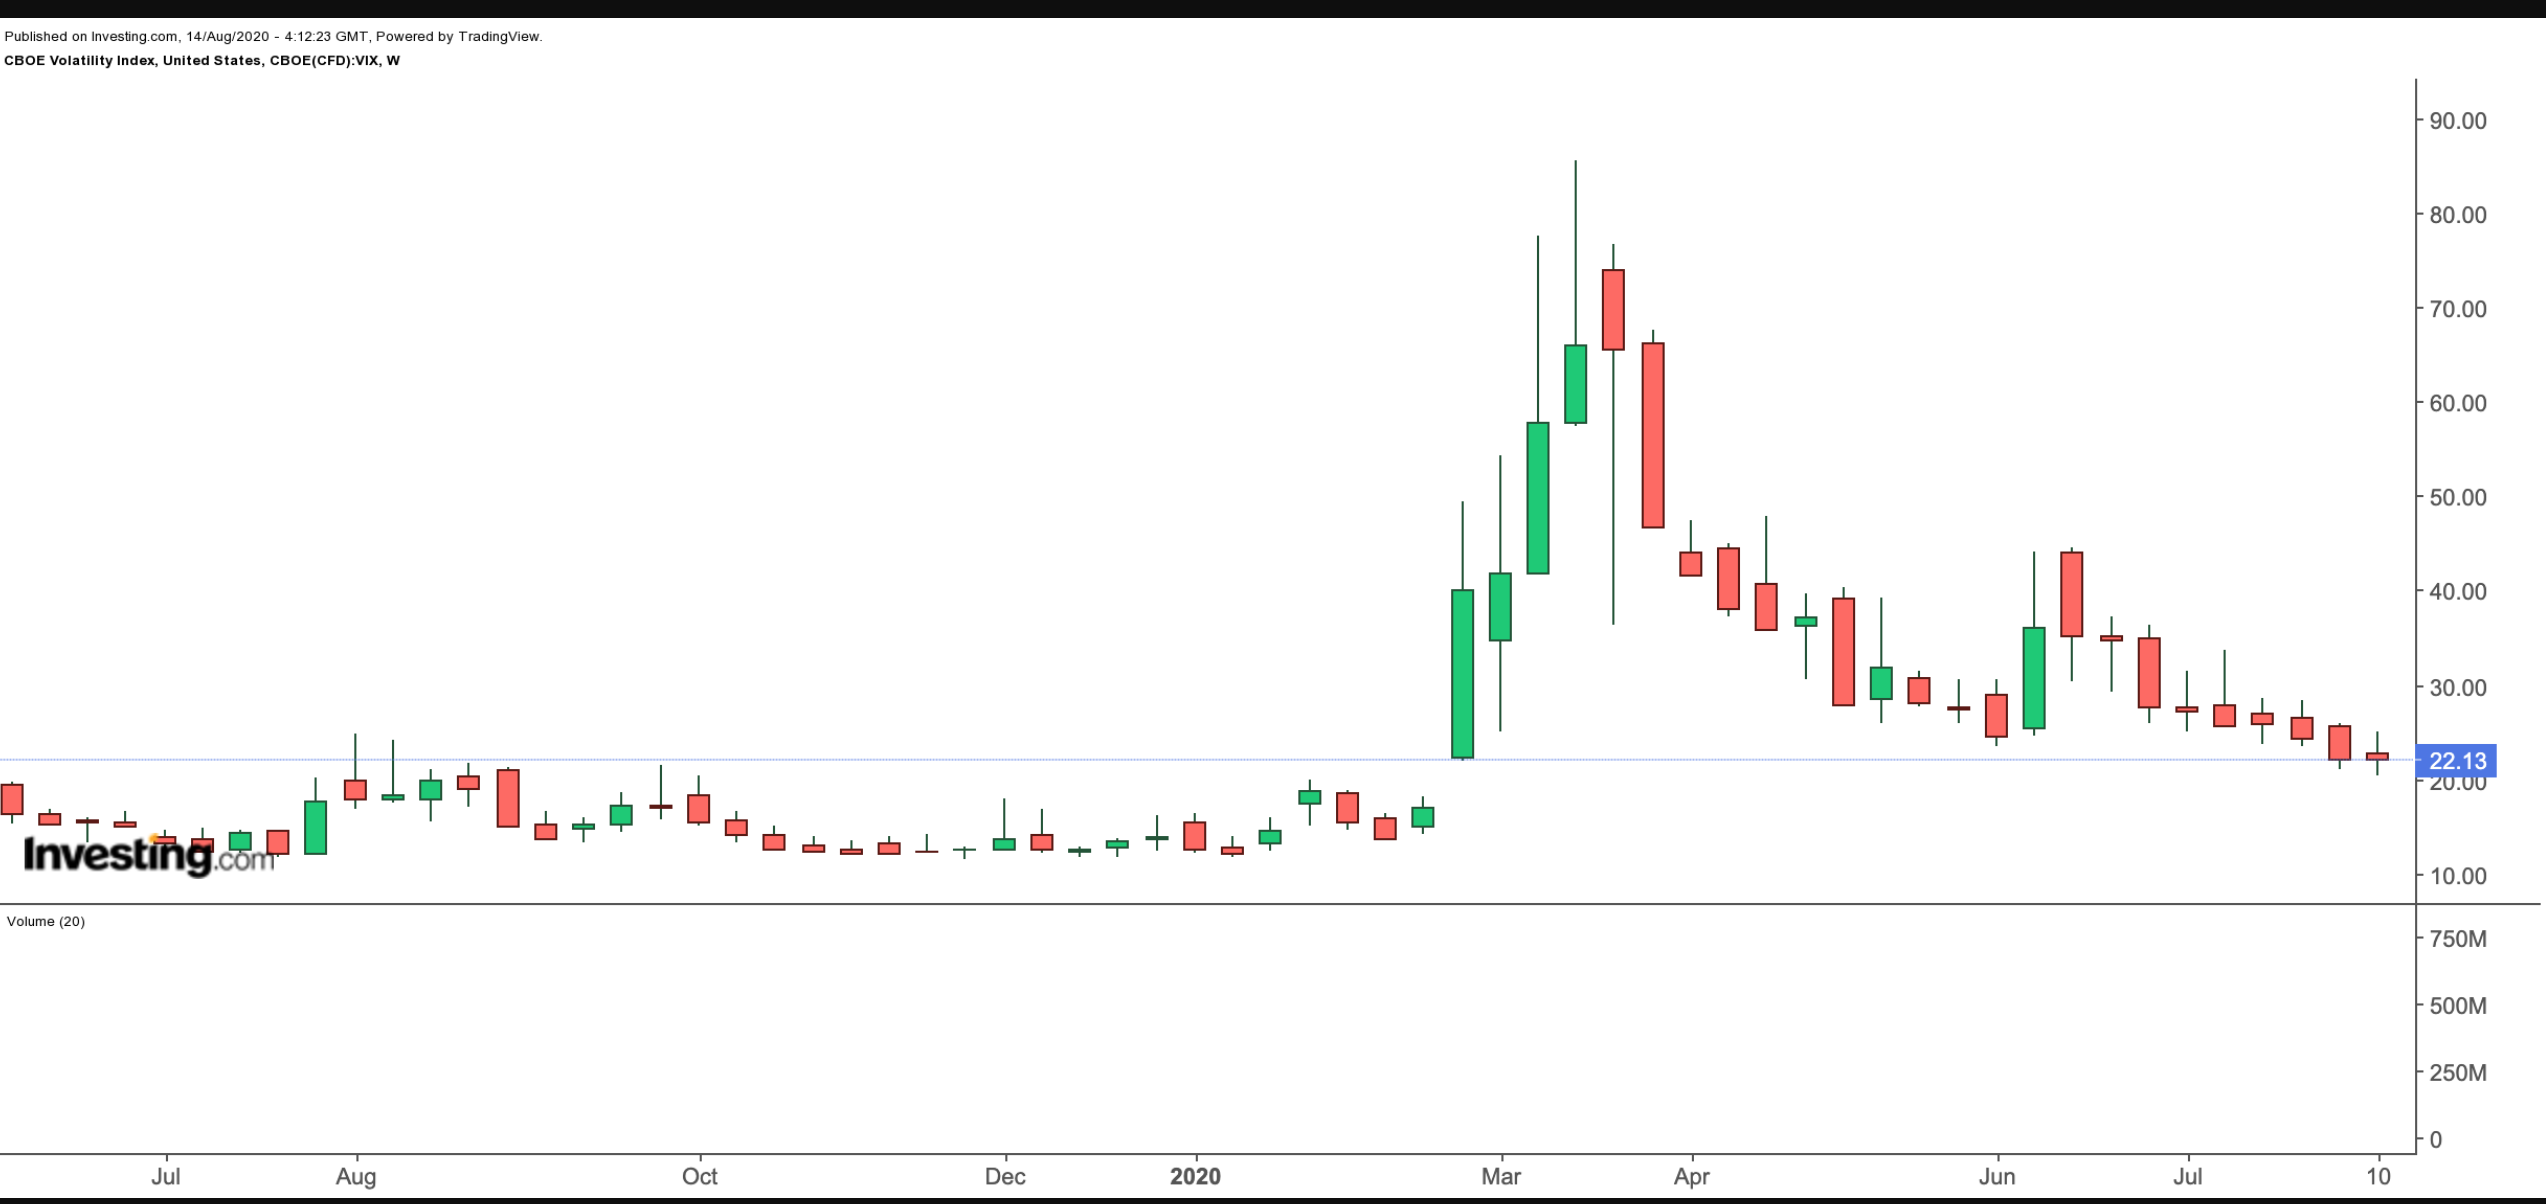
When fear was surging in early March this year, the CBOE Volatility Index exploded to over 80. On March 18, it hit a 52-week high of 85.47. That day also marked the 52-week low prices in many US-based stocks. Currently. VIX is hovering at 22.
iPath S&P 500 VIX Short-Term Futures ETN
-
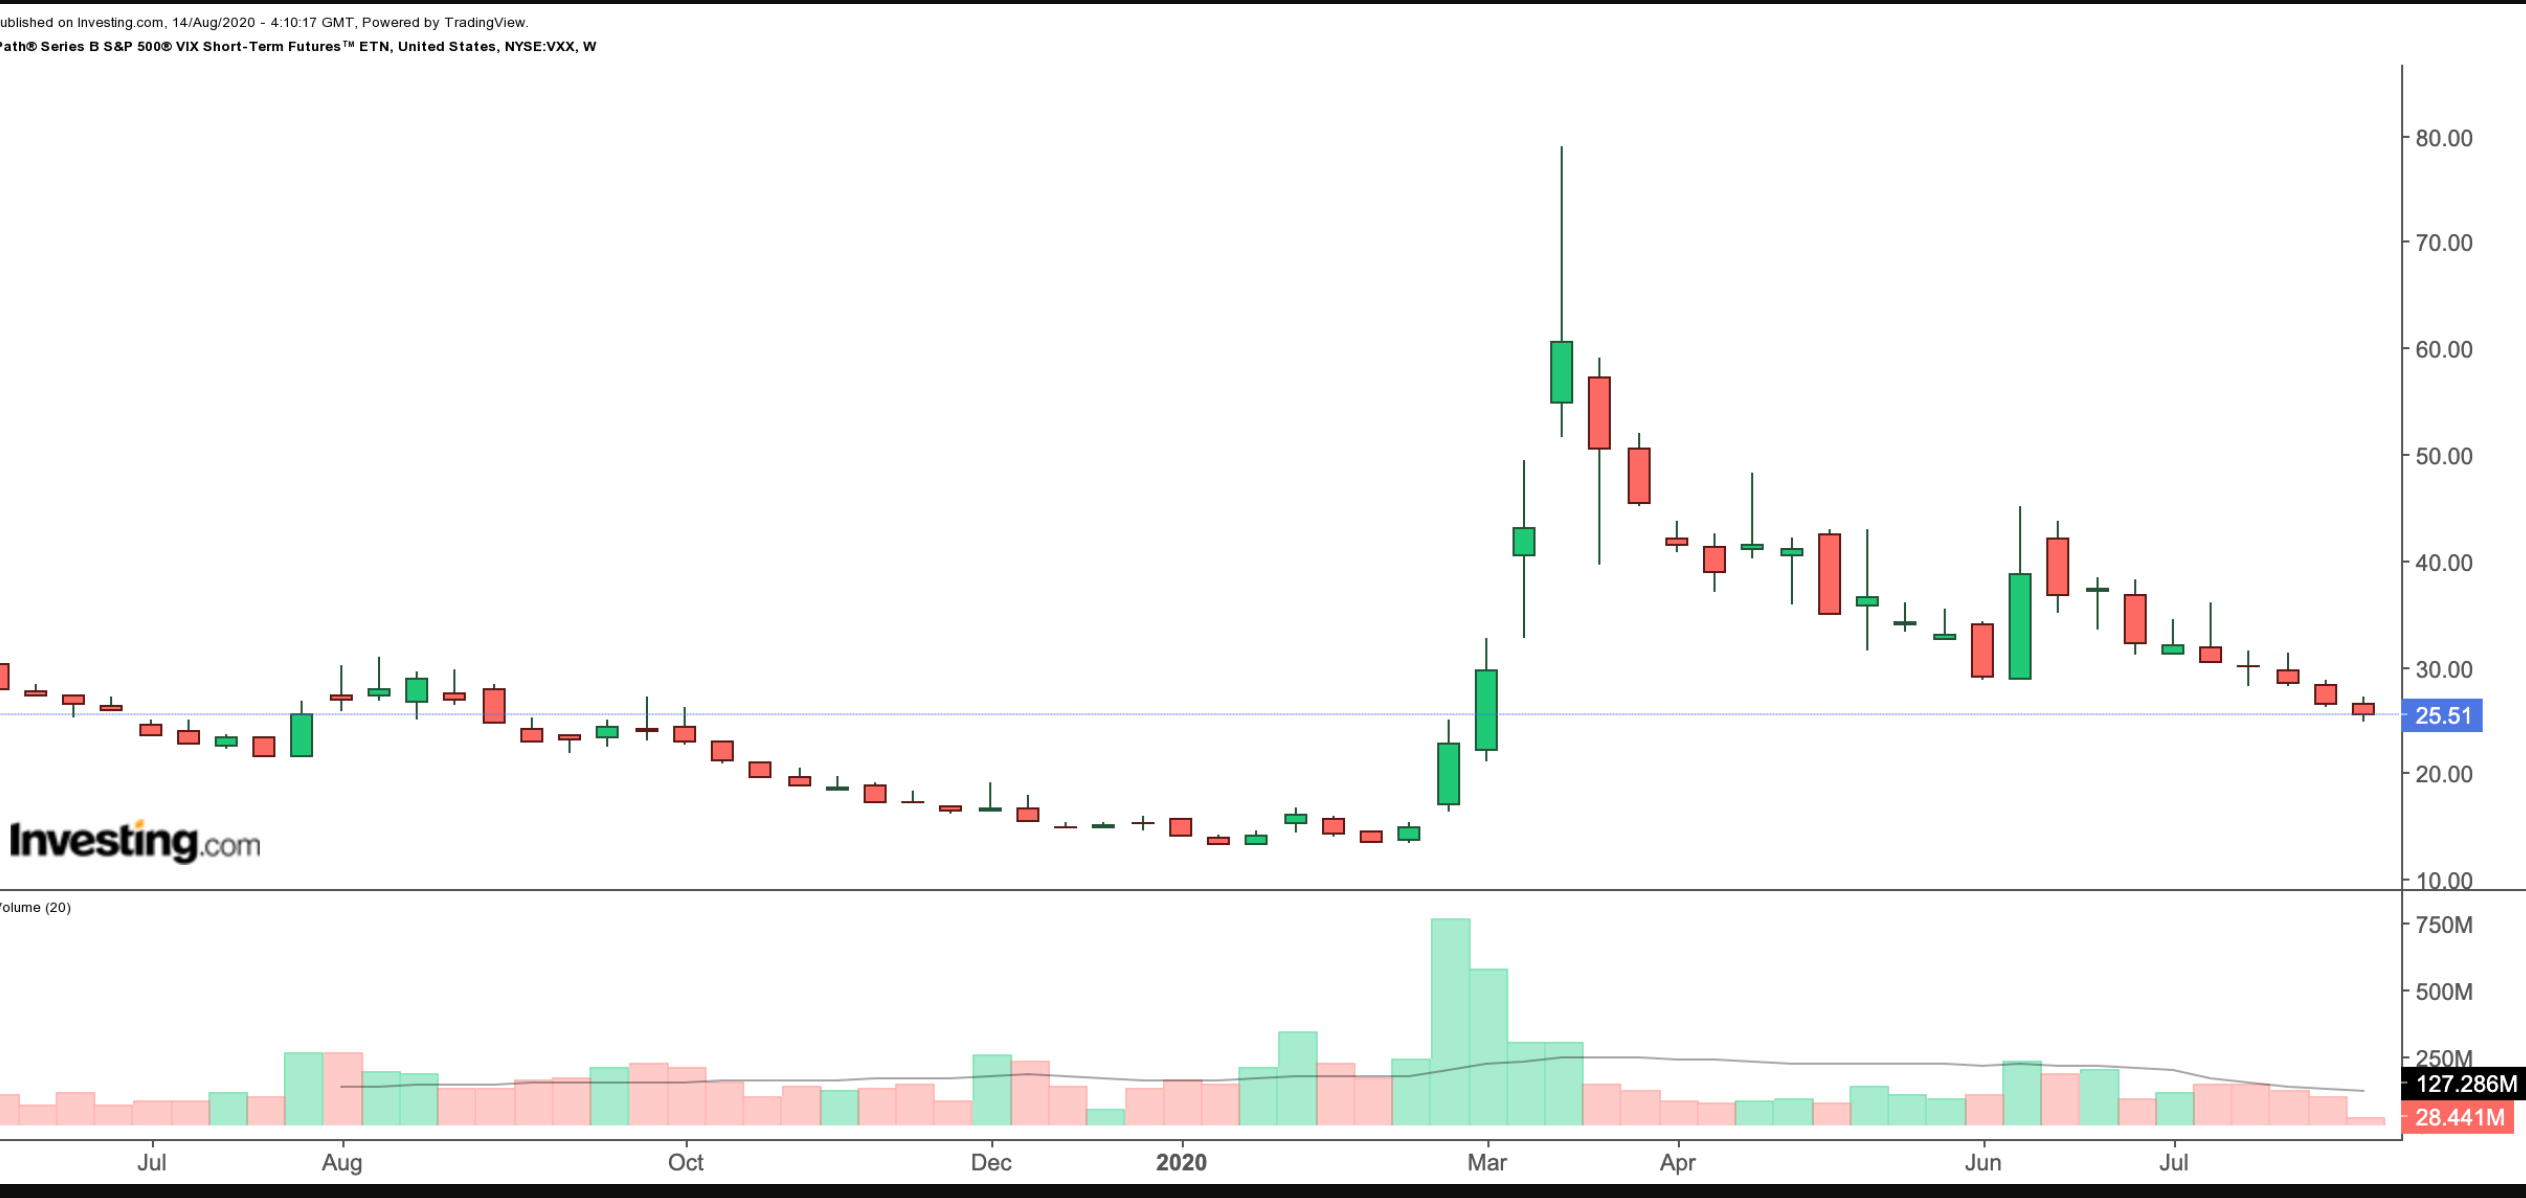
Current level: $25.51
-
52-week range: $13.15-$78.84
-
Investor Fee Rate: 0.89% per year, or $89 on a $10,000 investment
The iPath S&P 500 VIX Short-Term Futures ETN (NYSE:VXX) is an exchange-traded note, an unsecured debt obligation issued by Barclays (NYSE:BCS).
VXX provides exposure to the S&P 500 VIX Short-Term Futures Index Total Return, which tracks the value of the near-term futures contracts written on the VIX index.
Thus VXX aims to achieve a daily return that exactly matches the daily change in short-term futures contracts tracking the VIX, so the ETN’s returns follow the slope of the futures curve.

The methodology of the index and thus of the ETN typically achieves a high correlation with the spot price of the VIX index. As VXX's recent price action has shown, during the trading day, it usually rises in value when stocks fall. So VXX may enable bearish investors to hedge their portfolios against a market decline in the short-run.
However, VXX may not be a suitable long-term addition to a portfolio. Like other volatility exchange-traded products, it is designed with daily returns in mind.
The daily rebalancing has a substantial effect on the reference index (as well as VXX) relative to changes in the VIX index. In fact, the VIX Index may have positive performance during a given period, while the index underlying the ETN and hence the ETN may experience poor performance.
If the ETN is held for more than one session, both the positive and the negative returns may be compounded. This warning is usually clearly stated in prospectuses of these exchange-traded products.
Therefore, those investors who aim to protect their portfolios for extended periods should talk to an investment professional regarding the suitability of volatility products.
Bottom Line
Volatility is a way to calculate the risk of a particular asset over a period of time. As we enter the second half of August, market volatility, as measured by the popular VIX index, is low. Potential vaccine headlines continue to captivate market participants. However, sentiment could change quickly. The looming US presidential election, a contracting global economy, pandemic developments and other unforeseen geopolitical events could swiftly bring volatility back into the market. In the coming weeks, we'll look at other volatility ETFs and ETNs.
