Key Points:
- Reaching the upside of a newly formed bullish channel.
- Challenging a strong zone of resistance.
- ABCD pattern could see medium term bullishness resume.
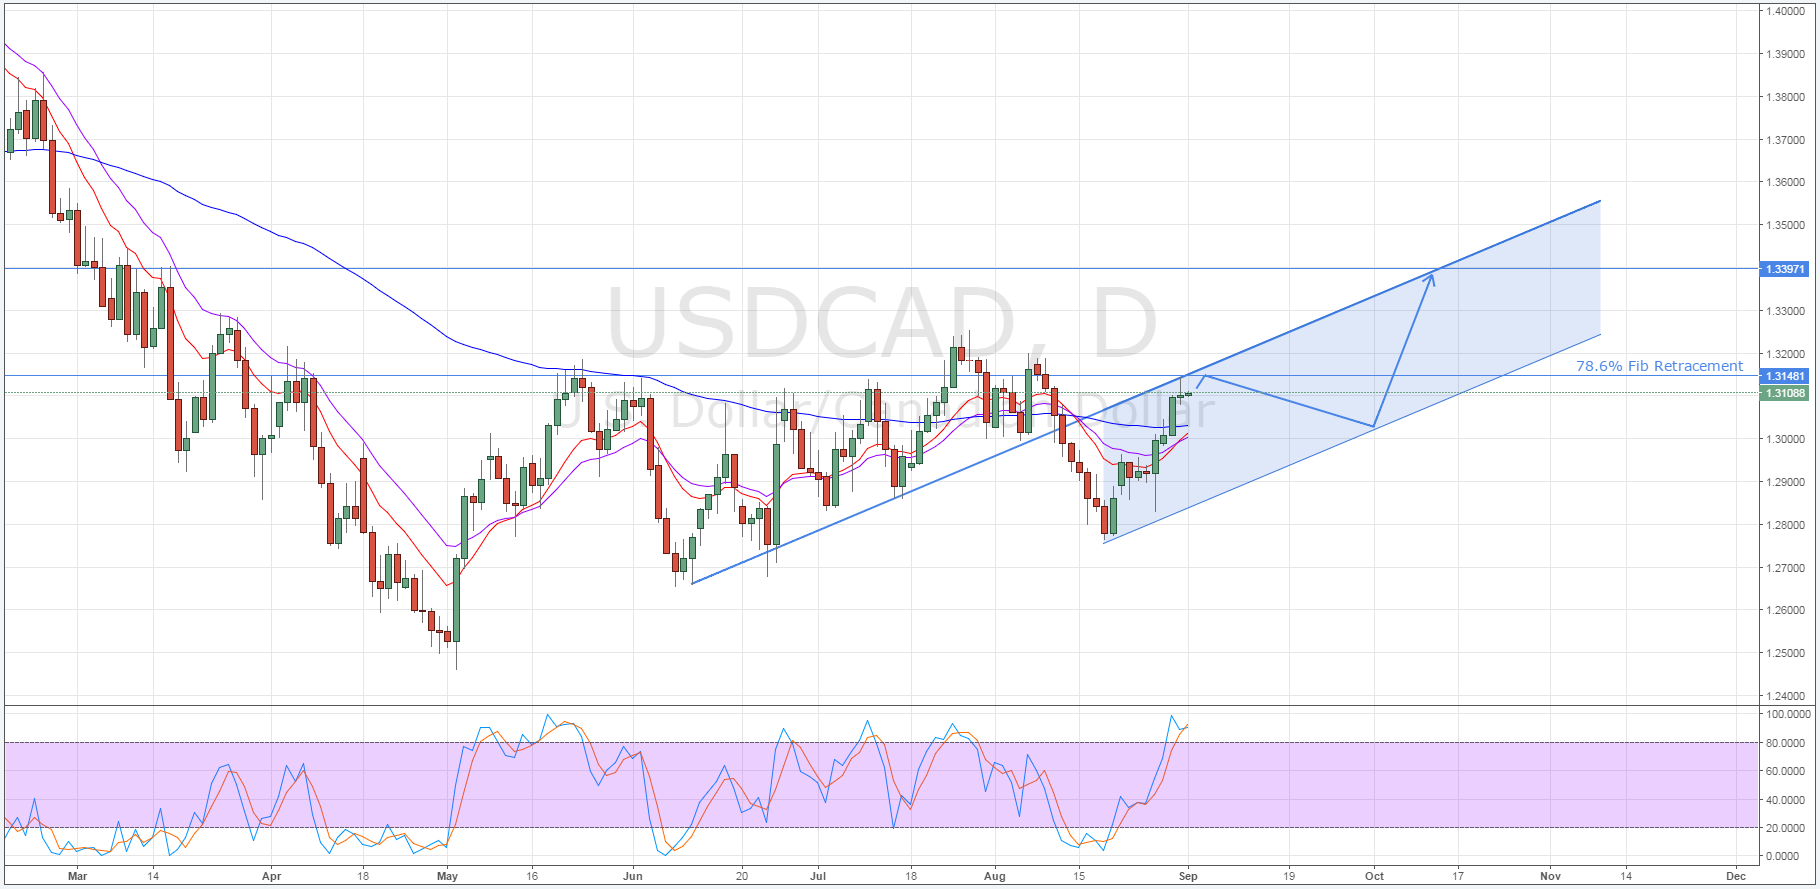
Whilst medium-term forecasts for the Loonie remain bullish, the pair may have to take a slight breather during its ascent. Specifically, we might see a reversal as the week draws to a close and the USD/CAD reaches the upside constraint of its bullish channel. Resistance around this level is likely to be fierce and should hold firm unless we see some serious upticks in the US employment data this week.
Whilst the below chart demonstrates where the pair’s ascending channel is likely to form, it is worth noting that this structure still requires some confirmation. This being said, the lower boundary of the previous bullish channel should provide a solid upside constraint for the current, if somewhat nascent, uptrend. Additionally, the presence of the 50.0% Fibonacci retracement around this point should encourage a reversal which will help to legitimise the channel.

After a reversal has occurred, the USD/CAD should retrace to around the 1.2752 mark and subsequently encounter resistance courtesy of the downside constraint of the new channel. However, keep an eye on the pair’s decline as if it finds support around the 61.8% Fibonacci retracement, the uptrend could take the form of a rising wedge instead. Regardless of what form the bullish phase takes, the Loonie could reach as high as the 1.3397 level as a result of a long-term ABCD pattern.

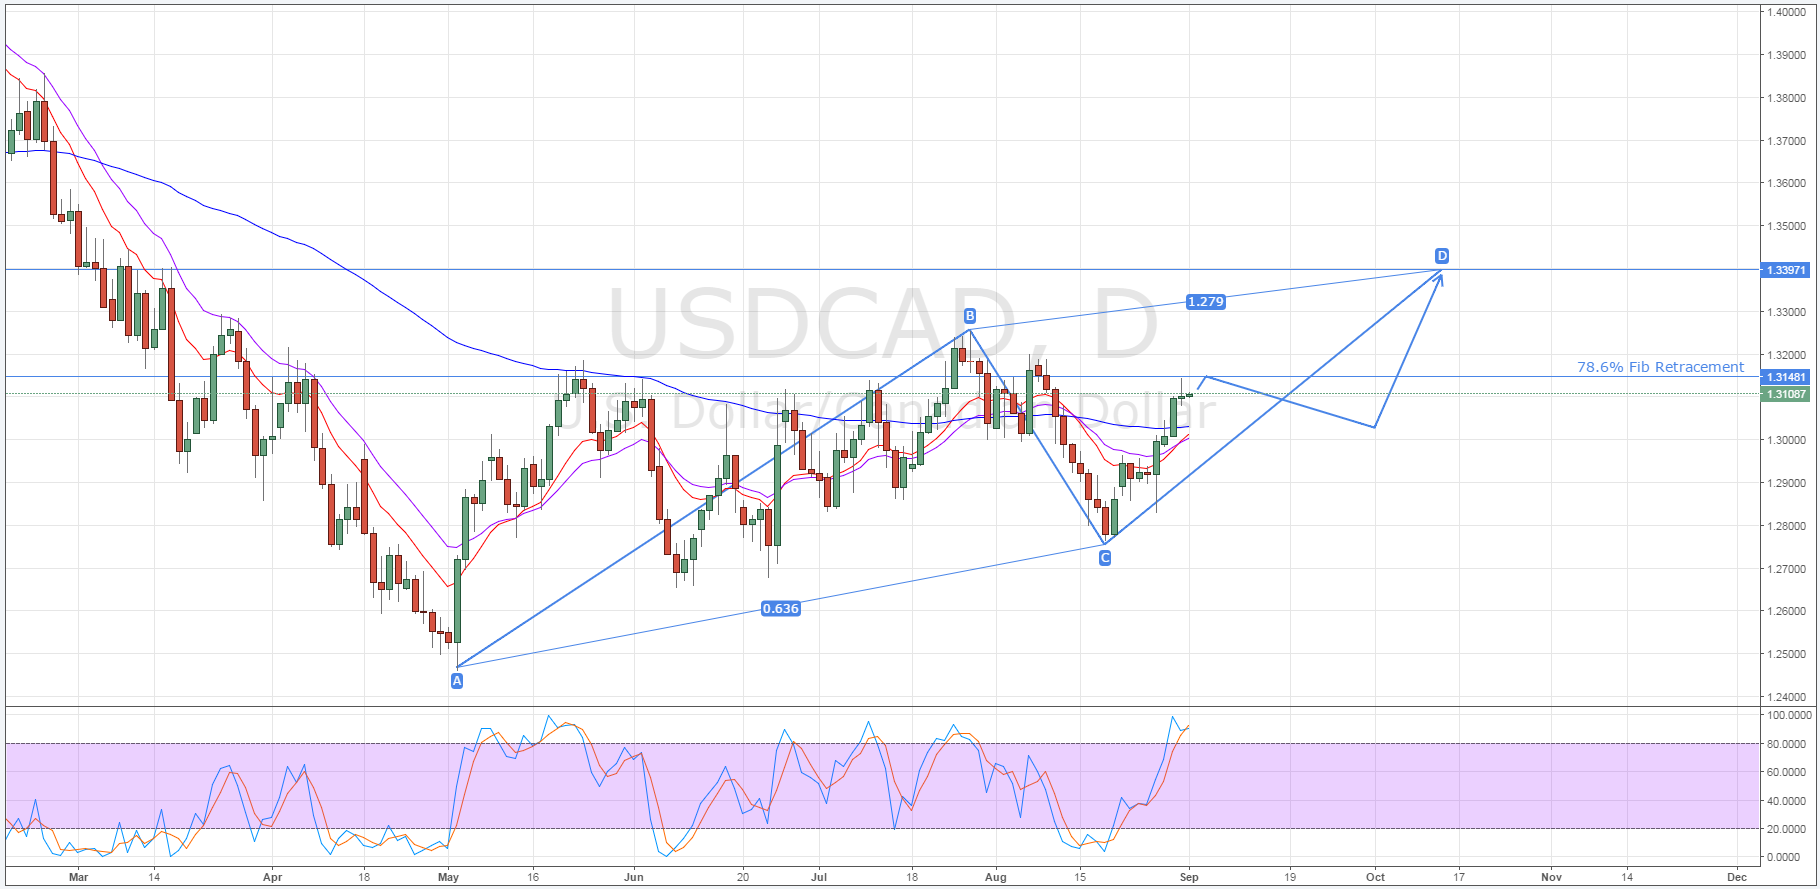
As shown above, the pair’s performance over the past number of weeks is beginning to look like a fairly convincing ABCD pattern. Consequently, if the USD/CAD does follow its current channel higher, it will likely run out of momentum at the end of the D leg around the 1.3397 price. Importantly, this point coincides with a historical zone of resistance which the pair has tested previously and it should therefore prove difficult to breach.
However, the completion of this pattern is largely predicated on the impending US results coming in around the currently forecasted levels. If any surprisingly strong results are seen in the US Unemployment Rate, Non-Farm Employment Change, or Unemployment Claims figures, it could result in a breakout and the dissolution of the currently forming bullish channel. Although, a spate of weaker outcomes could actually help to confirm this pattern so keep a close eye on the releases.
Ultimately, whilst the Loonie has remained stubbornly low for a lengthy period of time, it could finally be manoeuvring to begin a bullish phase. As mentioned above, the presence of a nascent ascending channel and the ABCD pattern could be indicative of a move towards the 1.3397 level. However, as always, keep a watchful eye on the fundamentals this week as there are numerous important figures on offer which could upset any technical bias.
