
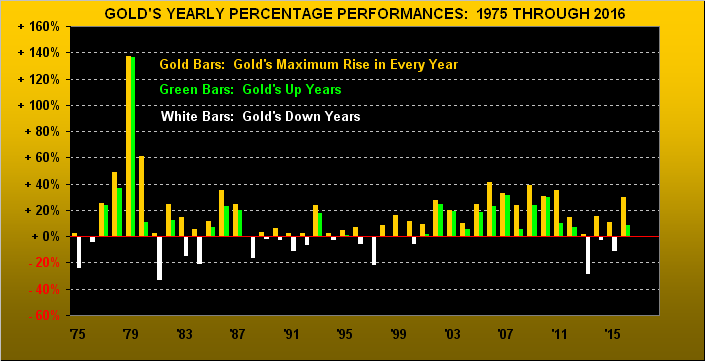
Gold settled the year 2016 on Friday at $1152, up 9% over 2015's settle of 1061, en route up as much as 30% when at Base Camp 1377 on 11 July. 'Twas Gold's first net up year since 2012 and its 17th-best annual net gain over the past 42 years (since 1975 inclusive).
As measured from the All-Time High of 1923 on 06 September 2011, Gold has fallen as much as 46% to 1045 on 03 December 2015. So the Good News from 2016? Gold got a grip. But the Bad News from 2016? Gold gave up 71% of its intra-year gain. Still, a win is a win is a win, and we'll take it over the alternative. Now: what's in store for Gold in 2017?
Came this past week the query of our prediction for Gold in 2017. Having precisely forecast 2016's high of 1377, (revised to which after price cleared our initial 1280 target), there's no way we'll be precisely correct in picking two consecutive years, (for as a long-time trading colleague occasionally muses, "If we're so smart, how come we're not rich?"). Rather, let's just put forth two common sense goals for Gold in 2017:
■ Goal One: Global traders of Gold unite! Let's not have Gold's price pounded down into the 1000s and lower. To give back over four decades of gains during which time the United States faux-dough M2 money supply has increased twelve-fold from less than $1 trillion to now over $12 trillion would be beyond unfathomable, especially given that Gold tonnage during that time frame has only doubled, and throughout which duration other foundationless fiat currencies have been gelandesprunging all over the planet. As do all things in financial nature, excesses revert to means: Gold is excessively low to our present scoreboard M2 debasement "mean" of 2656, (just as the stock market is excessively high to its earnings "mean"). So a word to the wise is sufficient, or as a great credit mentor of ours back at SocGen used to say, "Think about what you're doing, THINK!"
Goal Two: Be realistic about the upside! Save for the Shorts, we'd all like to see Gold eclipse the $2,000/oz. level in 2017. 'Tis not gonna happen; (if it so does, we'll stop writing, as we stated some three years ago as our penning goal). But in a year's time, to see Gold sitting atop Base Camp 1377 would be terrific, and even more so marvelous (per our Gold Structure chart near the foot of this missive) were price to crawl up out of the Basement and onto The Floor at 1466.
However, the biggest technical obstacle to all that in 2017 shall again be the 1240-1280 resistance zone. Get that big ole resistor behind us -- permanently -- and we'll be good to go. So with percentage growth in mind as guided by what price has done since 1975, we put together the following "paired bars" graphic of each year's maximum percentage gain (in gold) and yearly net gains (in green) or net losses (in white). The rightmost pairing shows us just how dramatic was Gold's 2016 gains give-back:
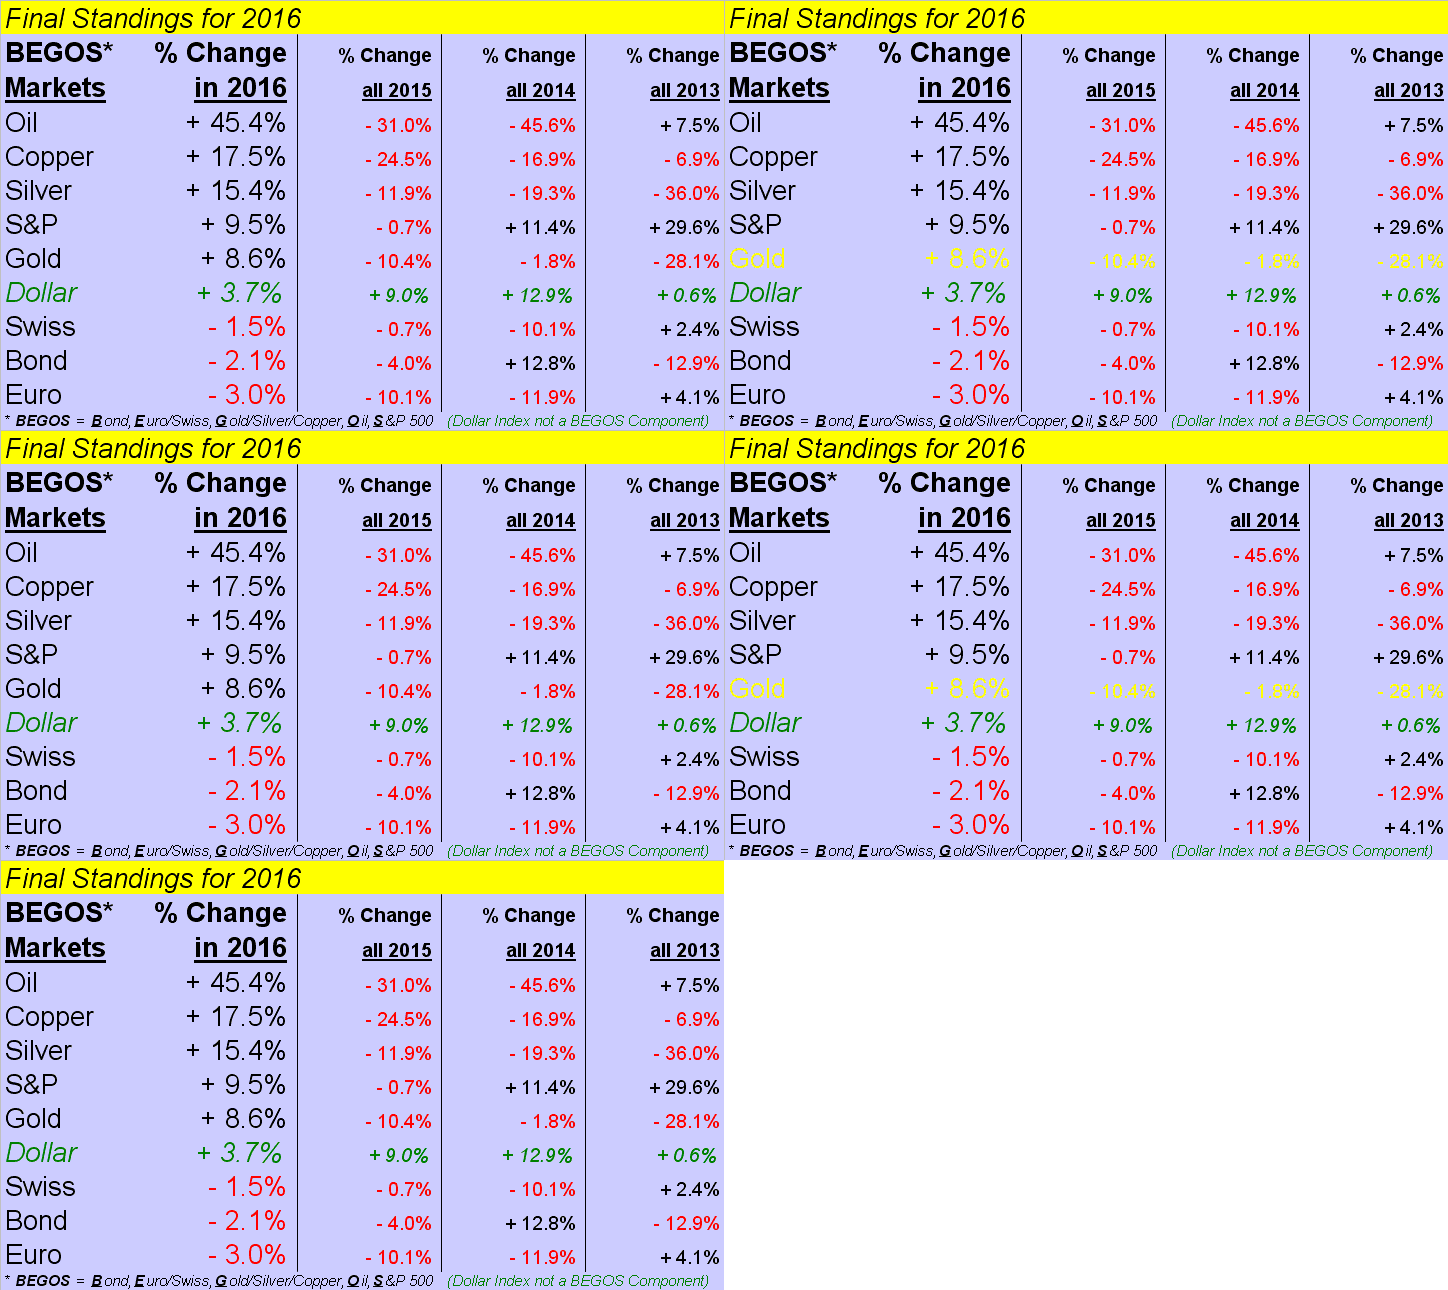
Next, here are the final 2016 standings for the BEGOS Markets, the precious metals having led the way through mid-year, again to then give back the majority of their gains; as above noted, Gold at one point was impressively +30% on the year ... but Silver was +53% en route to finishing "only" +15%, still making the Top Three Podium along with Copper +17% and Big Oil, (which +45% was its sixth best up year since at least 1984):
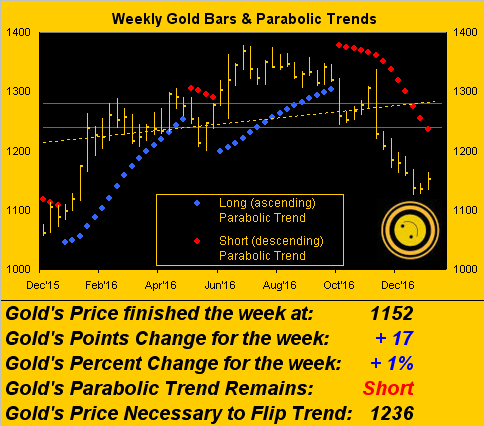
As for Gold's year-over-year weekly bars, this incipiency of an ensuing upswing would brighten the New Year, but as we noted a week ago, upon price piercing the declining red parabolic Short dots, 'twill still be below the aforementioned 1240-1280 resistance zone as bounded by the purple lines:
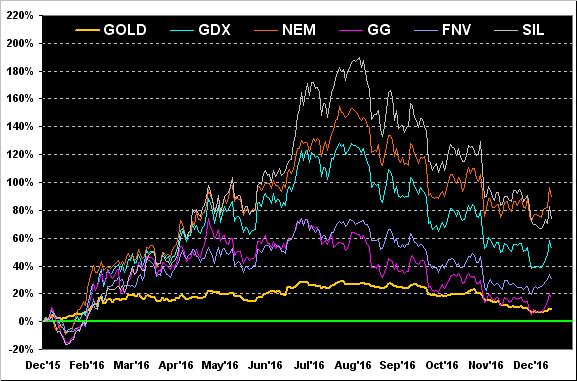
Maintaining our theme from a year ago-to-date, here are 2016's final percentage tracks for Gold itself (+9%), and key precious metals equities that include Goldcorp (NYSE:GG) +18%, Franco-Nevada (NYSE:FNV) +31%, VanEck Vectors Gold Miners Fund (NYSE:GDX) (the prominent exchange-traded fund of the Gold miners) +52%, Global X Silver Miners (NYSE:SIL) (the popular exchange-traded fund of the Silver miners) +73%, and Newmont Mining Corporation (NYSE:NEM) +89%. "What's to complain about?" --(a notable reader):
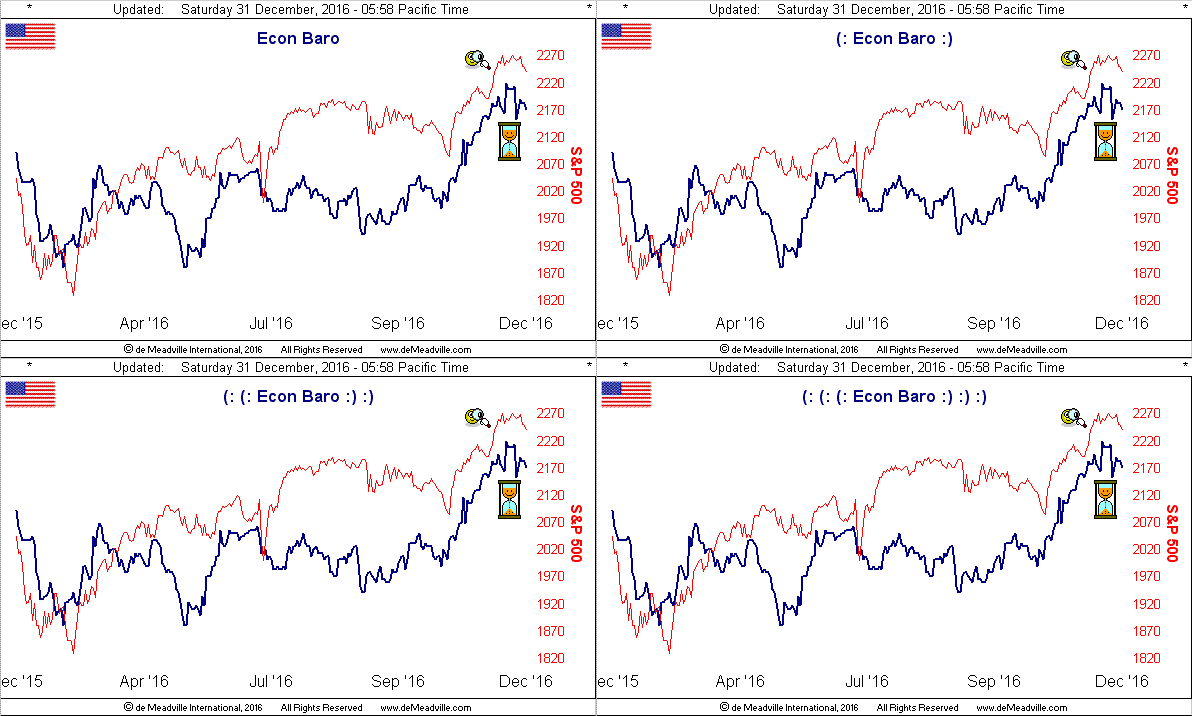
Now we've the entire year's performance of the Economic Barometer and S&P 500. Again note the pre-election building of the Baro, but that now 'tis somewhat running out of puff.
We just had an "unexpected" setback in the Chicago Purchasing Managers' Index for December, which may portend for same with the release of the Institute for Supply Management Index on Tuesday (03 Jan):
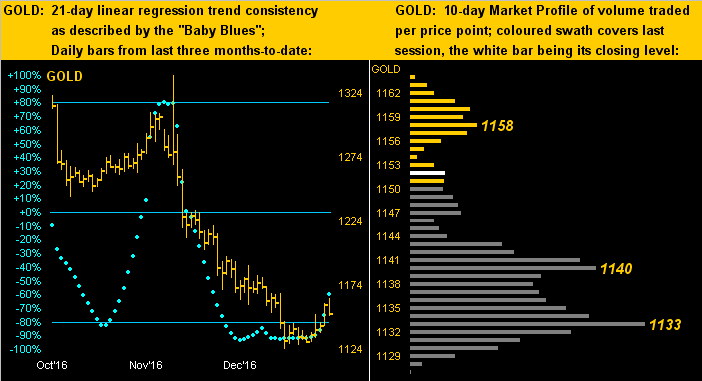
Zooming in nearer-term, here next is the two-panel chart of Gold's daily bars on the left spanning the last three months, the baby blue dots of day-to-day 21-day linear regression consistency on the rise from below the -80% level: that normally bodes well for higher prices ahead; on the right is Gold's 10-day Market Profile which shows good volume support at 1140 and 1133, (but we'd rather not go there...):
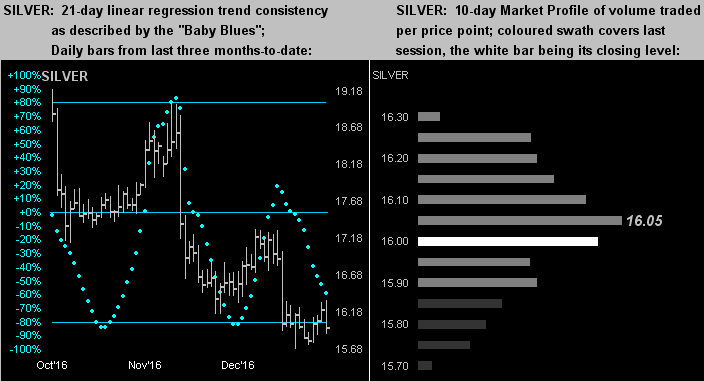
Here are the same panels for Sister Silver, whose "Baby Blues" (left) continue to descend as Cousin Copper's December decline has not been a friendly industrial metal ally; Silver's centerpiece of trading volume per the Profile (right) is at the 16.05 level:
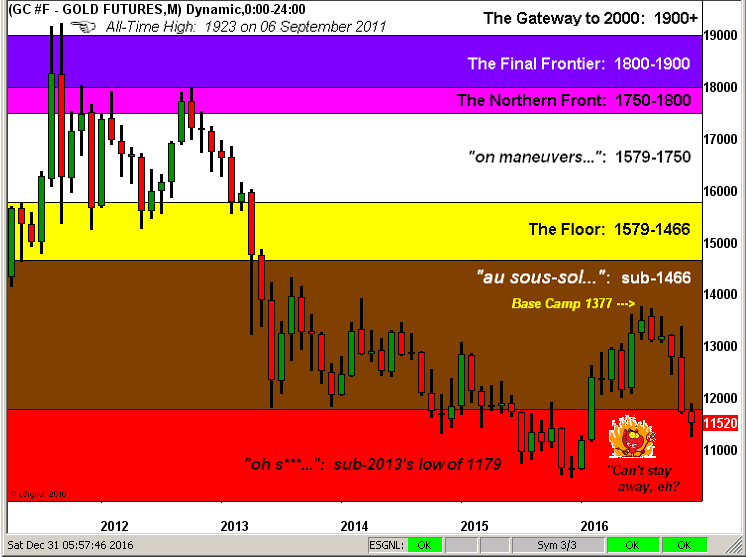
And thus in ending the year, here we've the broad-based Gold Structure chart, price having maniacally found its way back into the lowest of the major defined strata: "Feeeel the heeeeat..."--('Some Like It Hot', The Power Station, '85). But in looking out one month across the sixteen January's millennium-to-date, Gold netted gains in ten of them; moreover, Gold has not had a losing January since 2013, (the wee fellow down there is likely thinkin' one is due, but hopefully his is the wrong view):
Toward wrapping up this year-ender, let's also assess the State of the Stack:
The Gold Stack
- Gold's Value per Dollar Debasement, (from our opening "Scoreboard"): 2656
- Gold’s All-Time High: 1923 (06 September 2011)
- The Gateway to 2000: 1900+
- Gold’s All-Time Closing High: 1900 (22 August 2011)
- The Final Frontier: 1800-1900
- The Northern Front: 1750-1800
- On Maneuvers: 1579-1750
- The Floor: 1466-1579
- Le Sous-sol: Sub-1466
- Base Camp: 1377
- 2016's High: also 1377 (06 July)
- Neverland: The Whiny 1290s
- Resistance Zone: up to 1280 (from 1240)
- The Weekly Parabolic Price to flip Long: 1236
- The 300-Day Moving Average: 1225 and falling
- 10-Session directional range: up to 1164 (from 1127) = +37 points or +3%
- Trading Resistance: 1158
- Gold Currently: 1152, (expected daily trading range ["EDTR"]: 14 points)
- 10-Session “volume-weighted” average price magnet: 1141
- Trading Support: 1140 / 1133
- 2016's Low: 1061 (04 January)
So there 'tis for 2016. And as we now write with 2017 arriving by the hour 'round the world, again: Gold's Goal One is not to tank and Gold's Goal Two is work toward realistically higher territory; a price of $2,000/oz. in 2017 is out-of-reach, (barring a repeat of 1979's 136% rise), but a nice 20% net gain back toward 1400 would be nifty.
Indeed over the past 42 years, Gold has recorded a net annual gain of 20% or better in 11 of them. Further, 'tis been seven years since Gold last recorded a year's net gain which was that robust, (30% in 2010). So in speaking of "due" ... for Gold 'tis true!