- Rising rate cut hopes are fueling rallies in major indexes.
- Nasdaq 100 has broken above a key resistance.
- Meanwhile, S&P 500 is looking to break above a critical barrier.
- In 2024, invest like the big funds from the comfort of your home with our AI-powered ProPicks stock selection tool. Learn more here>>
Recent economic data from the US has painted a bleak picture. Disappointing GDP and inflation readings were followed by worse-than-expected figures from the labor market, ISM indexes, and the Consumer Confidence Index. However, the market seems to be cheering the disappointing data.
Investors are interpreting this data as a sign that the Fed may be forced to pivot sooner, loosening monetary policy in response to an economic slowdown. This optimism is fueling a strong rally in major US indexes, especially tech-heavy indexes like the Nasdaq 100.
However, this market enthusiasm could be short-lived. If upcoming economic data continues to be poor, pushing the US closer to recession, it could quickly wipe away the current optimism. Historically, the Fed's pivot to combat a recession often leads to a market correction, either small or significant.
So, Will the Nasdaq 100 Make New Highs This Week?
Yesterday's strong performance in the Nasdaq 100, with a gain of over 1%, suggests that buyers are determined to return the index to an upward trend. With a light data calendar ahead, the positive sentiment witnessed at the beginning of the week could potentially continue in the coming days.
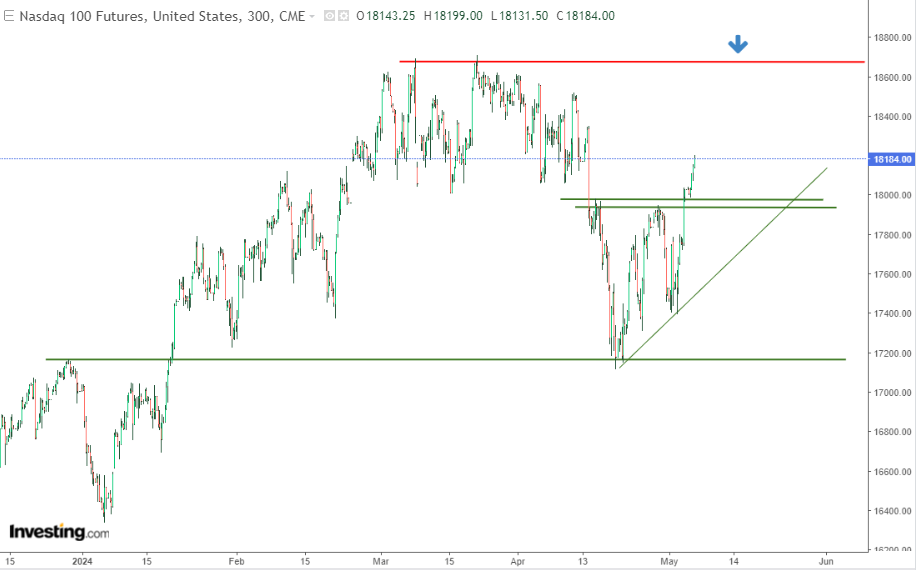
A key technical indicator to watch is the local resistance level near 18,000 points, which could pave the way for a significant rise in the index. This revised lede highlights the contrasting situation, the potential reasons behind market optimism, and the risk involved. It also sets the stage for the Nasdaq 100 Futures to keep rising, as you can see in the chart below:

The immediate target for bulls is the recent high near 18,700 points, with a potential support level at 18,300 points. For further climbs, the key defense area remains the aforementioned 18,000-point level, confirmed by the accelerated trend line. Conversely, sellers will likely target the clearly defined support area at 17,200 points if the market reverses course.
S&P 500 Eyes Levels Above 5,200
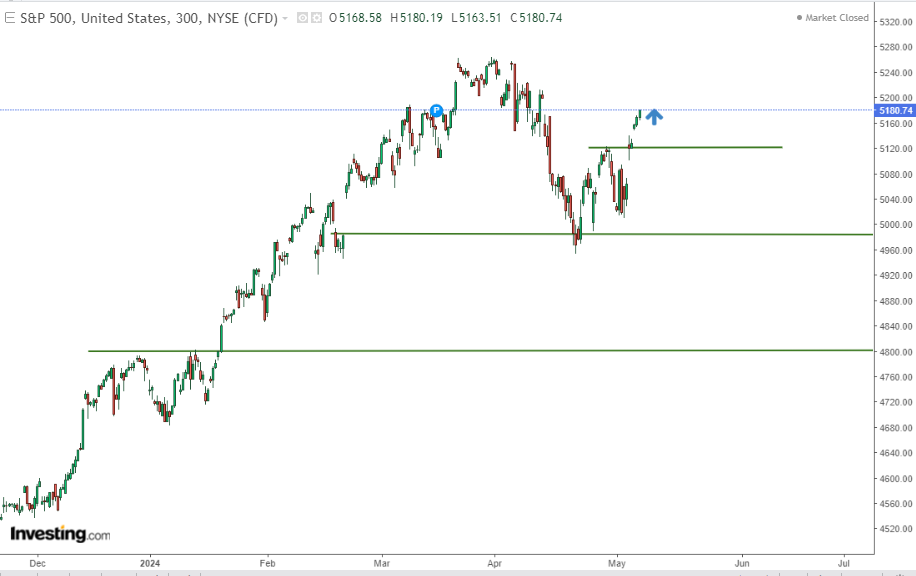
Mirroring the Nasdaq, the S&P 500 index also closed yesterday with a respectable 1.03% gain. Bulls now face the critical challenge of surpassing the 5,200-point level, which would bring them closer to retesting the recent highs near 5,260 points.

The recent market reaction and strong technical indicators suggest a continuation of the uptrend is now more likely. This positive sentiment appears to be discounting the "worse-the-better" scenario. We should keep a close eye on how the market values the probability of the first Federal Reserve interest rate cut, currently expected in September.
***
Want to try the tools that maximize your portfolio? Take advantage HERE AND NOW of the opportunity to get the InvestingPro annual plan for less than $10 per month.
For readers of this article, now with the code: INWESTUJPRO1 as much as a 10% discount on annual and two-year InvestingPro subscriptions.ProPicks: AI-managed portfolios of stocks with proven performance.
- ProTips: digestible information to simplify a lot of complex financial data into a few words.
- Advanced Stock Finder: Search for the best stocks based on your expectations, taking into account hundreds of financial metrics.
- Historical financial data for thousands of stocks: So that fundamental analysis professionals can delve into all the details themselves.
- And many other services, not to mention those we plan to add in the near future.
Act fast and join the investment revolution - get your OFFER HERE!
Disclaimer: The author does not own any of these shares. This content, which is prepared for purely educational purposes, cannot be considered as investment advice.

