
After trading to a high of $2.364 per MMBtu on May 5, the price of natural gas has been falling. July futures were trading at a healthy premium to the expired June contract, but the price of July has converged as it was trading below the $1.80 level going into the latest inventory report from the Energy Information Administration on June 4.
We are now in the summer season, and the demand for cooling will rise from June through September. Natural gas is the primary input in power generations in the U.S. A hot summer would cause increased demand for the energy commodity as production has declined.
The number of rigs operating in the natural gas market is significantly lower than last year at the start of June because of the low price level below the $2 per MMBtu level. During the first week of June in 2019, nearby natural gas futures traded in a range from $2.305 to $2.475 per MMBtu. The United States Natural Gas Fund (NYSE:UNG) replicated the price action in the volatile natural gas futures market.
Market Expected 111 bcf Injection Into Inventories
According to Estimize, the crowdsourcing website, the market had expected a triple-digit 111-billion-cubic-feet increase in stocks for the week ending on May 29.
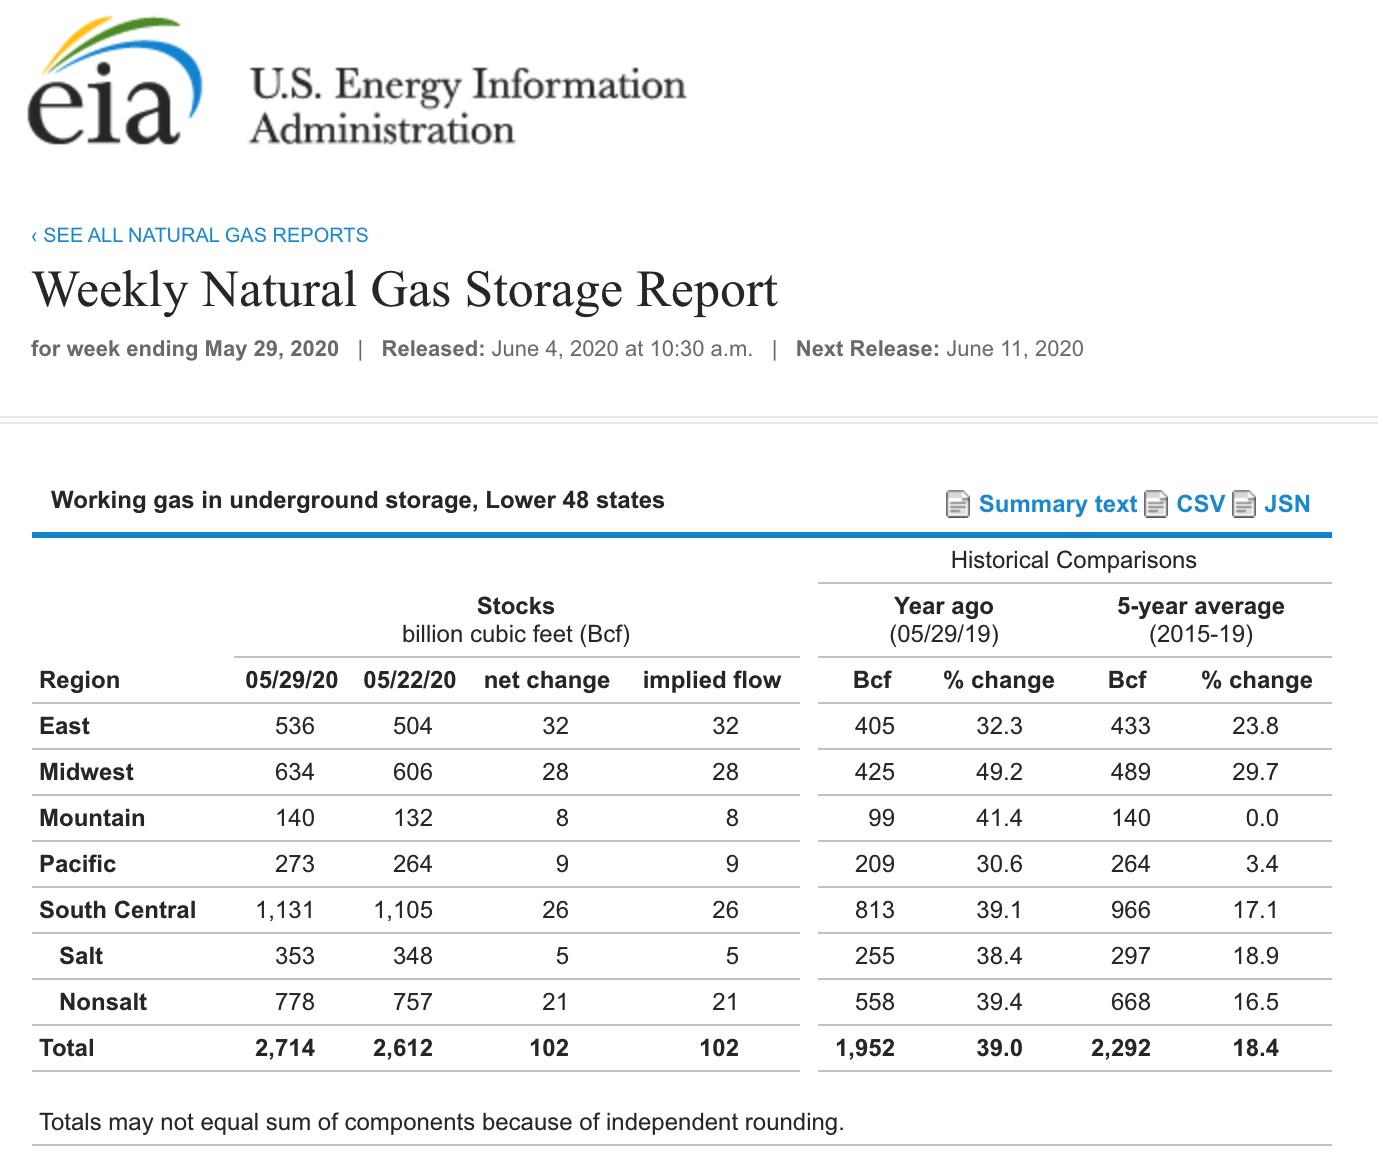
(Source: EIA)
As the chart illustrates, the EIA reported a 102 bcf increase in natural gas in storage around the U.S. for the final week of May. Stocks were 39% above last year’s level and 18.4% over the five-year average. The difference between inventories this year and last continued to decline, marking the 10th consecutive week.
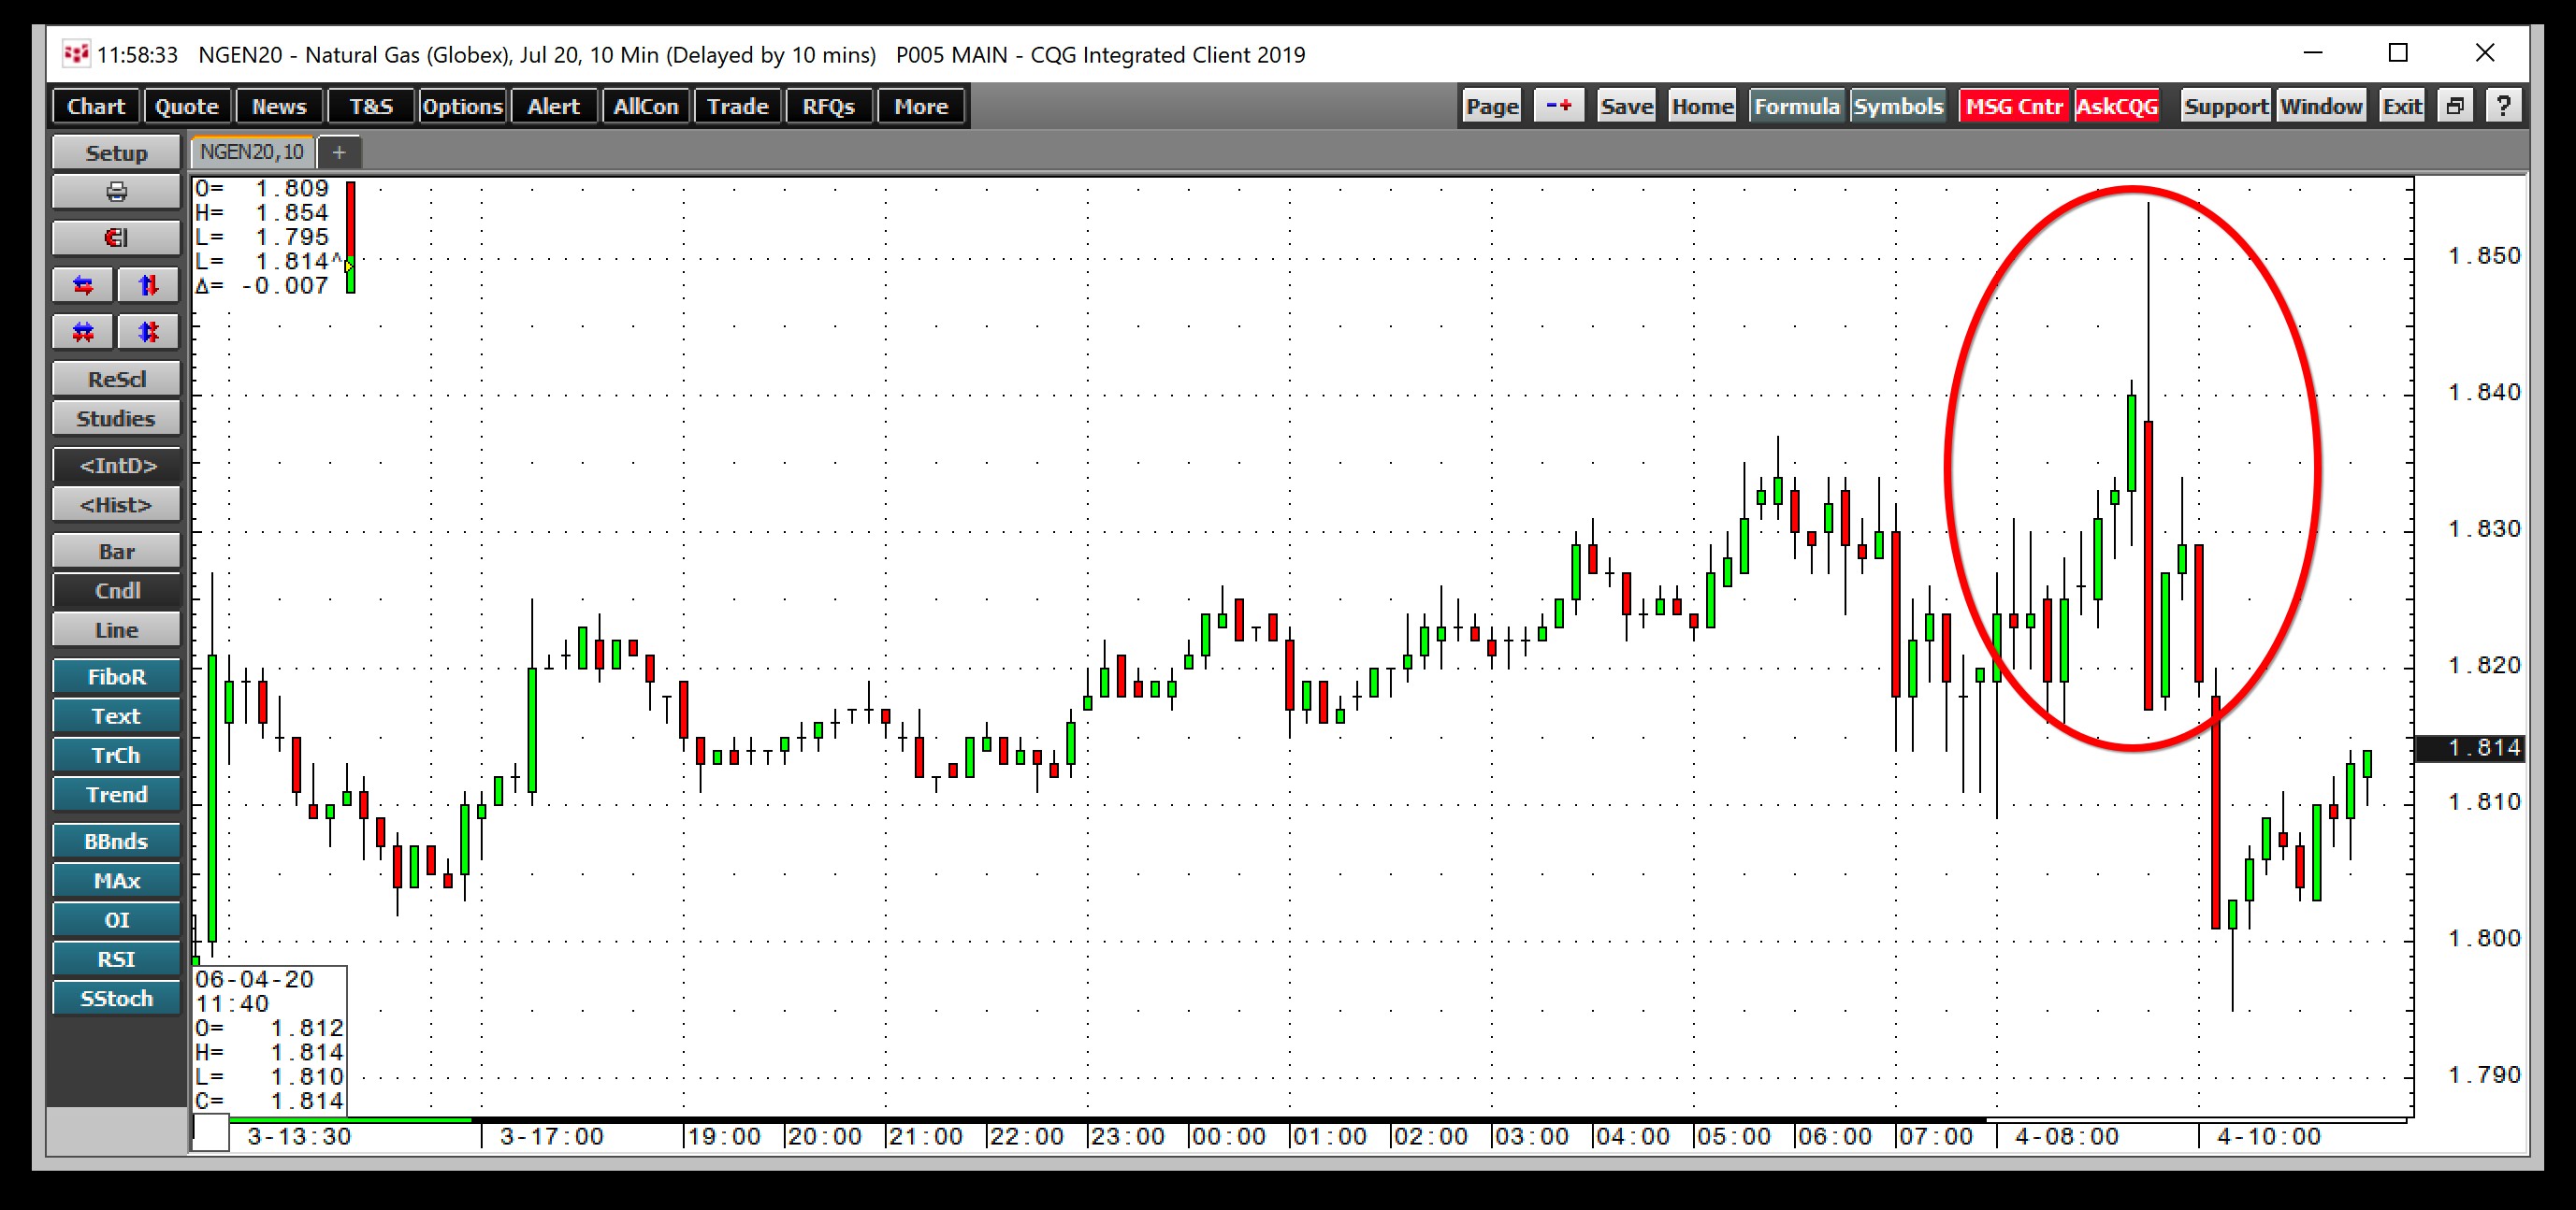
(Source: CQG)
July natural gas futures on NYMEX moved higher after the release of the data, reaching a high of $1.854, but quickly retreated to the $1.80 per MMBtu level.
Price Hovers Around $1.80 Per MMBtu Level
The short-term picture in the natural gas market remains bearish.
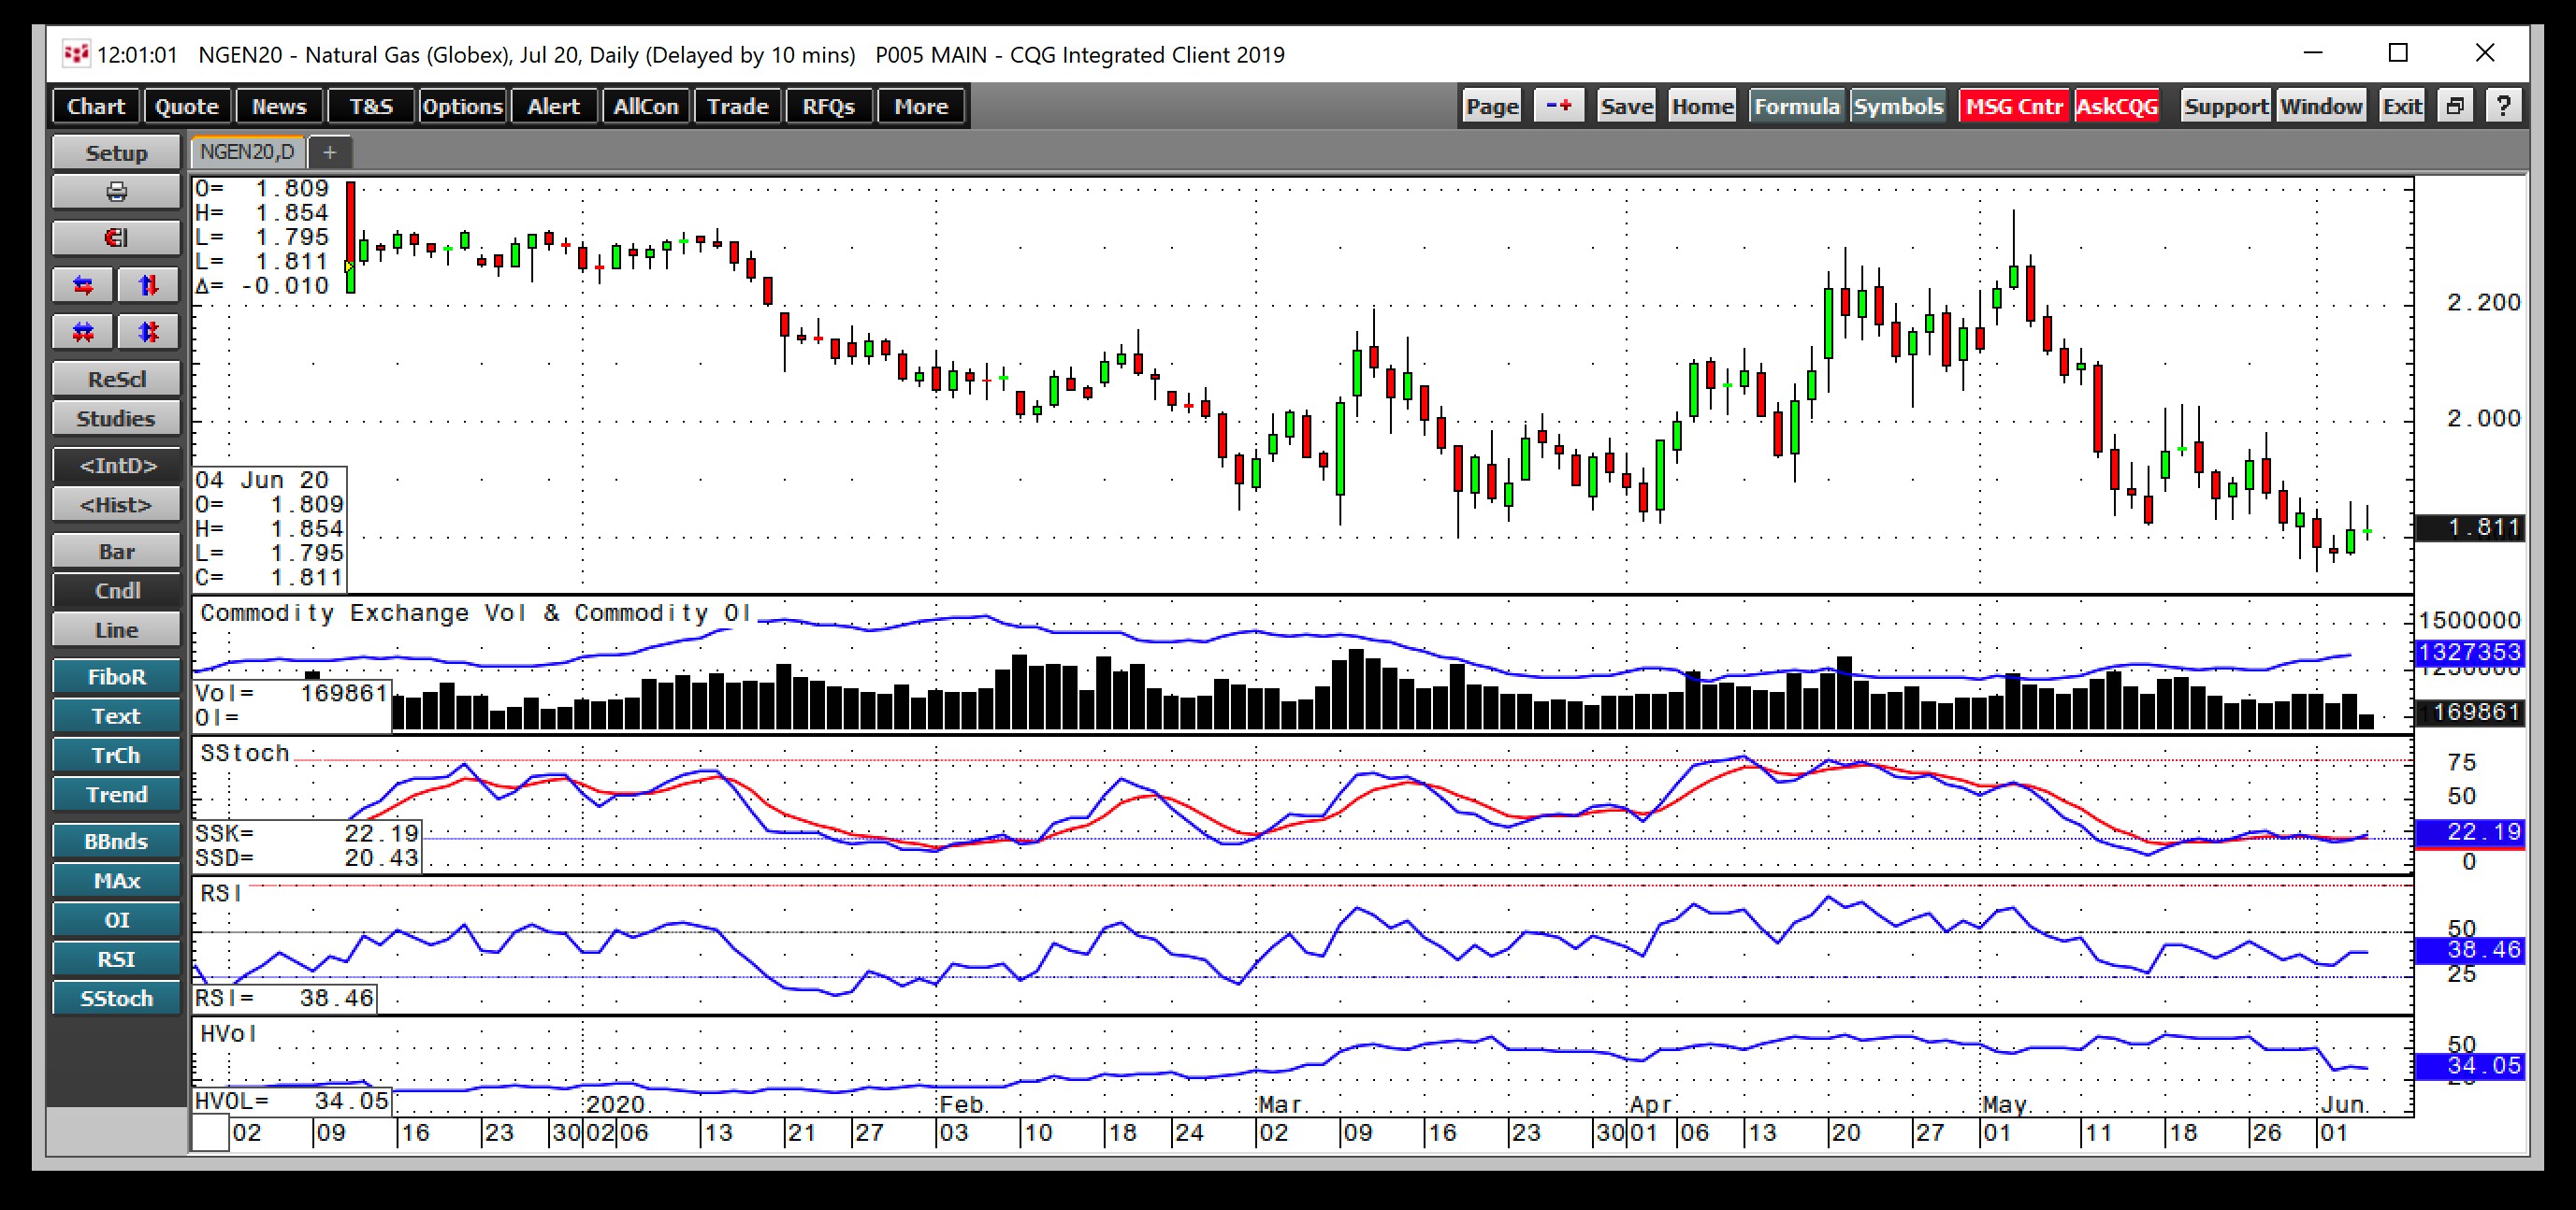
(Source: CQG)
As the daily chart highlights, the price of July natural gas has made lower highs and lower lows since reaching a peak of $2.364 on May 5. The latest low came on June 1 at $1.742 per MMBtu, which now stands as short-term technical support. The first level of resistance is at the May 19 high at $2.027.
Price momentum and relative strength indicators were in oversold territory on June 4. Daily historical volatility at 34.1% has dropped from almost 60% in mid-May, reflecting narrower trading ranges in the energy commodity. The total number of open long and short positions has been steadily rising, reaching 1.327 million contracts as of June 3. The rise as the price has been trending lower could mean that speculative shorts have been increasing positions. In natural gas, short-covering rallies tend to occur when bears become a bit too overenthusiastic. The price was hovering just over the $1.80 per MMBtu level after the latest EIA data.
Higher Lows Should Lead To Another Bounce
While the short-term picture is bearish, the medium-term outlook remained constructive for the natural gas market.
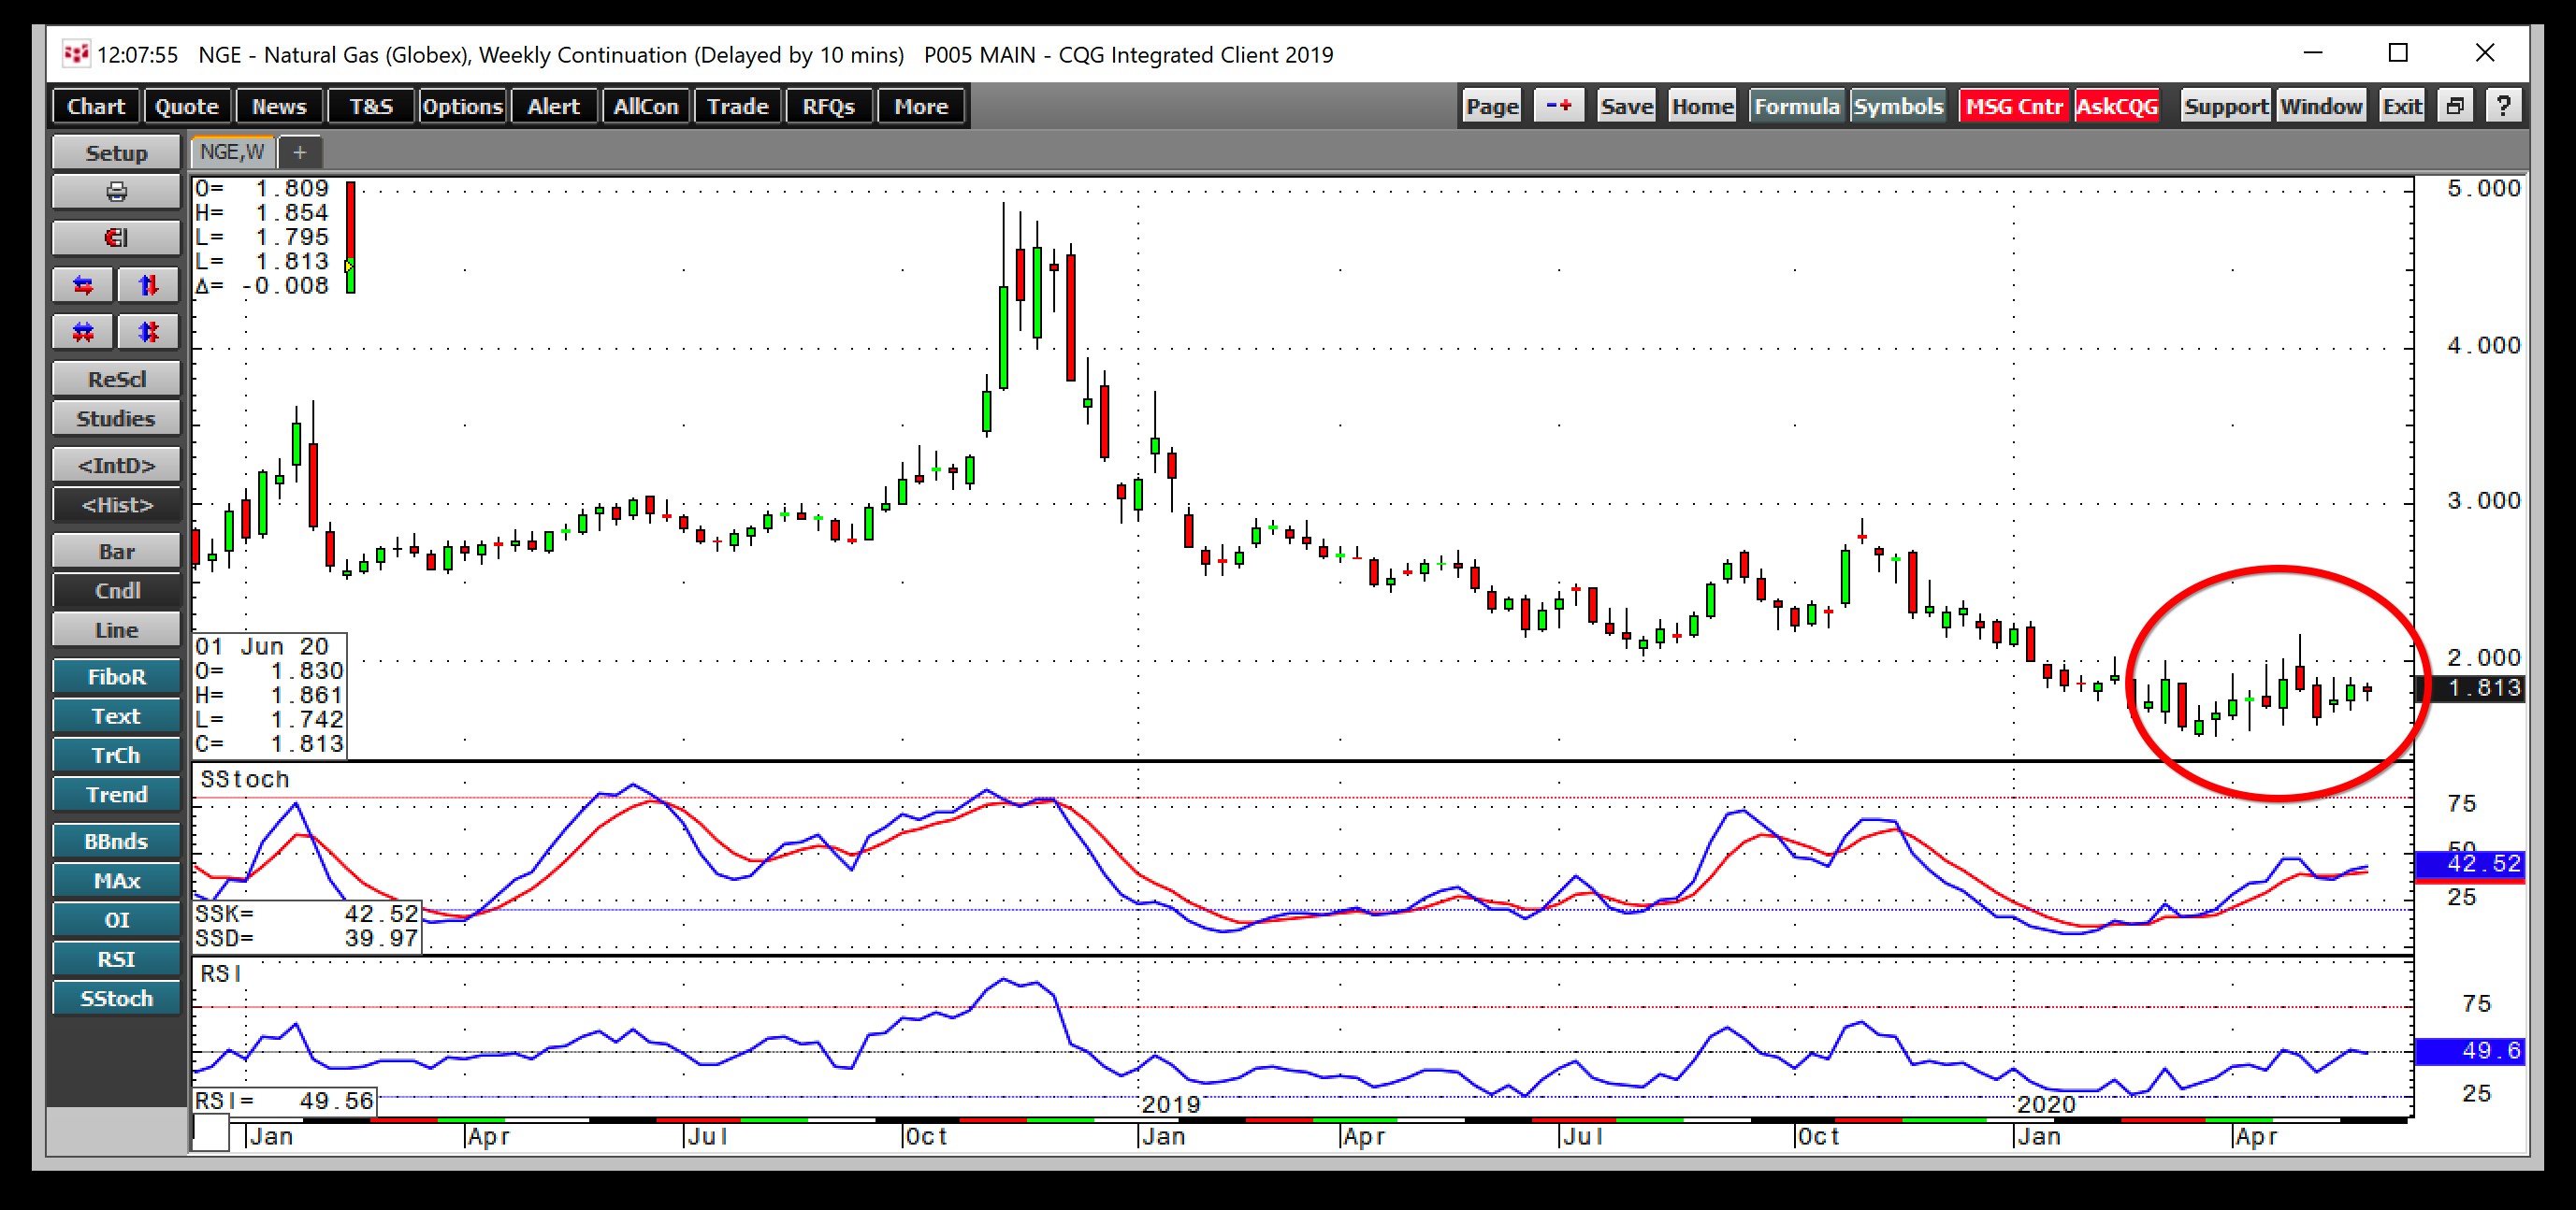
(Source: CQG)
The weekly chart shows that the pattern of higher lows since the continuous contract fell to a 25-year low in March was intact on June 4. Weekly price momentum and strength metrics were just below neutral readings but were rising.
If the price of natural gas remains above the $1.595 per MMBtu level, the constructive trend will stay in place. I favor buying natural gas futures and related ETF products on weakness and taking profits on rallies above the $2 level. I do not expect the price of the energy commodity to run away on the upside, but prefer the long side of the market at around $1.80 per MMBtu.