- Natural gas prices face short-term pressure from weak demand and a looming storm Francine.
- Francine threatens U.S. supply, while colder European temperatures boost heating demand and potentially higher prices.
- Despite current challenges, technical signals suggest natural gas could test key resistance levels, with a possible rally if winter demand increases.
- For less than $9 a month, InvestingPro's Fair Value tool helps you find which stocks to hold and which to dump at the click of a button.
Natural gas prices have been under pressure due to weak demand from Asia and a decline in energy consumption in the U.S. and Europe.
Additionally, the looming tropical storm Francine is expected to disrupt the natural gas supply in the U.S. as it potentially evolves into a hurricane.
Francine, set to impact the US Gulf Coast this week, risks halting exports. Other factors affecting the prices include potential power outages and reduced demand for natural gas used in cooling systems as temperatures drop.
Despite the potential disruptions in the U.S., natural gas prices in Europe may find support from increased demand due to colder weather. Night temperatures in Europe have been below seasonal norms, suggesting a colder winter ahead.
European Gas Prices Might Benefit from Colder Weather
The prospect of increased heating demand as temperatures fall may boost prices. Nighttime temperatures in Europe have already dipped below seasonal norms, raising expectations for a colder winter and potentially higher energy consumption.
The recent US Energy Information Administration (EIA) report supports this view.
It highlighted that natural gas stock increases were below expectations and the 5-year average. In Europe, high gas storage levels, at 91% after a milder winter, could buffer against significant price increases in the near term.
Looking ahead, while short-term pressures are evident, prices are expected to trend upwards in the medium to long term.
According to EIA data, around 38% of US gas demand comes from the power sector. With national electricity consumption on the rise and growing energy needs, demand is likely to increase in 2025 and beyond.
This, combined with the shift from less efficient solid fuels to natural gas for electricity generation, is expected to drive prices higher.
Technical Analysis: Resistance and Support Levels for Natural Gas
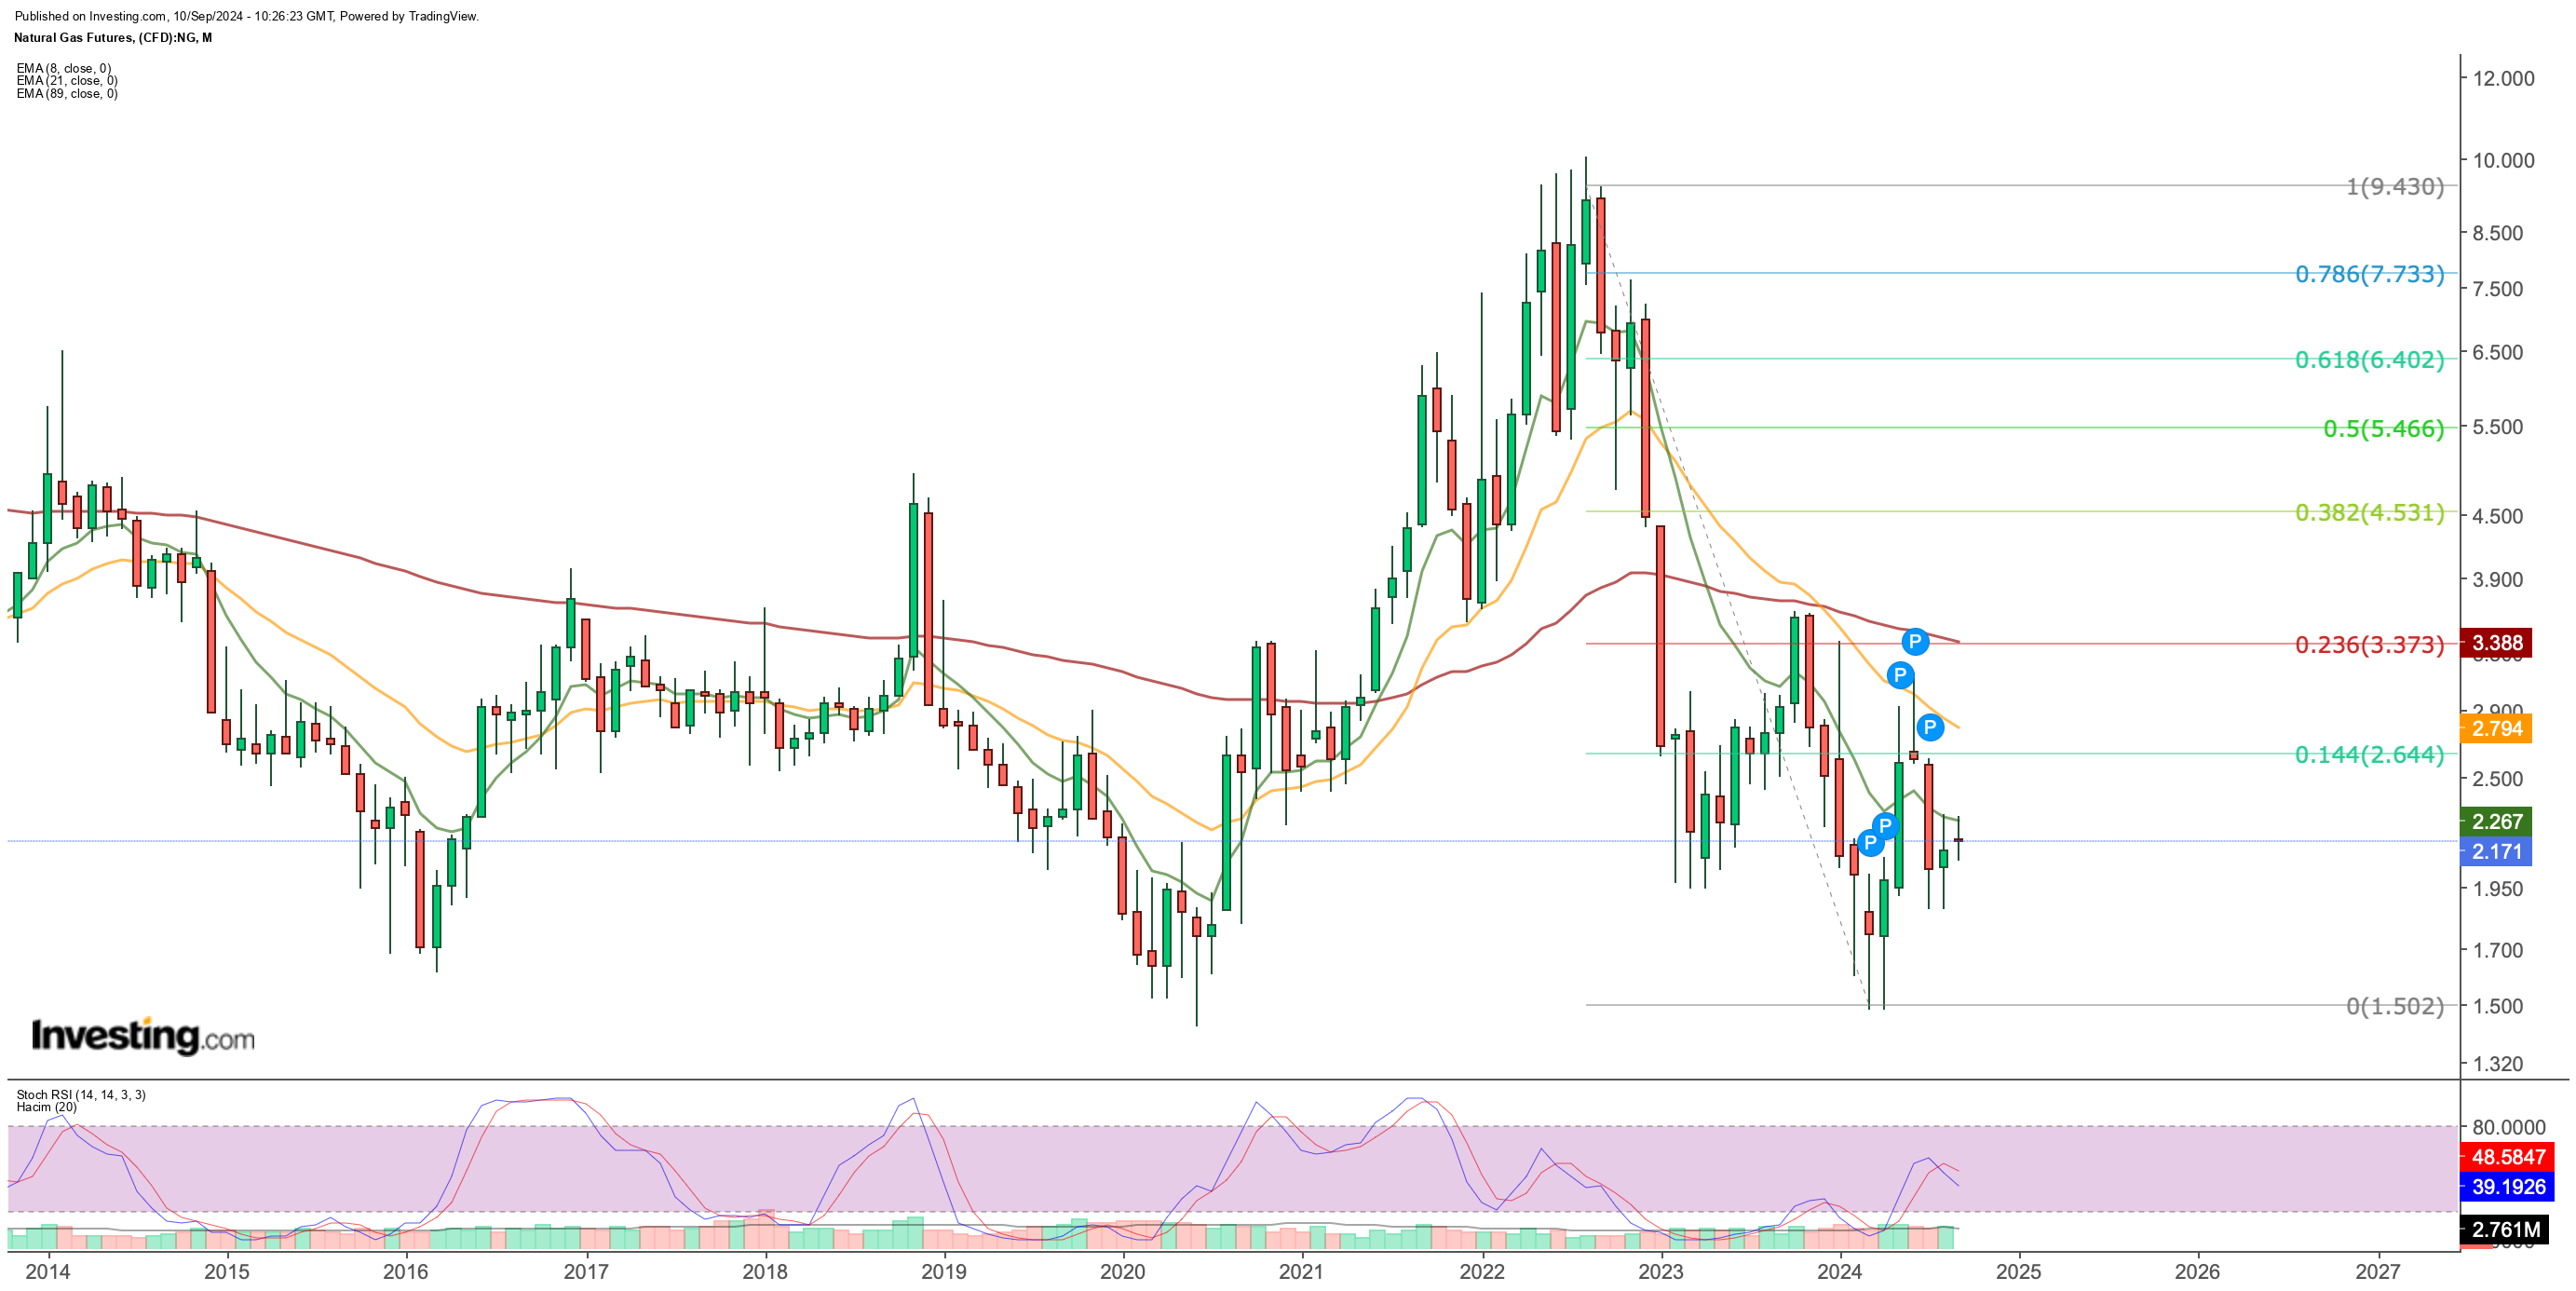
Examining the natural gas price chart, futures were recently rejected at the $3 mark and failed to surpass previous peak levels. The summer's downward trend has created a peak formation below earlier highs, indicating continued weakness.
However, the price decline over the summer found substantial support at $1.95 last month.
Despite current limitations due to weather events, if NG futures remain above the $2 average and short-term negative effects dissipate, they may test the long-term EMA at $2.80.

This EMA represents a critical resistance level from the past year, and a weekly close above it could signal a rally.
Based on retracement patterns from the $10 limit in August 2022, the $2.65-$3.30 range emerges as a key resistance zone, with the 89-EMA value aligning with this resistance area.
The Stochastic RSI on the weekly chart is trending upwards from the oversold area, and shorter-term EMA values also support a potential rebound.
As winter approaches and energy demand increases, NG futures might initially break through the nearest resistance line at $2.25 and then test the next critical resistance level necessary for a trend reversal.
A successful breakout could drive prices toward the Fib 0.618 level at $6.40. However, high gas storage, a milder winter, and the anticipated US storm could temper price increases.
In a bearish scenario, a drop below the $2 support zone could lead to a retest of the $1.50 level, the lowest point in the past four years.
***
Disclaimer: This article is written for informational purposes only; it does not constitute a solicitation, offer, advice, counsel or recommendation to invest as such it is not intended to incentivize the purchase of assets in any way. I would like to remind you that any type of asset, is evaluated from multiple perspectives and is highly risky and therefore, any investment decision and the associated risk remains with the investor.
