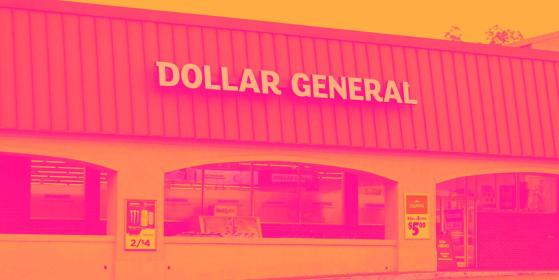
As the Q2 earnings season comes to a close, it’s time to take stock of this quarter’s best and worst performers in the non-discretionary retail industry, including Dollar General (NYSE:DG) and its peers.
Food is non-discretionary because it's essential for life (maybe not those Oreos?), so consumers naturally need a place to buy it. Selling food is a notoriously tough business, however, as the costs of procuring and transporting oftentimes perishable products and operating stores fit to sell those products can be high. Competition is also fierce because the alternatives are numerous. While online competition threatens all of retail, grocery is one of the least penetrated because of the nature of the product. Still, we could be one startup or innovation away from a paradigm shift.
The 8 non-discretionary retail stocks we track reported a satisfactory Q2. As a group, revenues beat analysts’ consensus estimates by 0.8% while next quarter’s revenue guidance was 1.1% below.
Stocks--especially those trading at higher multiples--had a strong end of 2023, but this year has seen periods of volatility. Mixed signals about inflation have led to uncertainty around rate cuts, and while some non-discretionary retail stocks have fared somewhat better than others, they have collectively declined. On average, share prices are down 3.1% since the latest earnings results.
Weakest Q2: Dollar General (NYSE:DG) Appealing to the budget-conscious consumer, Dollar General (NYSE:DG) is a discount retailer that sells a wide range of household essentials, groceries, apparel/beauty products, and seasonal merchandise.
Dollar General reported revenues of $10.21 billion, up 4.2% year on year. This print fell short of analysts’ expectations by 1.5%. Overall, it was a softer quarter for the company with underwhelming earnings guidance for the full year and a miss of analysts’ gross margin estimates.
“We made important progress on our Back to Basics plan in the second quarter,” said Todd Vasos, Dollar General’s chief executive officer.
Dollar General delivered the weakest performance against analyst estimates of the whole group. Unsurprisingly, the stock is down 34.7% since reporting and currently trades at $80.90.
Is now the time to buy Dollar General? Find out by reading the original article on StockStory, it’s free.
Best Q2: Sprouts (NASDAQ:SFM) Playing on the secular trend of healthier living, Sprouts Farmers Market (NASDAQ:SFM) is a grocery store chain emphasizing natural and organic products.
Sprouts reported revenues of $1.89 billion, up 11.9% year on year, outperforming analysts’ expectations by 3.2%. The business had a very strong quarter with optimistic earnings guidance for the full year and a solid beat of analysts’ earnings estimates.
Sprouts pulled off the biggest analyst estimates beat and fastest revenue growth among its peers. The market seems happy with the results as the stock is up 18.8% since reporting. It currently trades at $100.55.
Dollar Tree (NASDAQ:DLTR) A treasure hunt because there’s no guarantee of consistent product selection, Dollar Tree (NASDAQ:DLTR) is a discount retailer that sells general merchandise and select packaged food at extremely low prices.
Dollar Tree reported revenues of $7.38 billion, flat year on year, falling short of analysts’ expectations by 1.4%. It was a slower quarter as it posted a miss of analysts’ earnings estimates. Revenue guidance for next quarter also missed analysts’ expectations.
Dollar Tree delivered the slowest revenue growth and weakest full-year guidance update in the group. As expected, the stock is down 18.2% since the results and currently trades at $66.75.
Target (NYSE:NYSE:TGT) With a higher focus on style and aesthetics compared to other large general merchandise retailers, Target (NYSE:TGT) serves the suburban consumer who is looking for a wide range of products under one roof.
Target reported revenues of $25.45 billion, up 2.7% year on year. This number met analysts’ expectations. It was a very strong quarter as it also produced an impressive beat of analysts’ gross margin estimates and a solid beat of analysts’ earnings estimates.
The stock is up 2.4% since reporting and currently trades at $147.87.
Costco (NASDAQ:COST) Designed to be a one-stop shop for the suburban consumer, Costco (NASDAQ:COST) is a membership-only retail chain that sells groceries, apparel, toys, and household items, often in bulk quantities.
Costco reported revenues of $58.52 billion, up 9.1% year on year. This result met analysts’ expectations. It was a very strong quarter as it also logged an impressive beat of analysts’ gross margin estimates and a narrow beat of analysts’ earnings estimates.
The stock is up 10.6% since reporting and currently trades at $901.29.
This content was originally published on Stock Story

