- As we approach the end of 2023, investors are gearing up for 2024, focusing on potential high-growth stocks.
- In this piece, however, we will analyze the high-flyers of 2023 and whether their bullish momentum can carry into 2024.
- We will take a look at the top three performers of the S&P 500, which includes the likes of Nvidia and Meta Platforms.
- Looking to beat the market in 2024? Let our AI-powered ProPicks do the leg work for you, and never miss another bull market again. Learn More »
As we approach the end of 2023, investors are proactively fine-tuning their portfolios for the upcoming year, 2024.
While it's imperative to pinpoint new stocks poised for explosive growth in the coming year, a keen eye is also being kept on the strong performers of 2023, evaluating the potential for their bullish momentum to extend into 2024.
Within the S&P 500, three standout performers have dominated this year. In the following analysis, we will delve into each of these stocks individually, assessing whether their remarkable momentum can be sustained in the upcoming year.
Nvidia
In 2023, chipmaker Nvidia Corporation (NASDAQ:NVDA), which made the most of the artificial intelligence tailwind, managed to increase its market dominance in the production of AI processors up to 90% with its proactive approach to the sector.
This breakthrough, which opened a big gap with its closest competitors, was priced extremely positively by investors Nvidia's stock has risen 237% since the beginning of 2023, making it the most appreciated stock in the S&P 500.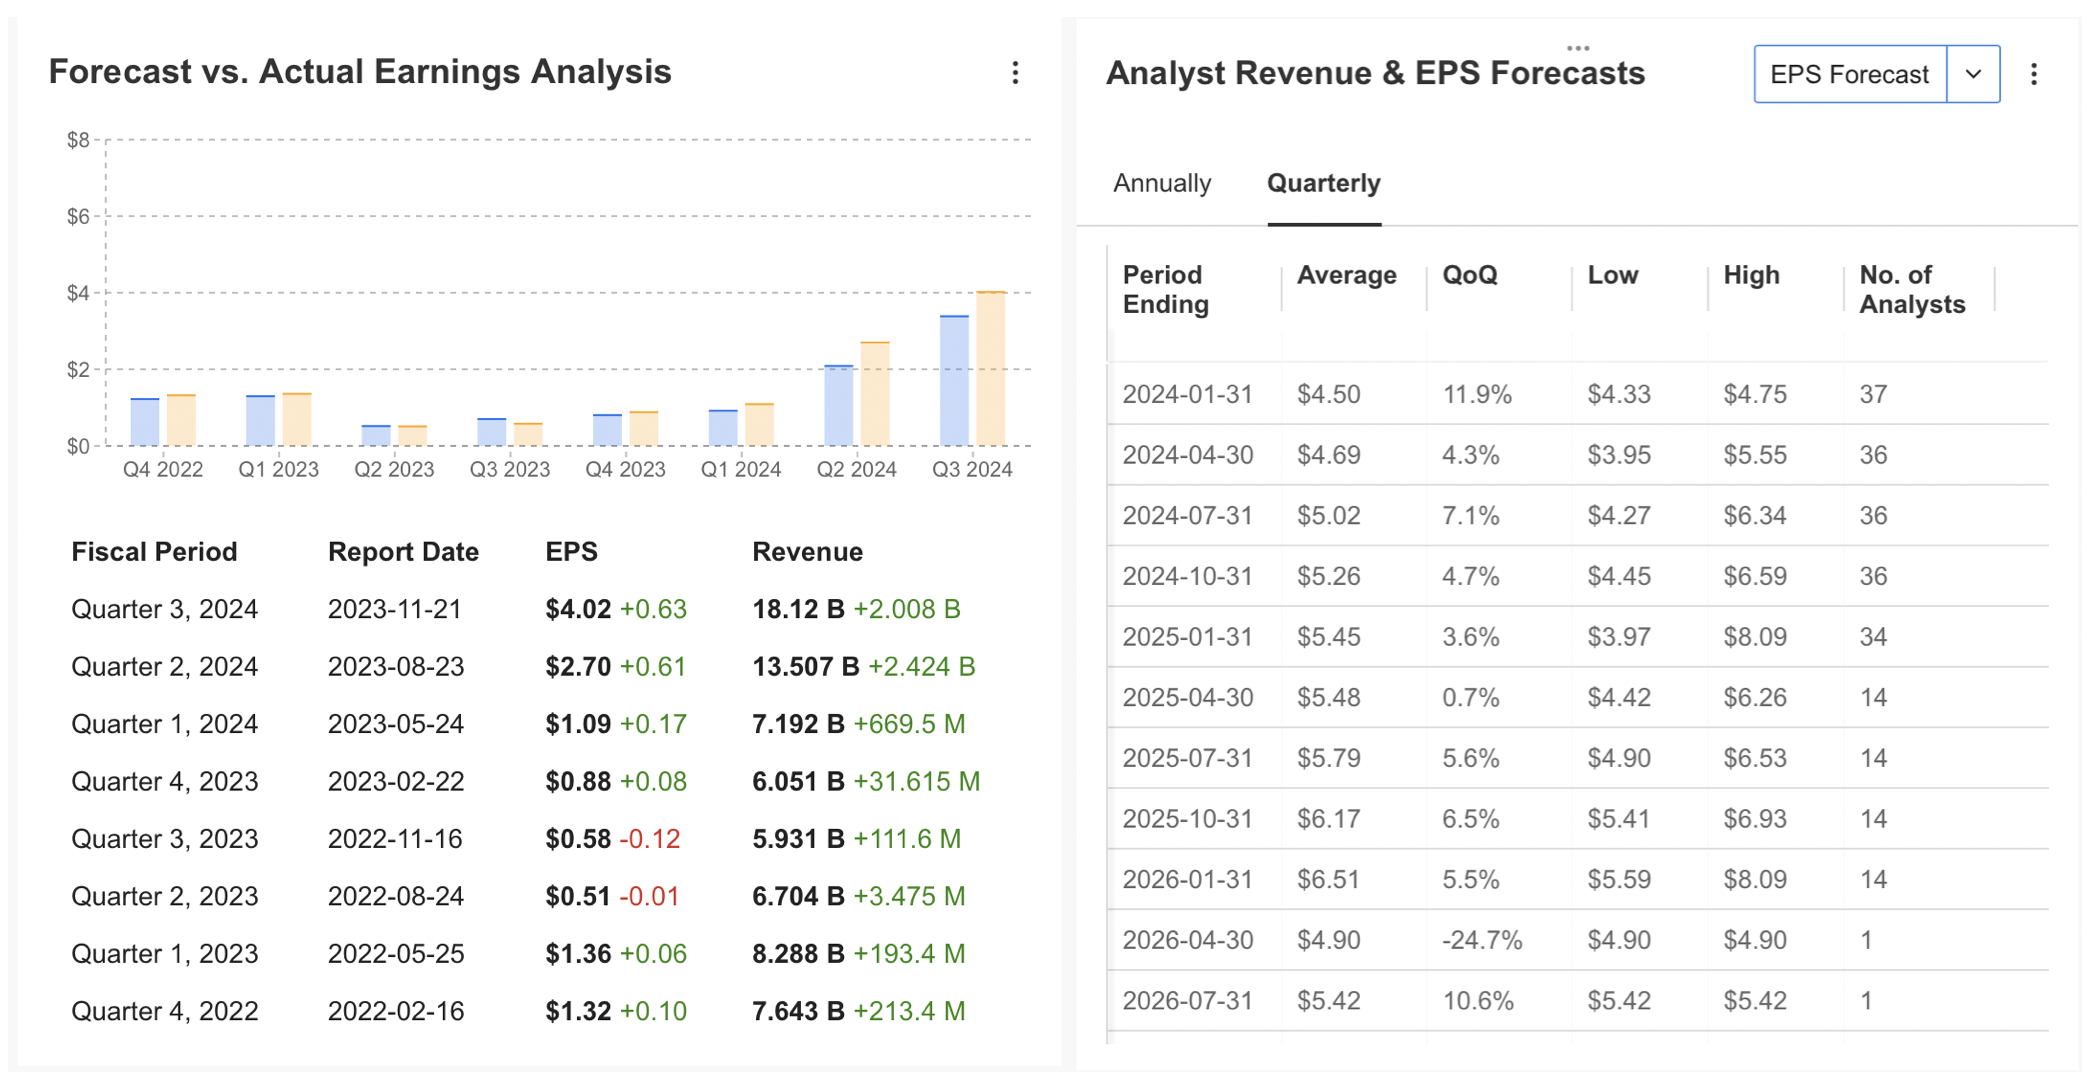
Source: InvestingPro
The company's robust financial performance continues to positively influence its share price. Notably, it has consistently exceeded expectations in terms of profit per share and revenue growth over the past year.
Although Nvidia's share experienced significant momentum in the first half of the year, there was a slight slowdown in the second half. Nevertheless, the overall outlook remains bullish.
Analyzing the 2024 forecasts for Nvidia on InvestingPro, it is evident that analysts widely anticipate sustained revenue and profit growth.
Thirty-six analysts project a growth rate exceeding 10% for both revenue and profit, especially in the first quarter of the upcoming year.
Experts assert that there is considerable room for growth in the artificial intelligence sector, and Nvidia, a key producer of high-performance chips for this sector, is expected to carry the positive trend observed in 2023 into the next year.
According to InvestingPro's fair value analysis, the current fair price for NVDA is calculated at $510 based on existing valuations. Analyst estimates suggest that the stock could potentially rise to an average of $650 in 2024. 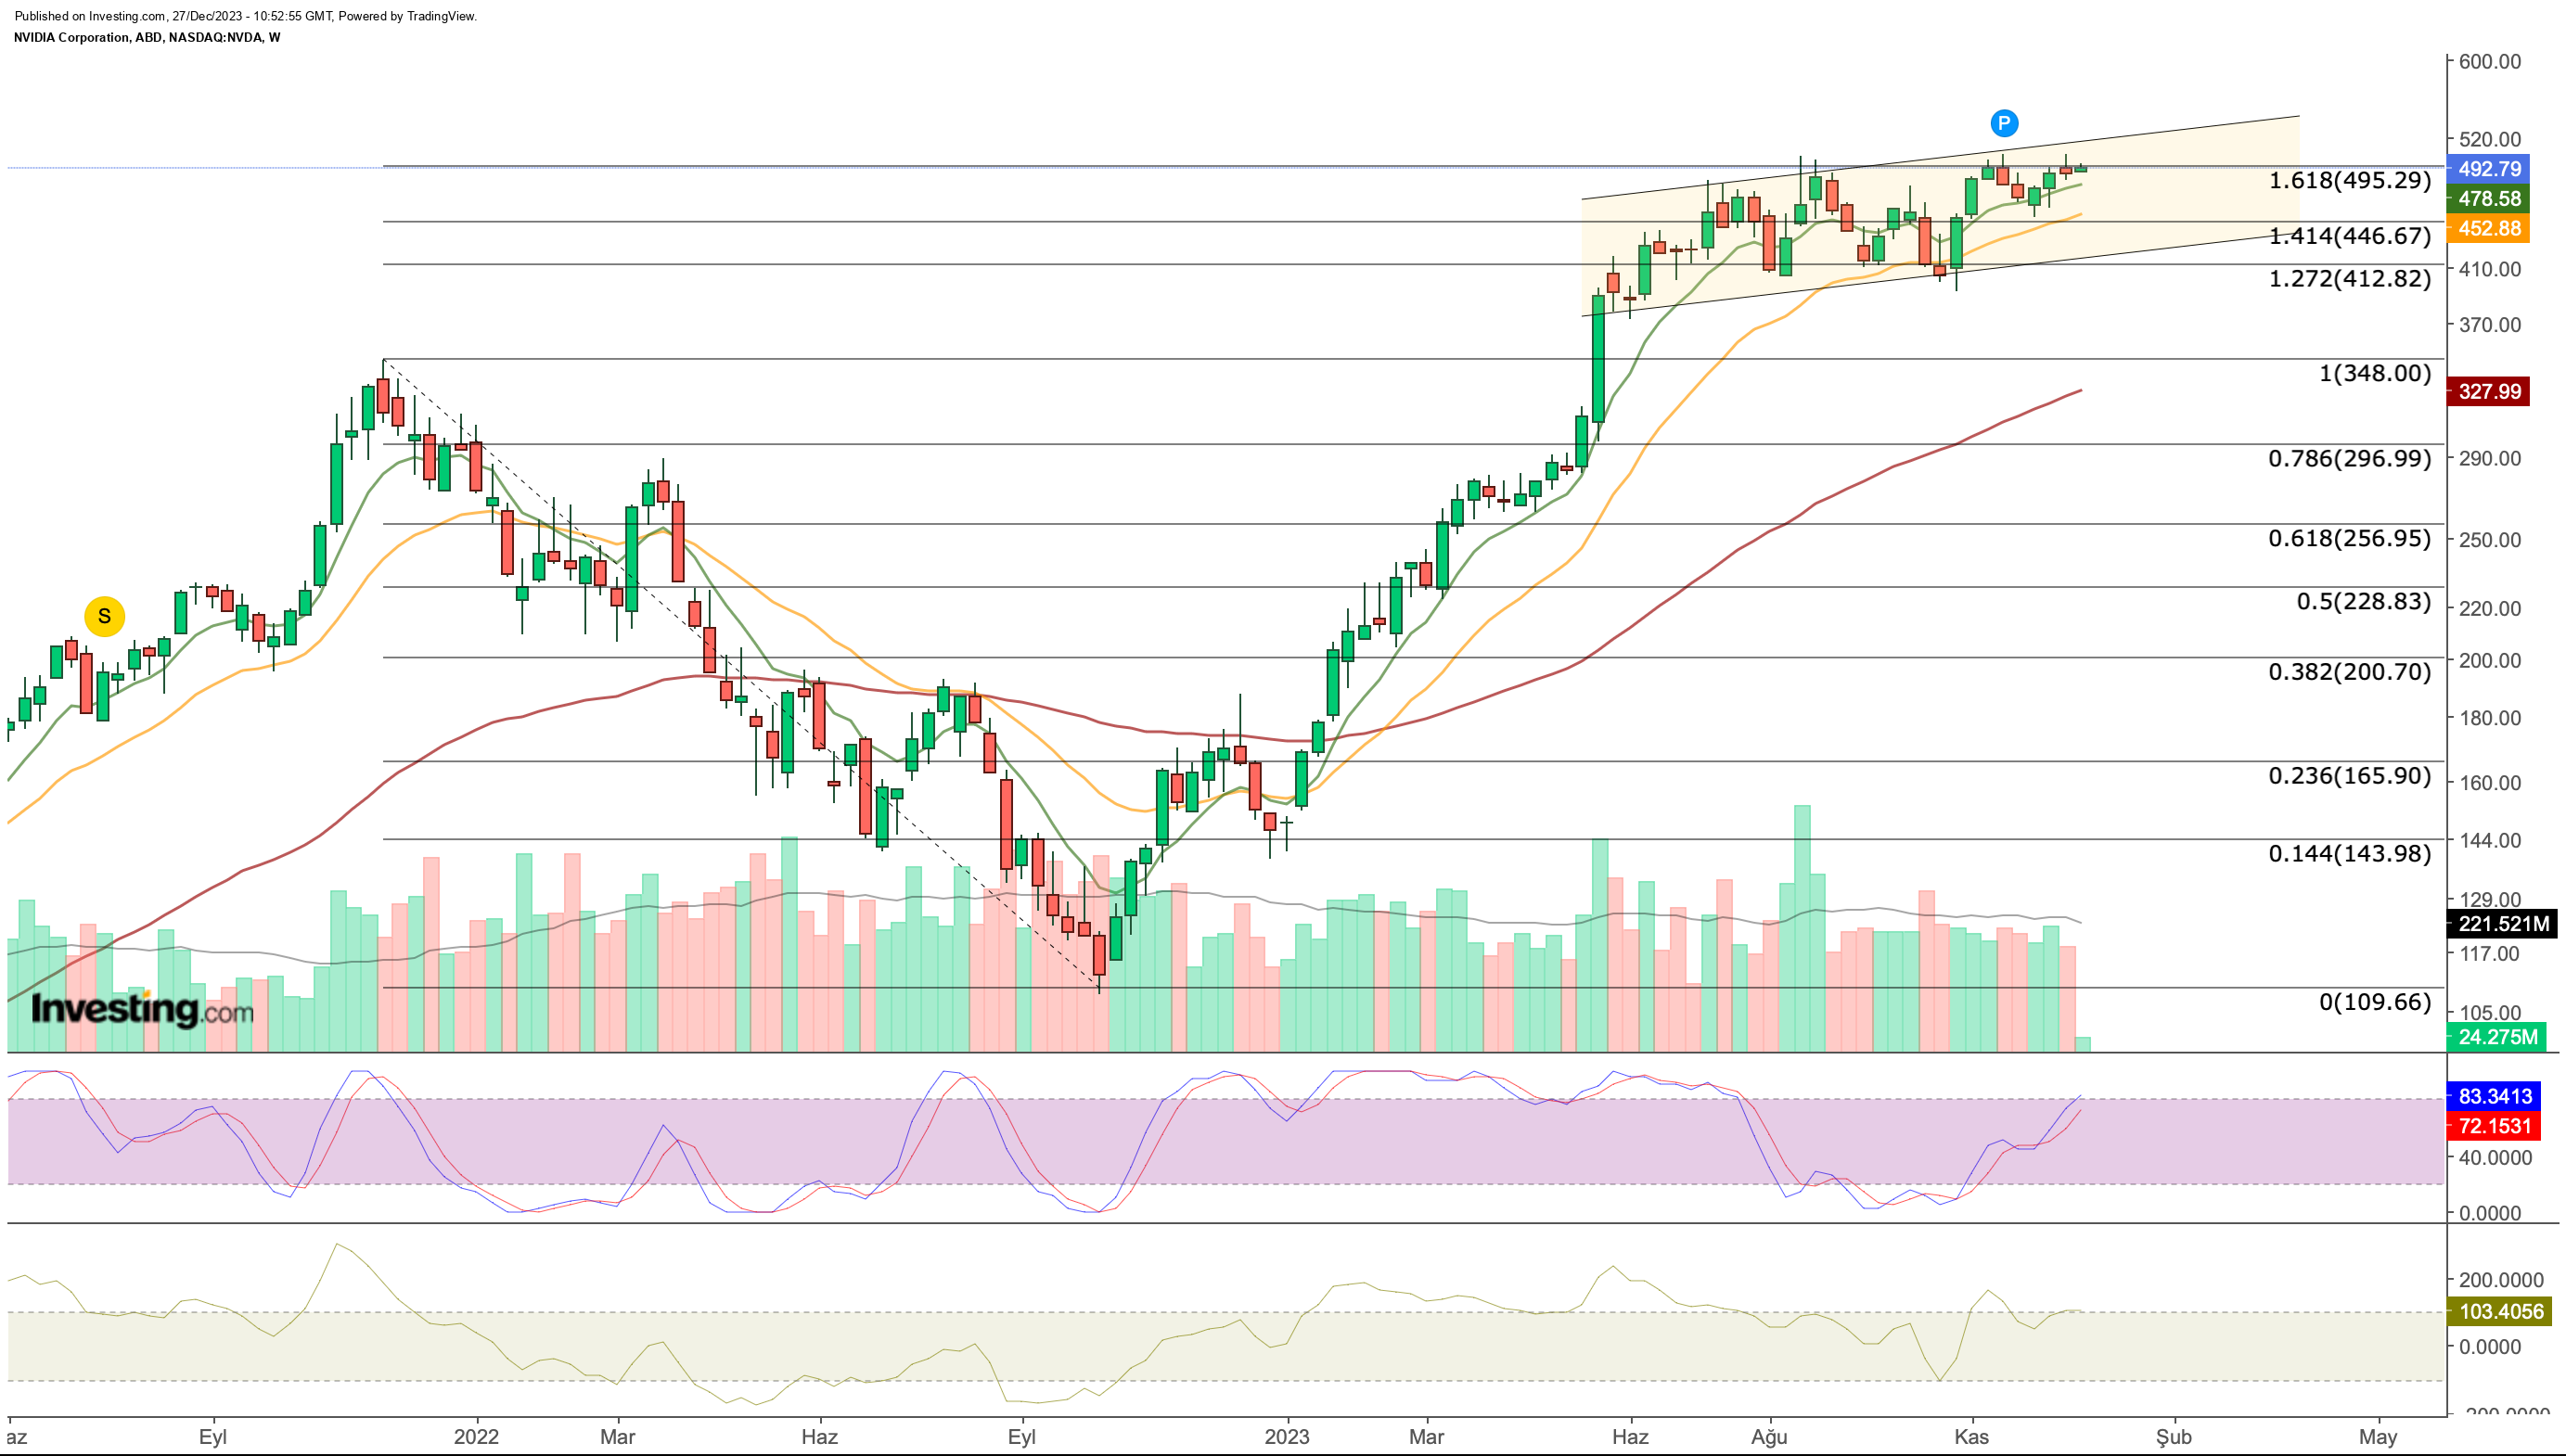
Technically speaking, NVDA's continuation of its slightly upward trending channel movement in the second half of the year is the first striking view.
On this path, an average of $490 (Fib 1,618) has formed a resistance.
If the $500 band is caught with weekly closes, technically we can see that NVDA can move to the next target zone in the $700 band. In the lower zone, around $410 seems to be an important support to keep the trend intact.
Meta Platforms
Meta Platforms (NASDAQ:META) has achieved the second-highest return among S&P 500 stocks this year with a nearly 195% increase in value.
Although the company has made significant investments in the Metaverse and virtual reality in recent years, it has not been able to achieve the desired momentum in this field due to the lower-than-expected growth of the sector and some legal obstacles.
However, Meta's firm foothold in the social media industry continues to make a significant contribution to the company's returns. 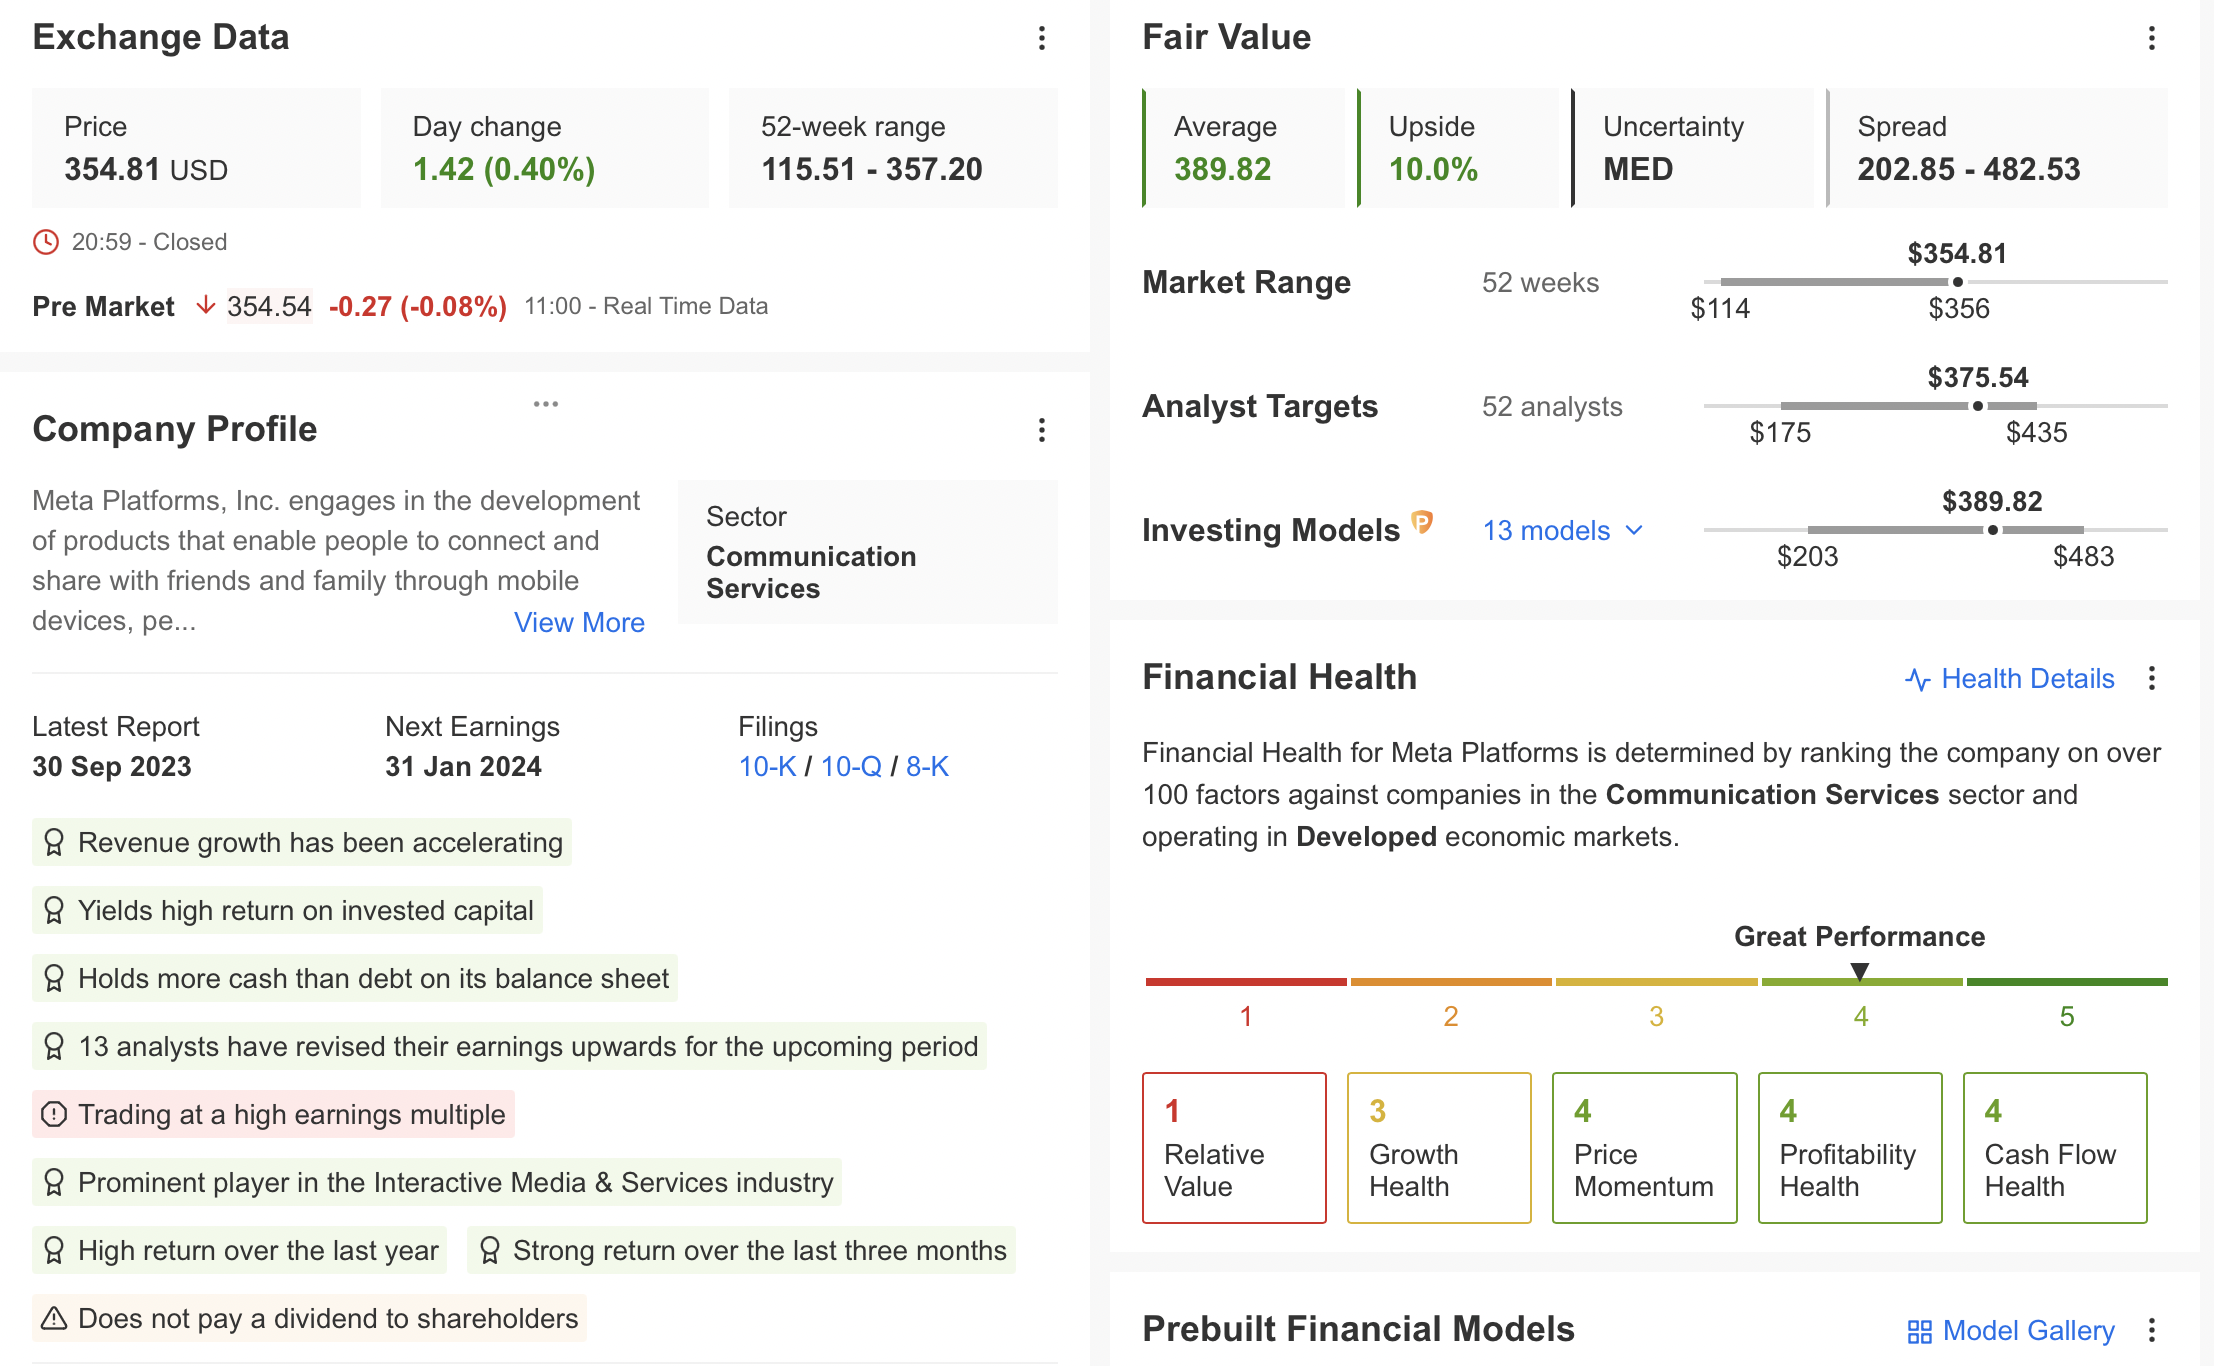
Source: InvestingPro
This year, Meta expanded its social media footprint with Threads, a posting app similar to X after Facebook, Instagram, and WhatsApp.
In addition to the continued rise of Meta stock throughout the year, the company continued to exceed expectations as it announced strong financial results throughout the year.
Throughout 2024, if revenue growth continues to exceed expectations, META's share is likely to maintain its trend in the new year. 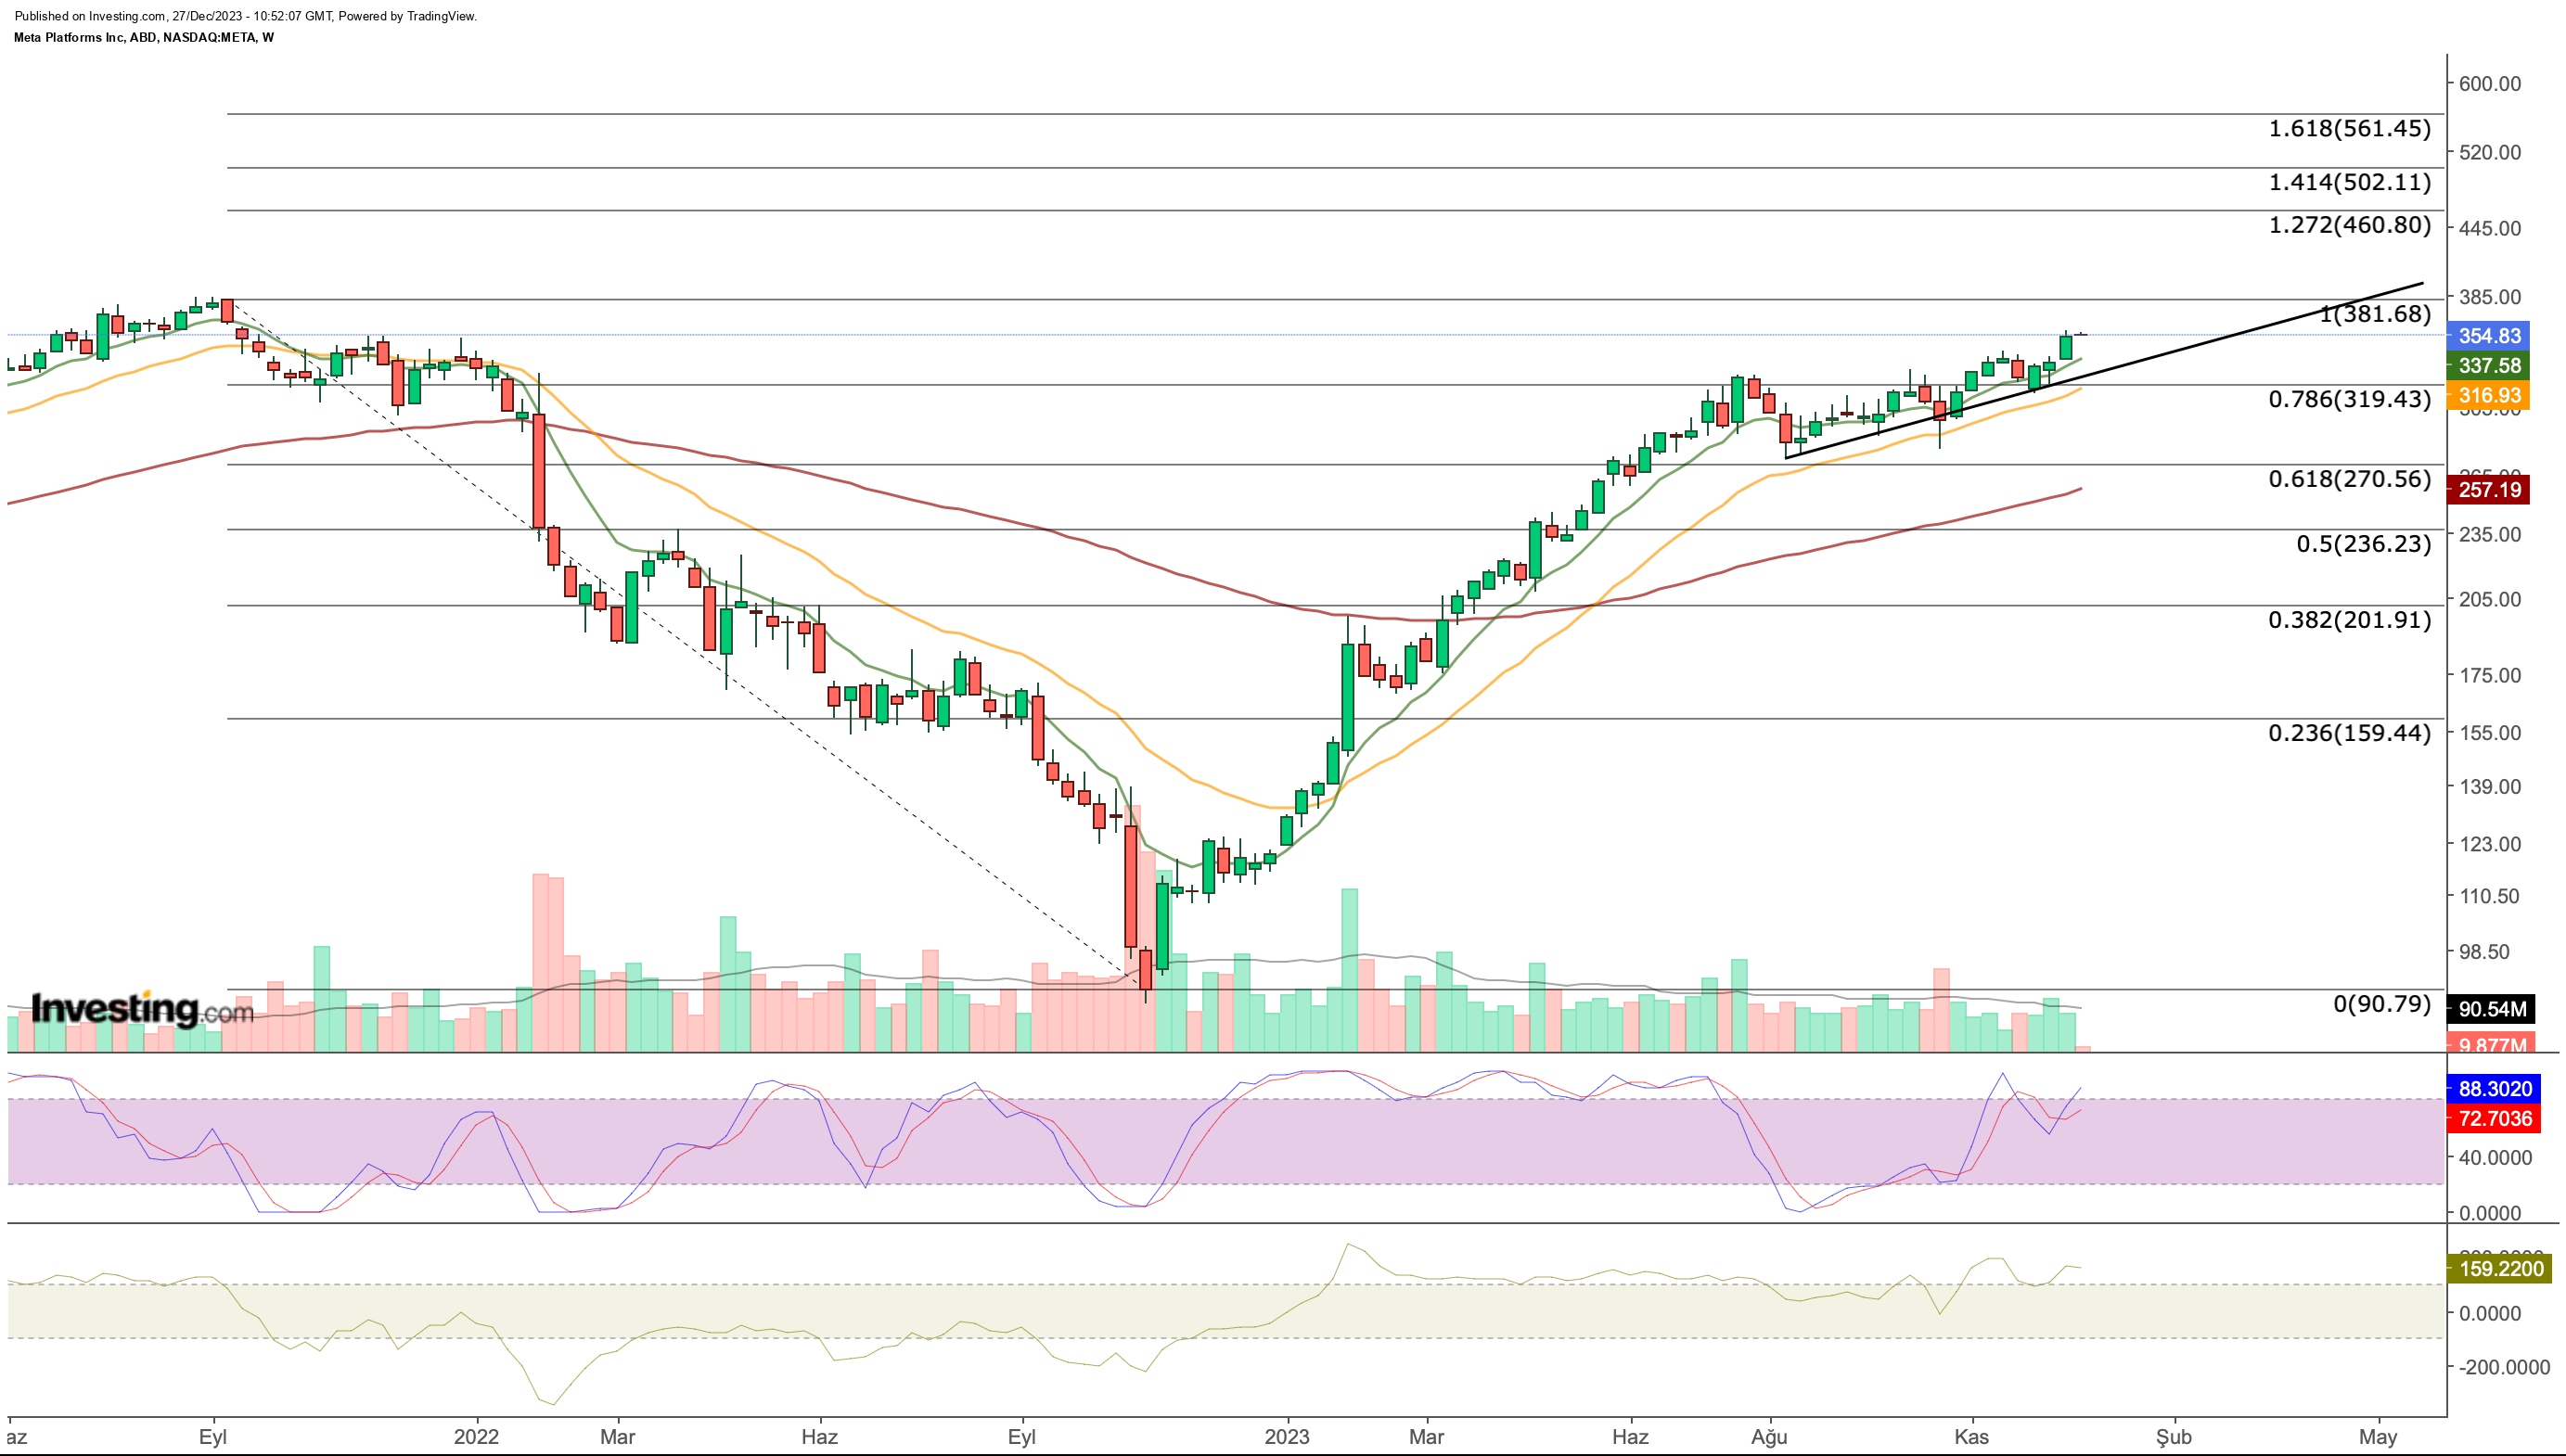
While META moved in a downtrend in the one year until the end of 2022, it mostly compensated for its losses in the previous year with this year's gains.
The resistance point 320 dollars (Fib 0.786), which the share price had difficulty with, especially in the July - November period, can be interpreted as an important move.
Technically, the next resistance for META seems to be the 2021 peak of $381. If this price is exceeded with weekly closures, we can see that the stock can move towards the range of $460 - $560 in 2024.
Royal Caribbean Cruises
Shares of Royal Caribbean Cruises (NYSE:RCL), one of the leading companies in the cruise industry, entered the top 3 in the S&P 500 with a 160% increase in value since the beginning of the year and managed to exceed its value in the pre-Covid period.
With the acceleration of vacation spending in the post-pandemic period, the cruise company operating worldwide has also managed to increase its revenue by 66% in the last year.
Although the company has gained significant growth momentum this year, it is possible to see some problems when looking at its financials.
If we look at Royal Caribbean's financial summary via InvestingPro; we can see that it has a problem such as short-term debt obligations being above liquid assets.
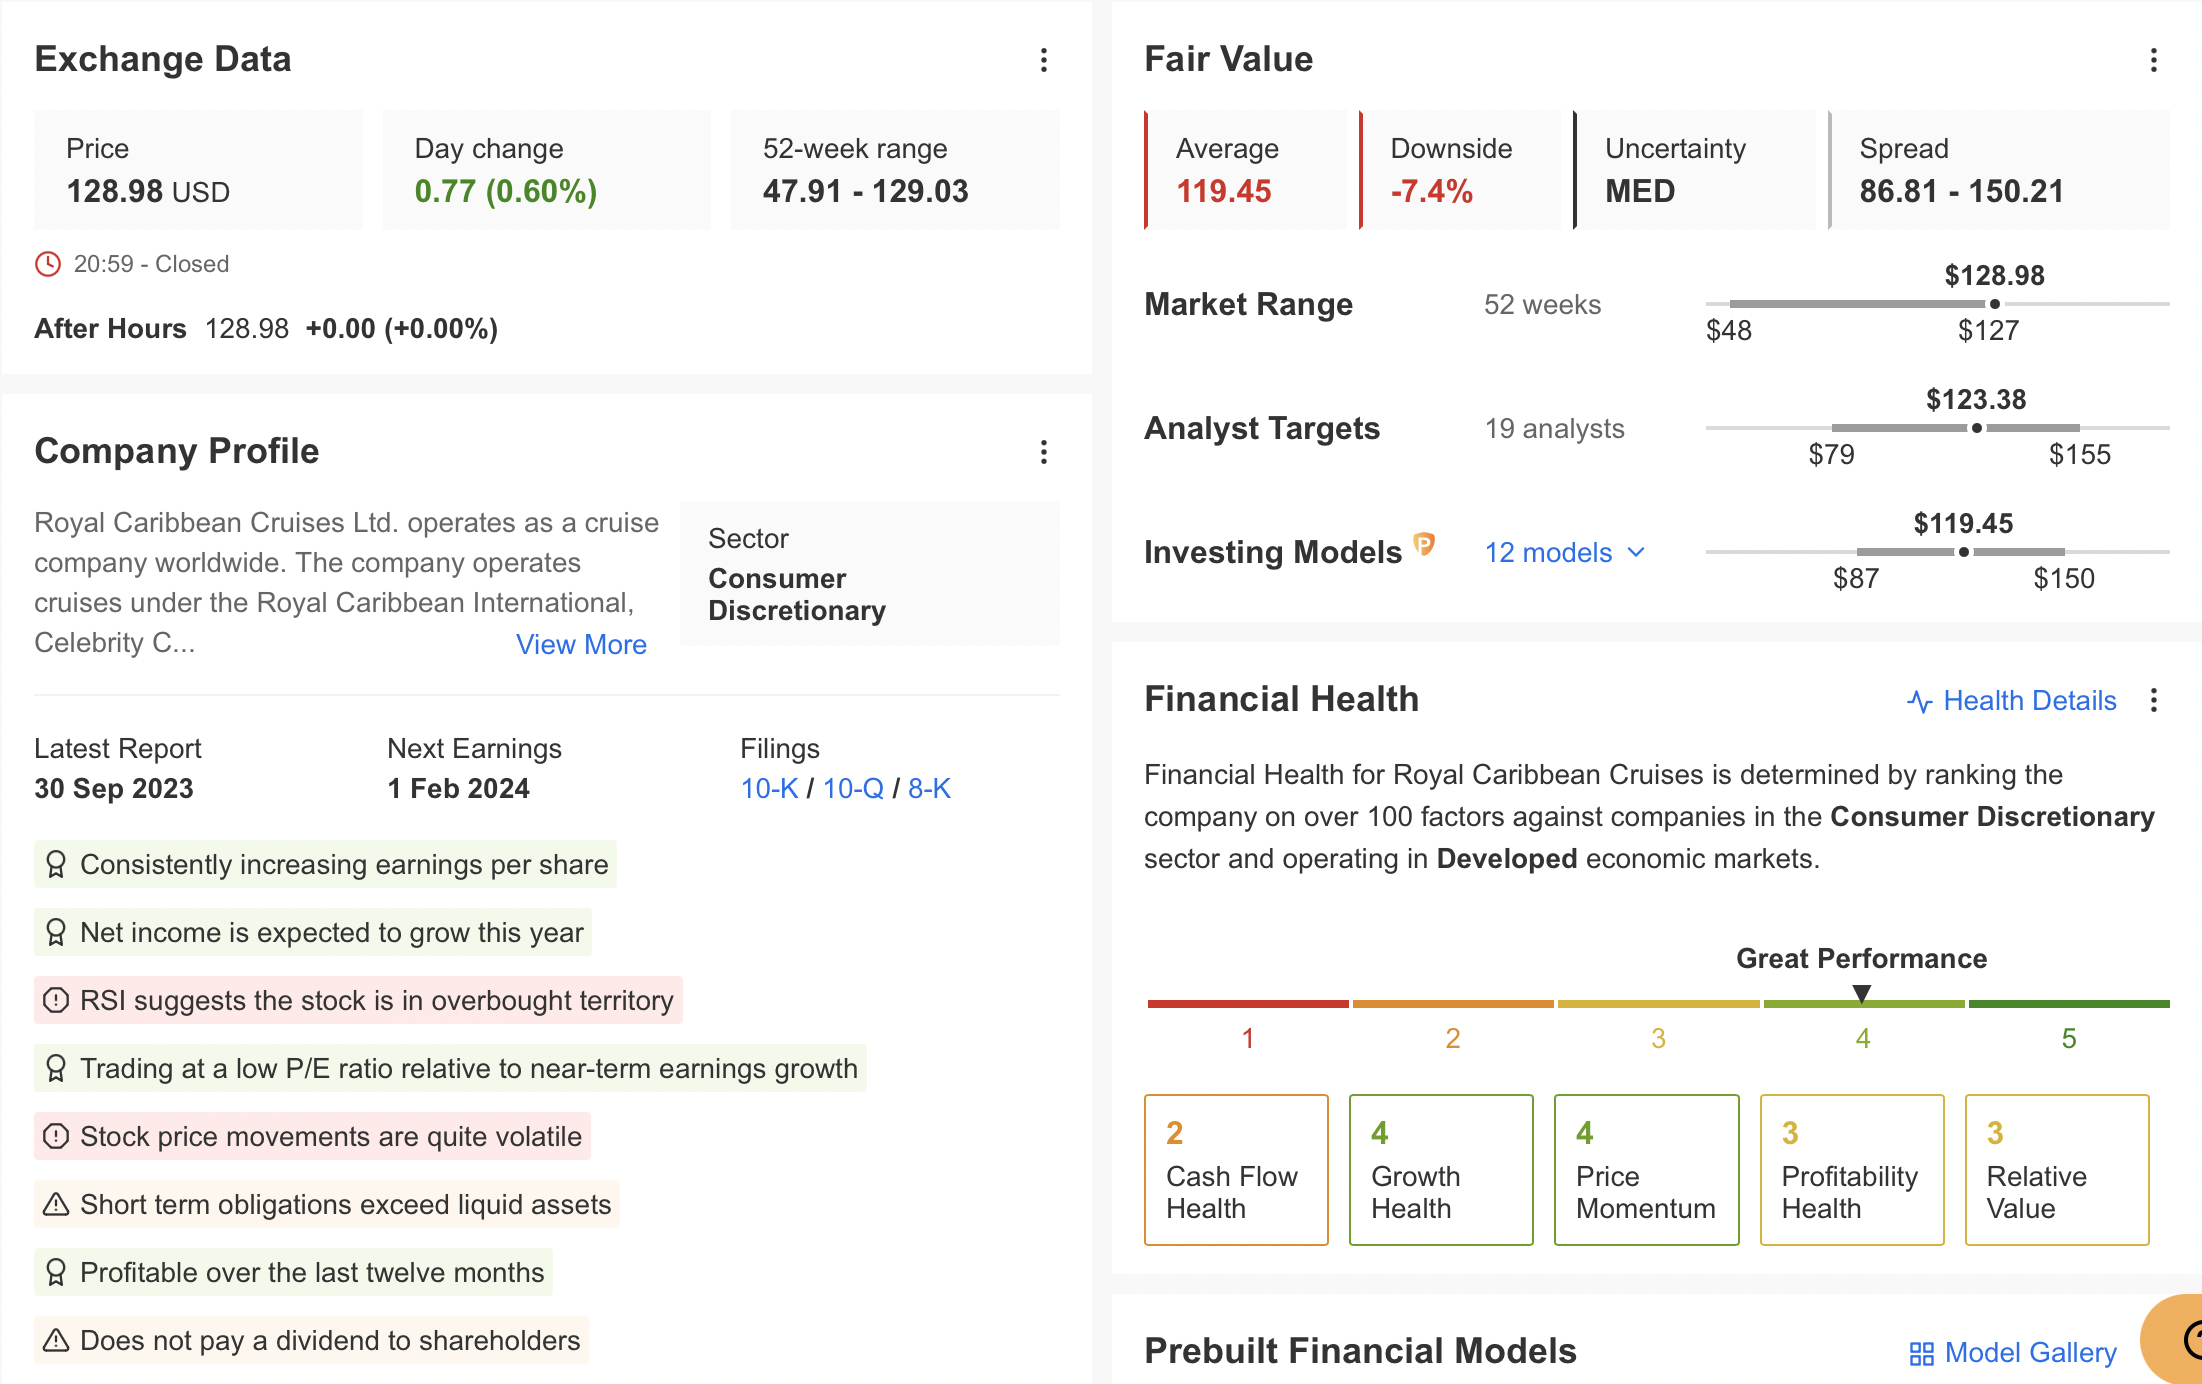
Source: InvestingPro
This is due to the company's high amount of debt to survive due to its falling revenue during the pandemic. The company has survived this troubled period but has also seen a weakening in its balance sheet after the tough period in 2020 times.
Nevertheless, the company, which has generated significant cash flow this year, has managed to remain stable while having no problems with debt repayment.
The volatility of the share price and the fact that the company does not distribute dividends give the impression that it is not very favorable for long-term investment at the moment, considering its high indebtedness.
If we look at the positive aspects of RCL; we can count the steady increase in EPS this year, the continued growth in net profit, and the low P/E ratio accordingly.
In 2024, demand for cruises will have a direct impact on RCL's performance.
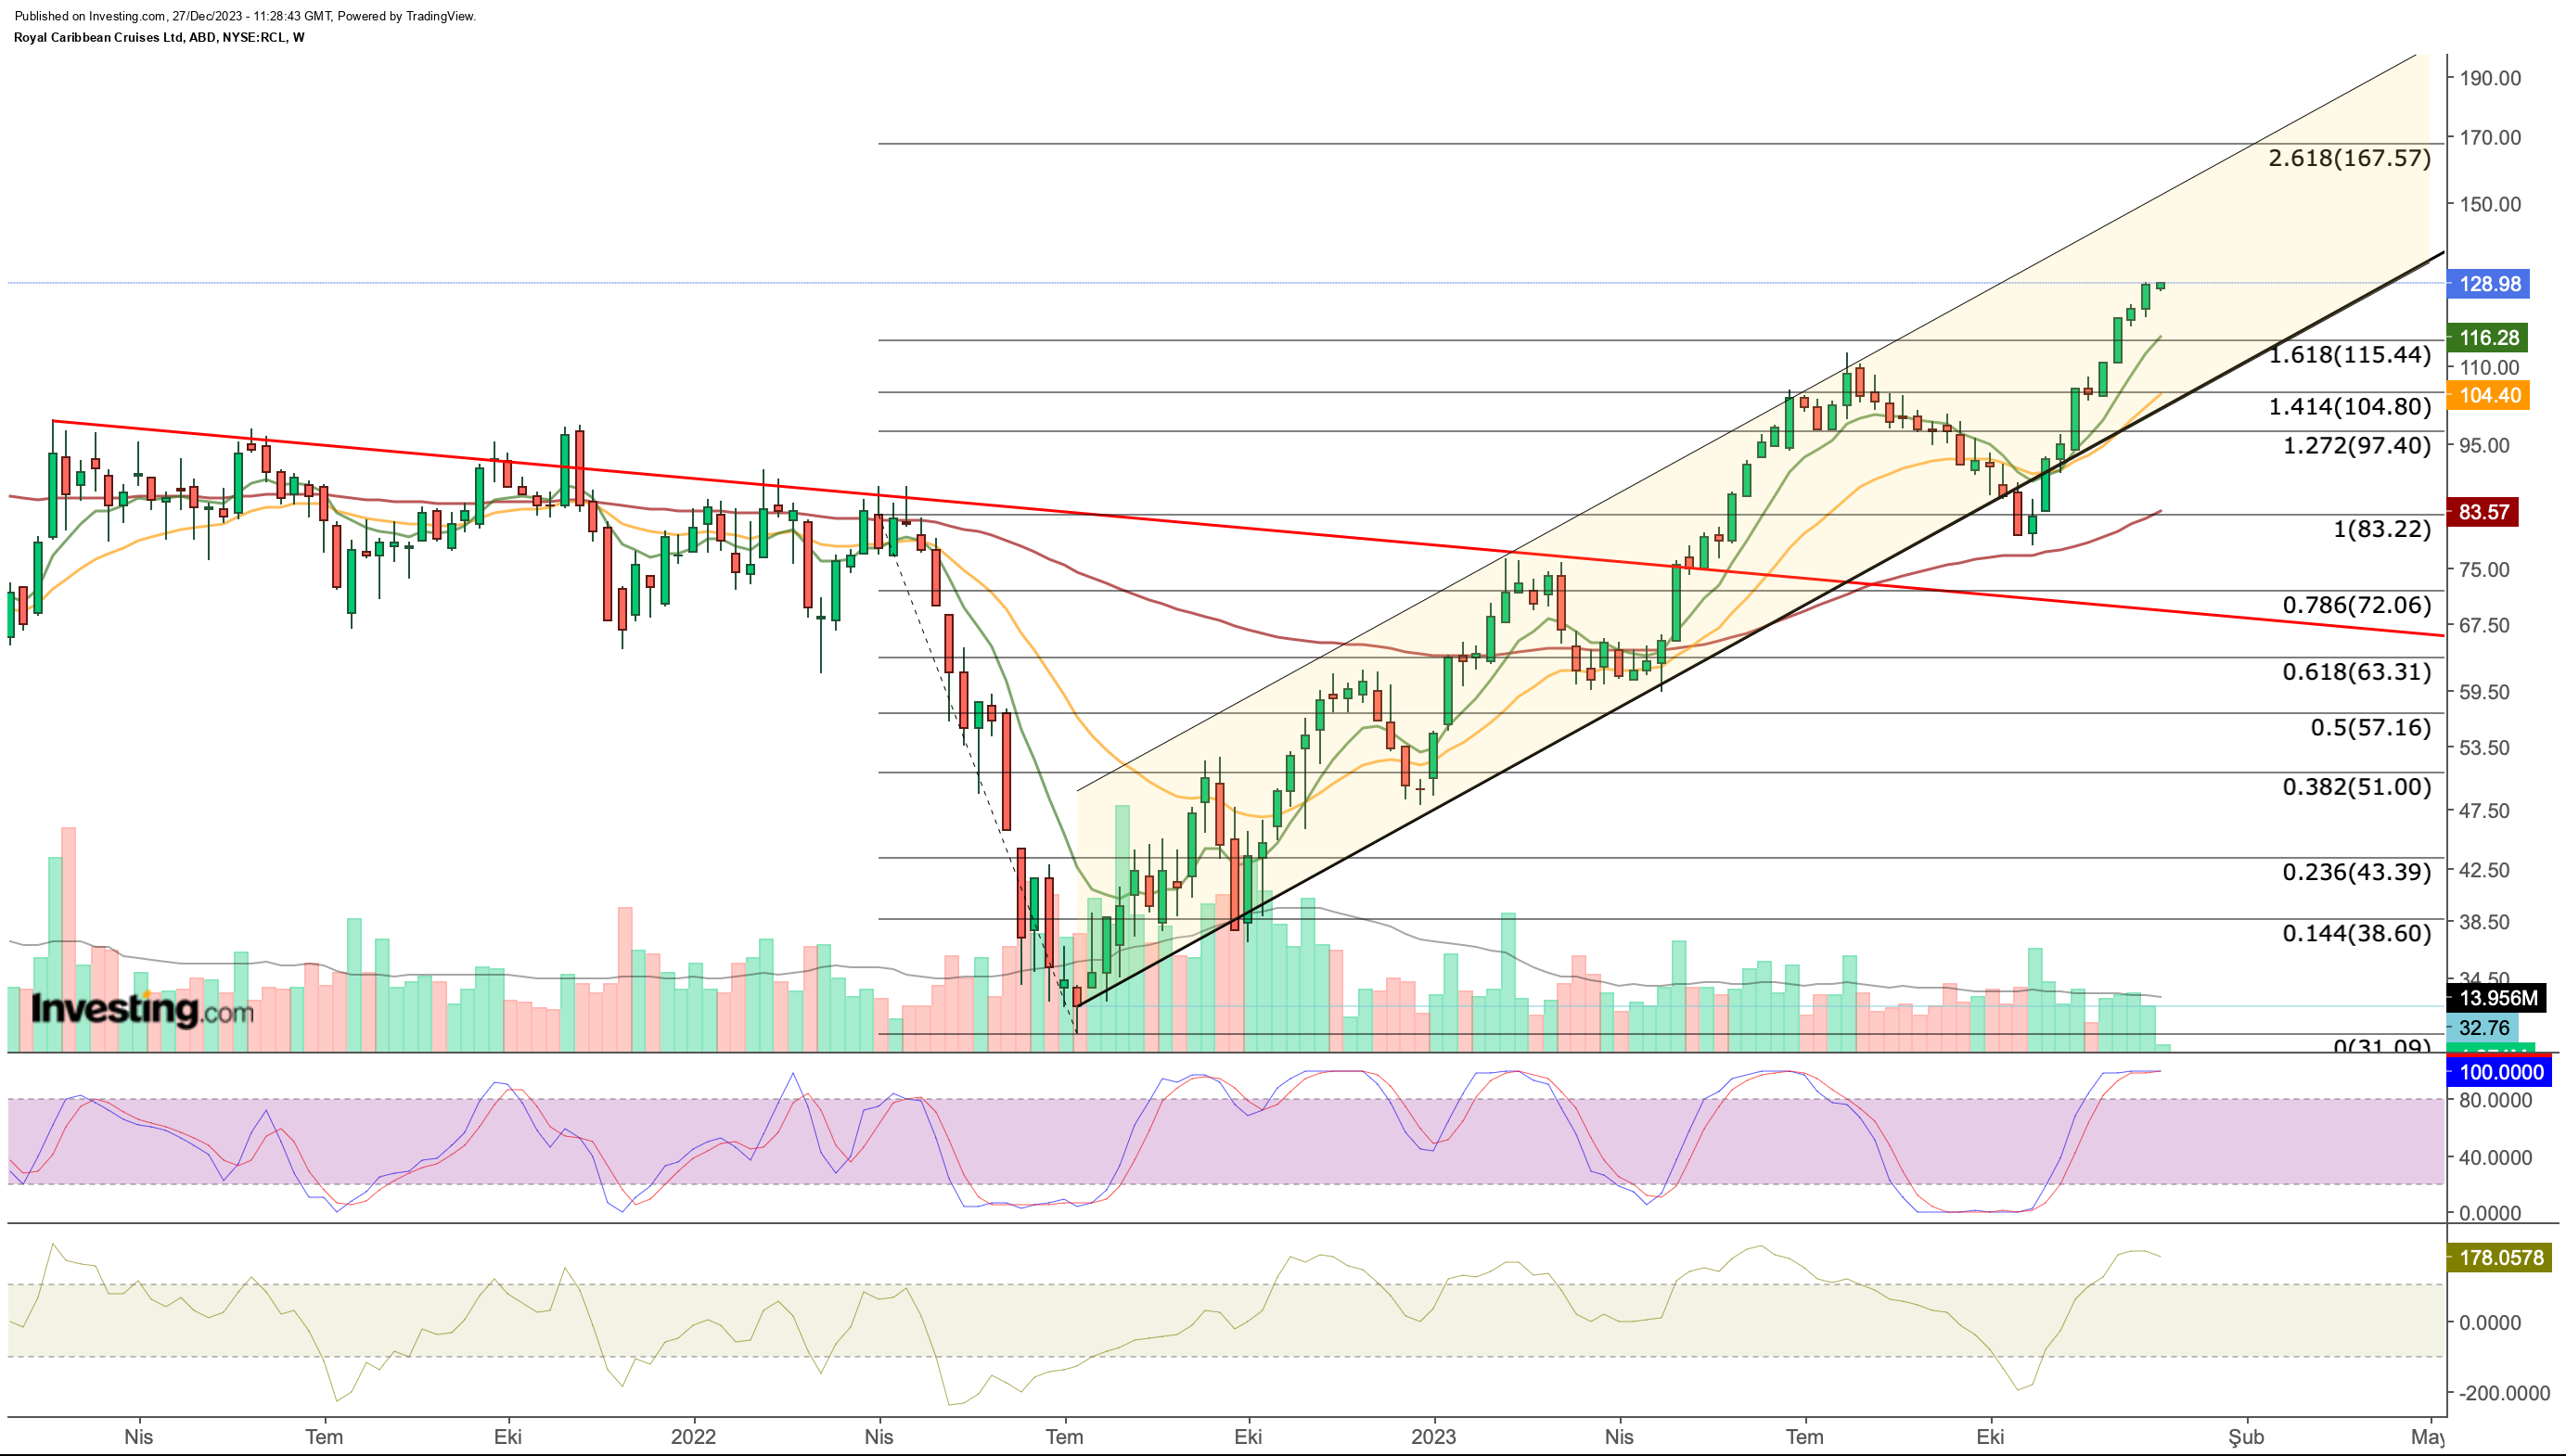
When we look at RCL from a technical point of view, the first striking detail is that the stock maintains its trend and moves along the rising channel.
In this way, if the share, which managed to pass the $ 100 - $ 115 resistance area, can continue to increase its cash flow regularly, the stock can move towards the $ 160 band in the same direction.
In the lower region, $115 stands as the first support price, while below this value, a correction may come up to the $ 80 band below $100 in weekly closures.
InvestingPro fair value analysis, on the other hand, sees the stock slightly overvalued according to the latest financial results and predicts a decline to $ 119.
***
In 2024, let hard decisions become easy with our AI-powered stock-picking tool.
Have you ever found yourself faced with the question: which stock should I buy next?
Luckily, this feeling is long gone for ProPicks users. Using state-of-the-art AI technology, a provides six market-beating stock-picking strategies, including the flagship "Tech Titans," which outperformed the market by 670% over the last decade.
Disclaimer: The author does not own any of these shares. This content, which is prepared for purely educational purposes, cannot be considered as investment advice.
Which stock should you buy in your very next trade?
With valuations skyrocketing in 2024, many investors are uneasy putting more money into stocks. Unsure where to invest next? Get access to our proven portfolios and discover high-potential opportunities.
In 2024 alone, ProPicks AI identified 2 stocks that surged over 150%, 4 additional stocks that leaped over 30%, and 3 more that climbed over 25%. That's an impressive track record.
With portfolios tailored for Dow stocks, S&P stocks, Tech stocks, and Mid Cap stocks, you can explore various wealth-building strategies.

