This post was written exclusively for Investing.com
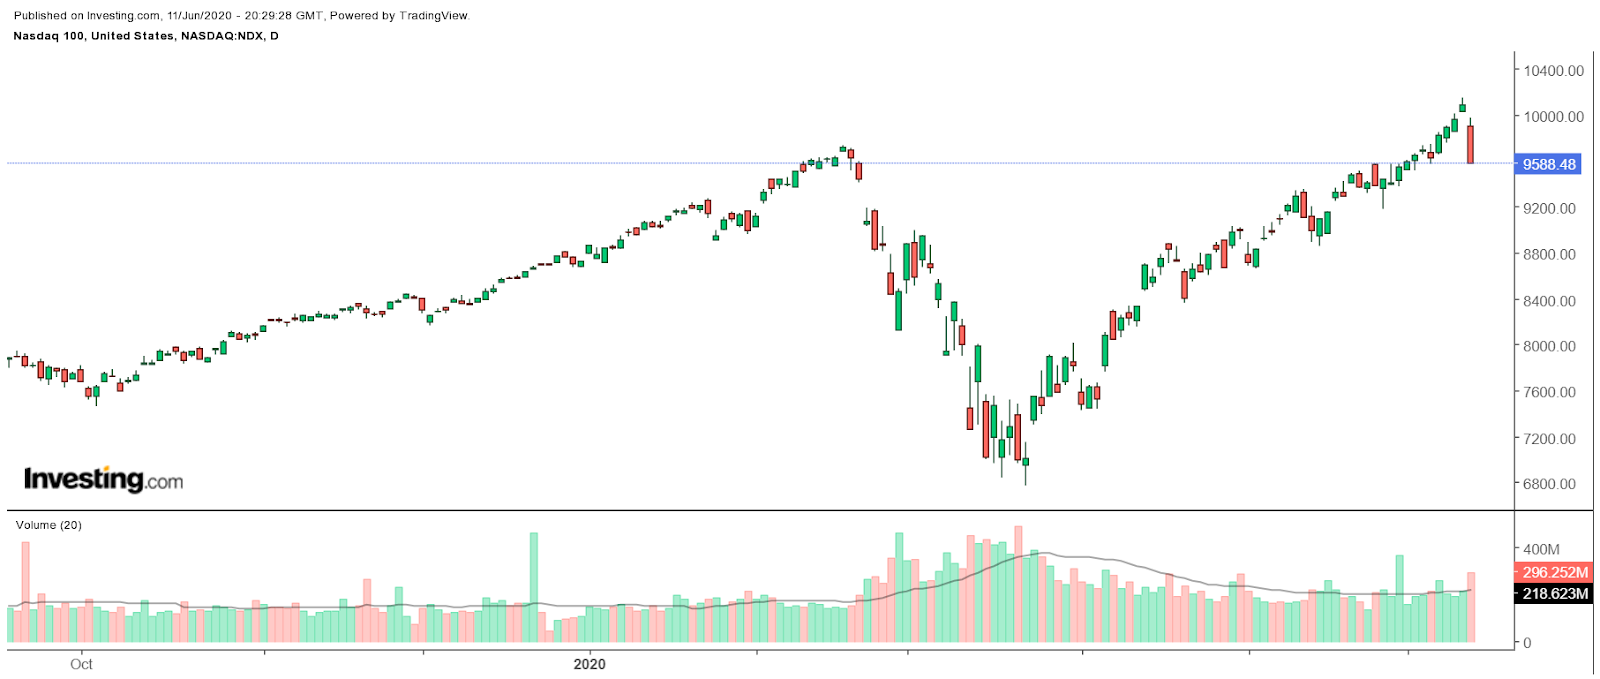
The NASDAQ 100 has been one of the hottest indexes in 2020, rebounding by nearly 50% from its March lows, closing at a record high on June 10. Despite the massive move higher, the options market shows some traders appear to be betting that the rally comes to an end. The open interest for puts on the NASDAQ 100 ETF - the Invesco (NYSE:IVZ) QQQ - (NASDAQ:QQQ) have steadily risen, and it is likely a sign that some are betting on a market reversal. It may result in the ETF falling by as much as 11%.
The index already fell sharply on June 11, by about 5%, following the latest Federal Reserve policy announcement and worries around increasing coronavirus cases in the US. But there may be more bad news on the way because QQQ broke a few key technical levels of support, which suggests a much more significant decline could be ahead.

Betting on A Decline
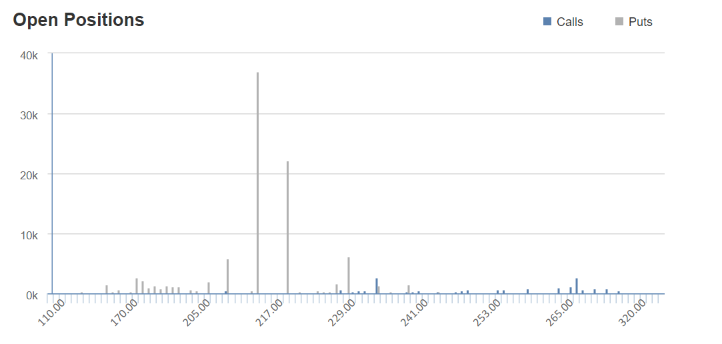
On June 10, open interest for October 16 $215 puts - which give the holder the right, but not the obligation, to sell shares in QQQ at this price by this date - topped 35,000 contracts, making this the biggest strike by open interest. The data shows that of these puts, 25,000 contracts changed hands at $6.95 per contract. QQQ closed at $234 on Thursday, so in this case, the holder would need to see the price drop to around $209 to make a profit on this position.
Open interest for August 21 $220 puts rose to around 15,400, making this the biggest strike by a long shot. The contracts traded at $4.19, meaning some are betting on QQQ trading around $215 by the expiration date.

(Investing.com - October 16)
Technical Damage
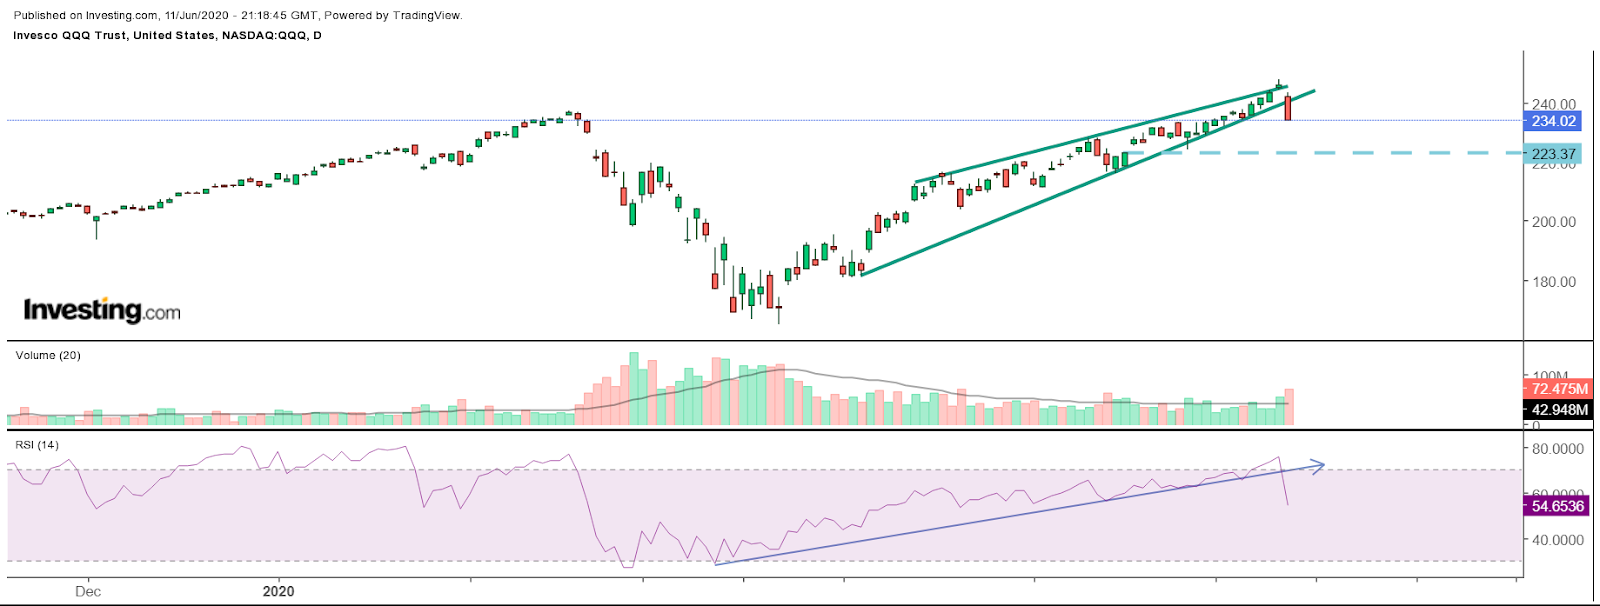
What may be even worse, is there has been a severe amount of technical damage done to the equity market from the steep and unexpected sell-off on June 11. QQQ had been flashing a warning sign for the last several trading sessions before the sell-off. The relative strength index rose sharply above 70, indicating the ETF was overbought and likely to see a reversal. When the RSI rises above 70, it is overbought, and when it falls below 30, it is considered to be oversold.

Additionally, there was a bearish reversal pattern that formed in the ETF, called a rising wedge pattern. The ETF fell below the lower trend line of that pattern on June 11, and that would suggest that the ETF has broken down and is likely to continue to head lower. The next level of support may not come until the ETF drops to $223, a decline of an additional 4.7% from its closing price on June 11.
Taking A Breather
The markets overall have run higher in a very short time, and that means they are vulnerable to a rather significant pullback, or at the very least sideways consolidation. It seems only natural to some degree to see that type of price action over the short-to-medium term, as investors continue to weigh the potential impact of the coronavirus and how the economic recovery will end up taking shape.
Until such a time, that the outlook for the economy and corporate earnings become more apparent, it seems that we may continue to live in a period of considerable volatility. It seems some traders are betting on it.
