With macro and commodity headlines screaming either gold, oil, or dollar every day, longs in PGMs have been making a silent killing, thanks to the relatively low volatility and the scant attention these markets have been getting.
PGMs, or Platinum Group Metals, primarily consist of palladium—the metal that boosts gasoline or petrol-driven engines by purifying their emissions—and platinum, the autocatalyst that performs a similar service for diesel engines.
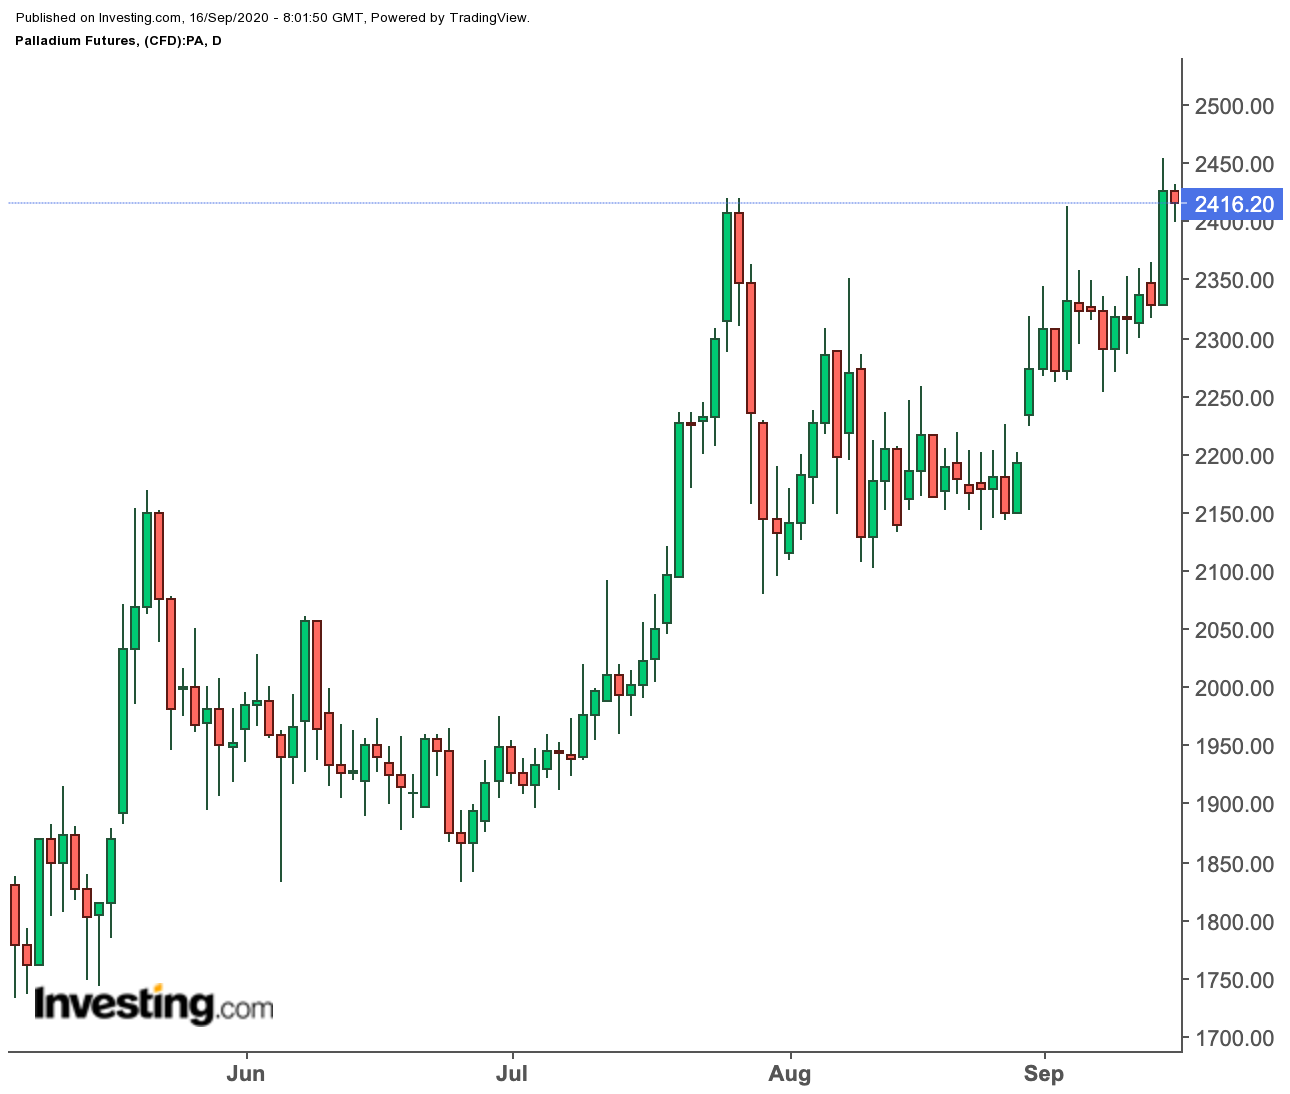
In Tuesday’s session, palladium futures' front-month December contract on New York’s COMEX hit six-month highs of $2,454.50 an ounce. But the headlines were more focused on gold’s brief ascension to a two-week high instead.
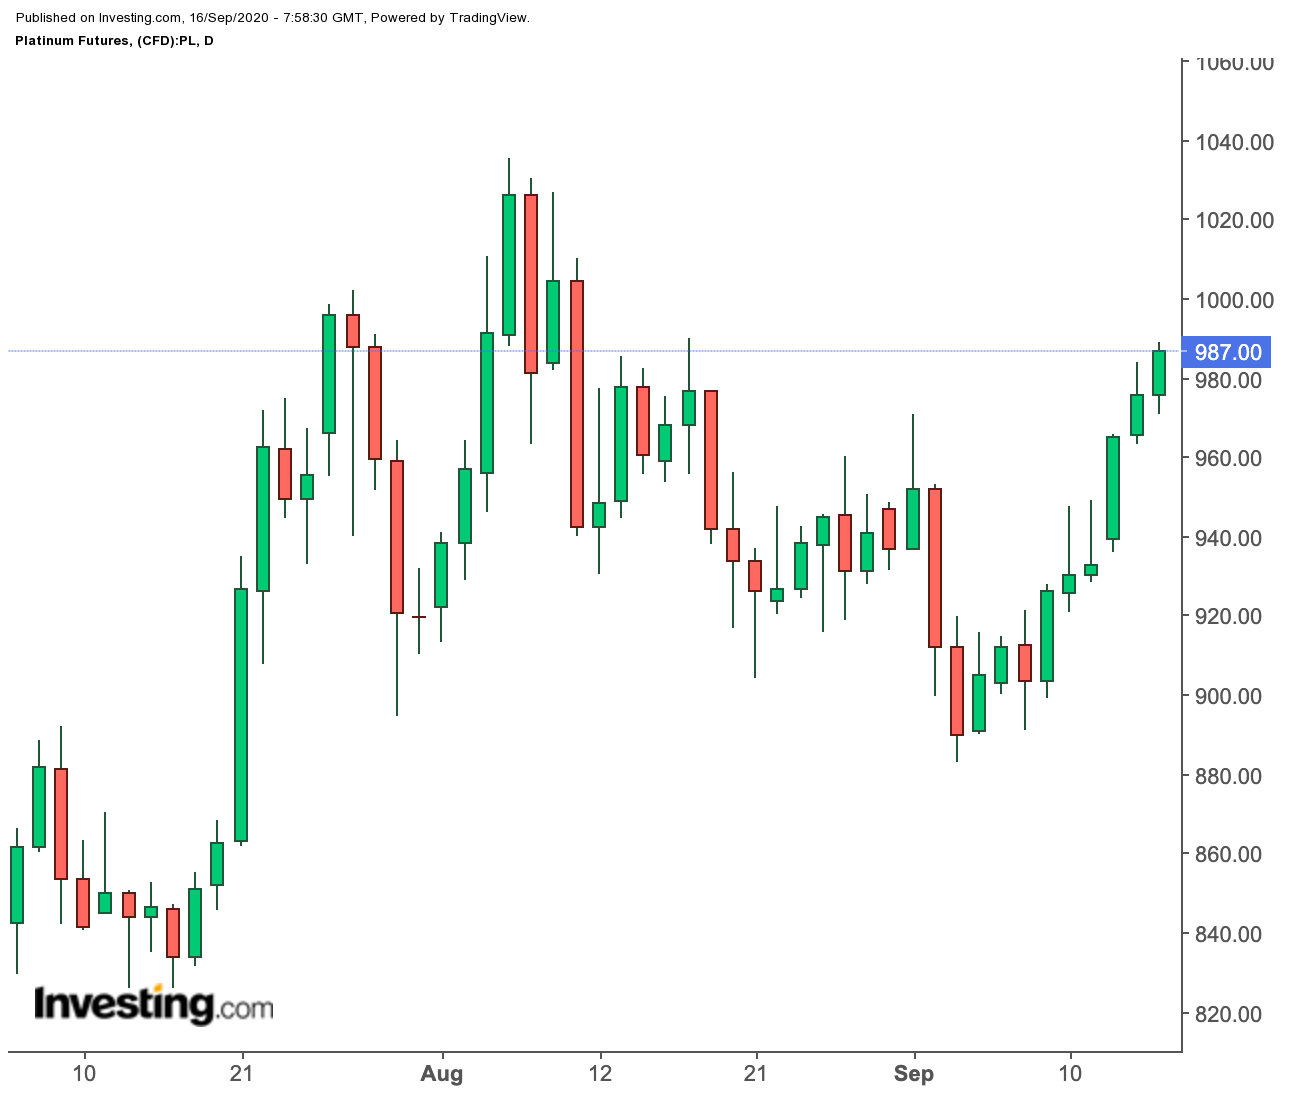
Platinum futures' benchmark October contract, meanwhile, soared to a one-month peak of $984 on Tuesday, also with similar minimal fanfare.
Many Milestone For The Leading PGM Lights
Those aren’t the only milestones of the leading PGM lights.
Palladium is headed for a fifth straight week of gains, even after accounting for Wednesday’s decline in COMEX’s Asian trading.It’s a rally that’s added 12% to the metal since the week ending Aug. 7, when it also fell. It is also up for a third month, rising a cumulative 24%, or an average of 8% a month since the end of June.
Platinum is showing a second straight weekly rise and is now up almost 10% since Aug. 28. On a monthly basis, it also up without a break since the end of June, rising more than 14%, or nearly 5% on average each month.
For the year, palladium is up almost 26% while platinum has gained less than 1% following significant losses between January and March.
So, is it still a good time to get into the two PGMs? Or are their rallies at exhaustion point?
More Upside Still Evident In PGMs
On COMEX, palladium reached a high of $2,788 on Feb. 27 and a low of $1,355 on March 16, leaving its bullish trend intact as long as it stayed above the 61.8% Fibonacci retracement level of $2,240, according to a trading model drawn by precious metals chartist Sunil Kumar Dixit.
Under Dixit’s model, if palladium surpasses those levels, the next area to watch would be the 76.4% Fibonacci retracement of $2,450.
On a daily chart price, palladium is well above the 50-Day Exponential Moving Average of $2,203 and the 100-Day Simple Moving Average, with the likelihood to cross over into the 200-day SMA.

On a historical basis, the spot price of palladium, which drives the futures on COMEX, hit an even greater record high of $2,882.11 on Feb. 27, just before the coronavirus pandemic began crippling the world economy.
Until then, explosive growth in the world automotive sector led by China, coupled with critically short supply, had fueled new highs in pallaidum almost everyday.
Since 2010, according to analysts, above-ground stocks of palladium have declined by 5.3 million ounces (165 tons), or about 30%. Consultancy Metals Focus is forecasting a palladium defecit of 124,000 ounces (3.9 tons) in 2020. That would be the smallest deficit since the palladium market was last in surplus in 2011, according to the consultancy. In 2016, the deficit was as much as 1.29 million ounces.
In the case of platinum, it surpassed the first bullish target of $980 and a sustained move higher could take it to classic tops of $1,030 and supply zone of between $1,035-$1,045, another Dixit model shows.
Further bullish momentum can help platinum usher in a higher resistance cluster at the $1,080, $1,110, $1170 and $1,200 handles.
On a daily basis, platinum’s chart shows a continuation of the bullish trend, putting it above the 50-Day Exponential Moving Average of $926. 
Platinum has also maintained its 100-Day Simple Moving Average, with a bullish crossover above its 200-Day SMA. Only a correction with a decisive break below those SMA levels may stall its upside momentum.
On the demand side, platinum is forecast to see robust demand from industry and the jewelry market, with the latter coming from millennials in traditional gold-centric economies, like India, where platinum jewelry sales jumped 25% in 2017.
Nitesh Shah, director of research at WisdomTree, said in a report by Bloomberg:
“The buying spree was driven by investors who thought they were missing out on the recent rally in gold and silver. There’s also probably been some money taken as a profit from gold and silver and added into platinum because it’s still relatively cheap compared with its peers.”
Bloomberg also reports that more than 600,000 ounces of platinum have been added to exchange-traded funds, or ETFs, since mid-May.
