⭐ Start off 2025 with a powerful boost to your portfolio: January’s freshest AI-picked stocksUnlock stocks

Perfect Price Action On The CAD/USD Chart

Published 2016-03-07, 05:03 a/m
CAD/USD
-

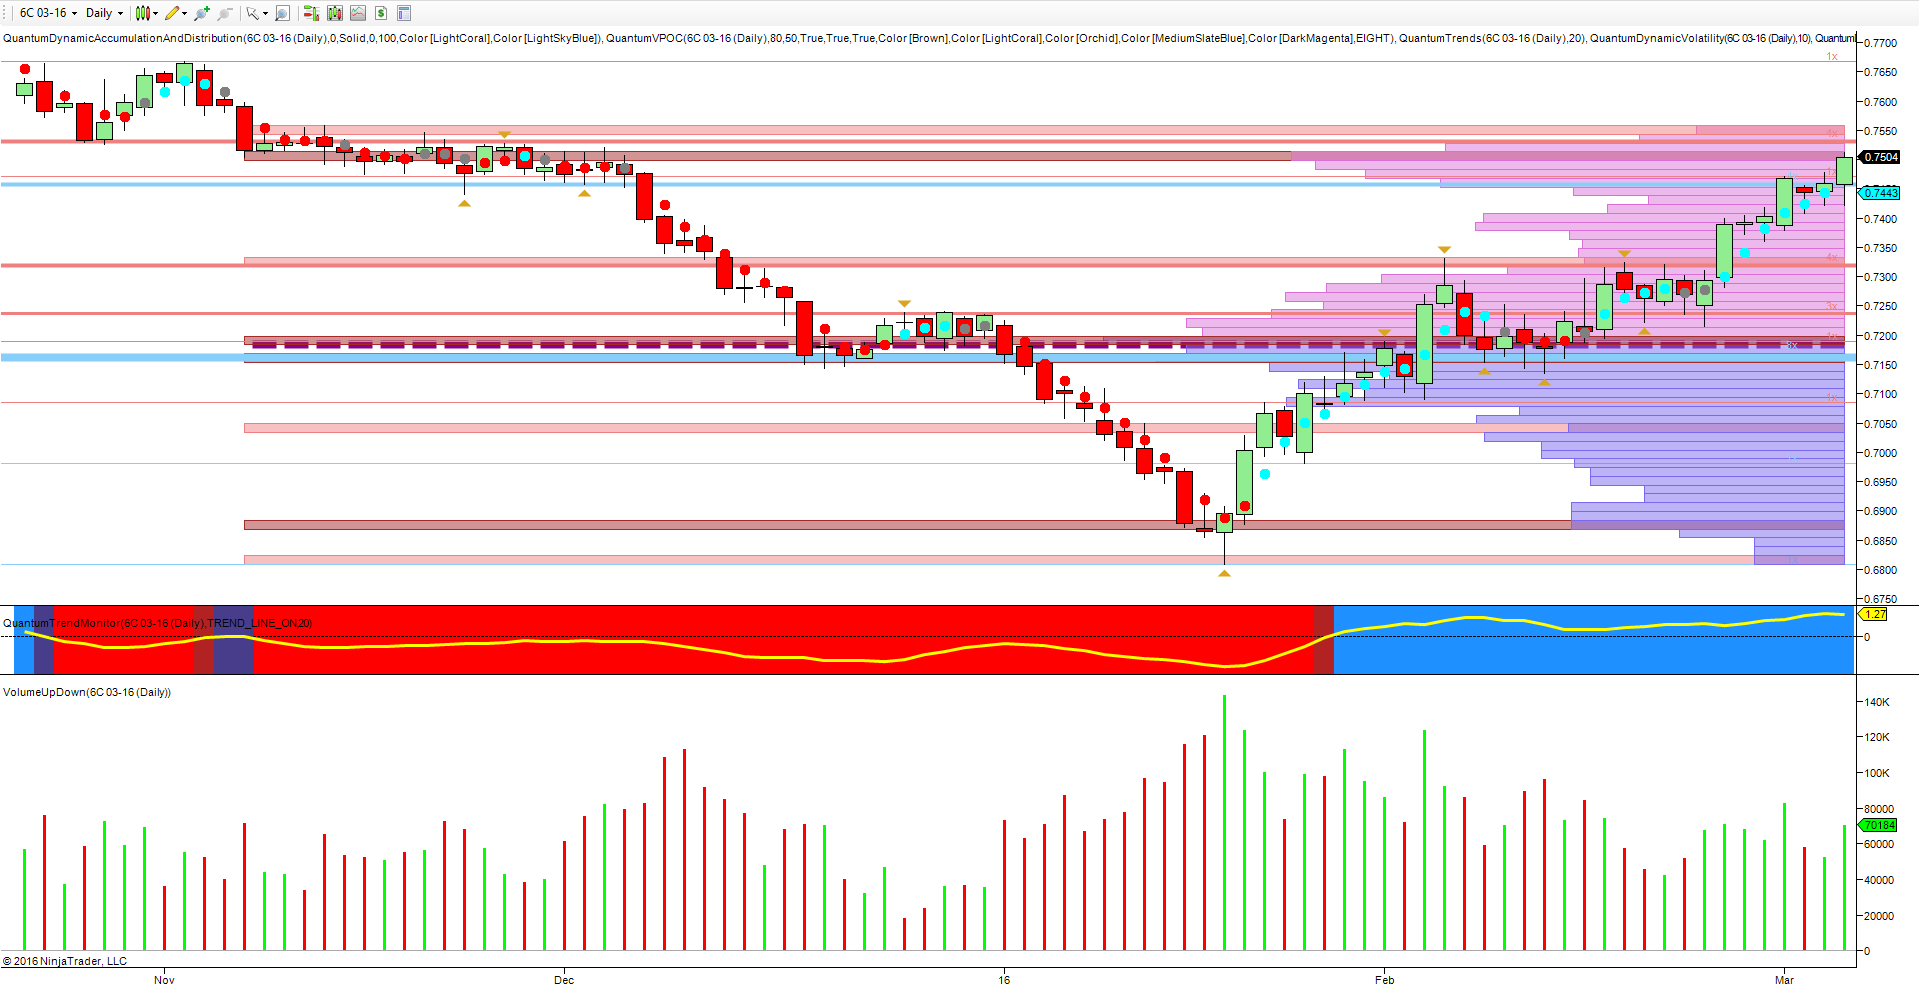
CAD/USD Daily Chart

The daily chart of the CAD/USD is one of those examples where the description of technical analysis being an art and not a science, neatly sums up the price action of the last three months with perfect symmetry around the low January 2016. December’s bearish trend with its pause point in the 0.7200 region, followed by the second leg lower to touch a low of 0.6809 in mid January, has since been perfectly mirrored with a consequent rise, back to the congestion region at 0.7200 and a subsequent rally to regain the level of the initial move lower. Perfect symmetry coupled with sustained buying on the 20th January. This type of price action is unusual in the extreme. It is rare to find a rally of this extent from a single candle, simply because the general pattern is for the price action to consolidate first, and then to rally once the selling pressure has been absorbed.

So a wonderful example of art in action on the daily chart, and the question now is whether the picture will be completed with an extended congestion phase at this level and mirroring that to the left of the chart. This now seems likely given we are approaching a high volume node on the volume point of control, and if so art will be repeated.

Latest comments

Loading next article…
Risk Disclosure: Trading in financial instruments and/or cryptocurrencies involves high risks including the risk of losing some, or all, of your investment amount, and may not be suitable for all investors. Prices of cryptocurrencies are extremely volatile and may be affected by external factors such as financial, regulatory or political events. Trading on margin increases the financial risks.
Before deciding to trade in financial instrument or cryptocurrencies you should be fully informed of the risks and costs associated with trading the financial markets, carefully consider your investment objectives, level of experience, and risk appetite, and seek professional advice where needed.
Fusion Media would like to remind you that the data contained in this website is not necessarily real-time nor accurate. The data and prices on the website are not necessarily provided by any market or exchange, but may be provided by market makers, and so prices may not be accurate and may differ from the actual price at any given market, meaning prices are indicative and not appropriate for trading purposes. Fusion Media and any provider of the data contained in this website will not accept liability for any loss or damage as a result of your trading, or your reliance on the information contained within this website.
It is prohibited to use, store, reproduce, display, modify, transmit or distribute the data contained in this website without the explicit prior written permission of Fusion Media and/or the data provider. All intellectual property rights are reserved by the providers and/or the exchange providing the data contained in this website.
Fusion Media may be compensated by the advertisers that appear on the website, based on your interaction with the advertisements or advertisers.
© 2007-2025 - Fusion Media Limited. All Rights Reserved.