Among retail investors and advisors alike, the quest to outperform market-cap-weighted indexes often leads to exploring various factor investing strategies. In particular, "quality" has emerged as a particularly appealing approach.
On the surface, focusing on companies with robust fundamentals and solid business models seems like a straightforward path to success. It's a strategy that resonates with investors who believe in the long-term value of strong corporate health.
However, as with many investment strategies, the devil is in the details. Execution is key. Recently, quality-focused ETFs have seen a surge in popularity. A quick glance at the ETF Central Screener reveals an array of about 50 such ETFs currently available.
This diversity brings both opportunity and complexity, as navigating through this growing field to identify the top performers can be a difficult task. With an assortment of options, each ETF comes with its unique take on what 'quality' means, leading to varied outcomes.
As always, the challenge lies in making informed choices. Distinguishing the winners from the losers beforehand isn't always straightforward. Here's all you need to know about investing in quality and how to assess if a quality ETF is worth it or not.
The Varying Definitions of Quality
The first approach is based on the Fama-French "Profitability" Factor, measured by the excess returns of companies with robust profitability versus those with weak profitability (Robust minus Weak, or RmW).
A CFA Institute whitepaper titled "Fama and French: The Five-Factor Model Revisited," authored by Derek Horstmeyer, Ying Liu, and Amber Wilkins, provides an insightful analysis of this approach.
The paper notes that "RMW is the single factor that has consistently delivered excess returns. Overall economic cycles since 1963, going long high-quality stocks, or profitable firms, and shorting their low-quality, unprofitable counterparts has been a great investment strategy. And the power of the factor has not diminished."
Contrastingly, MSCI, a leading provider of indexes including numerous factor-based ones, adopts a different approach to measuring quality.
MSCI's methodology for defining quality combines Z-Scores of three winsorized fundamental variables: return on equity, debt-to-equity ratio, and earnings variability.
Z-scores standardize these variables, allowing for comparison across different companies, while winsorizing them limits the influence of extreme values.
Return on equity measures a company’s efficiency in generating profits from shareholders' equity, while debt to equity assesses financial leverage and risk, and earnings variability evaluates the stability of a company's earnings over time.
Picking the Best Quality ETFs
So, investors have two competing methodologies to choose from – Fama-French versus MSCI. The problem is that quality ETFs don't always make it clear which ones they are drawing from.
Some ETFs like the iShares MSCI USA Quality Factor ETF (QUAL) or the Dimensional US High Profitability ETF (DUHP) make it quite clear with their name. In this case, QUAL relies on the MSCI methodology, whereas DUHP draws from Fama-French.
The task gets even trickier with quality ETFs that track proprietary indexes. With this approach, the ETF manager is free to implement their own research that may differ or contrast with the Fama-French and MSCI approaches.
For example, consider the JPMorgan (NYSE:JPM) U.S. Quality Factor ETF (JQUA). This rules-based ETF tracks the JPMorgan US Quality Factor Index, which is sponsored by JPMorgan and features "proprietary factors" according to JQUA's prospectus.
JQUA selects its stocks from the Russell 1000 index by screening for profitability, quality of earnings, and solvency – and as much detail as investors will be able to glean from its prospectus.
That being said, JQUA has performed quite well, returning 11.46% annualized over the trailing five years and beating the majority of its category peers on a risk-adjusted basis.
A Hybrid Approach to Quality
Another thing investors should realize when it comes to quality investing is that this factor does not have to be targeted in isolation. That is, investors can potentially combine quality with other factors for potentially enhanced long-term expected returns.
Consider, for instance, the WisdomTree U.S. Quality Dividend Growth Fund (DGRW). This unique ETF screens for quality based on three-year historical return on equity and return on asset ratios, while also checking for long-term earnings growth expectations.
By selecting its base constituents from the WisdomTree U.S. Dividend Index, the ETF also ensures a focus on large-cap dividends, another trait quality companies tend to have. Capping this off is a fundamental indexing methodology that weights companies based on their projected dividends as opposed to market capitalization.
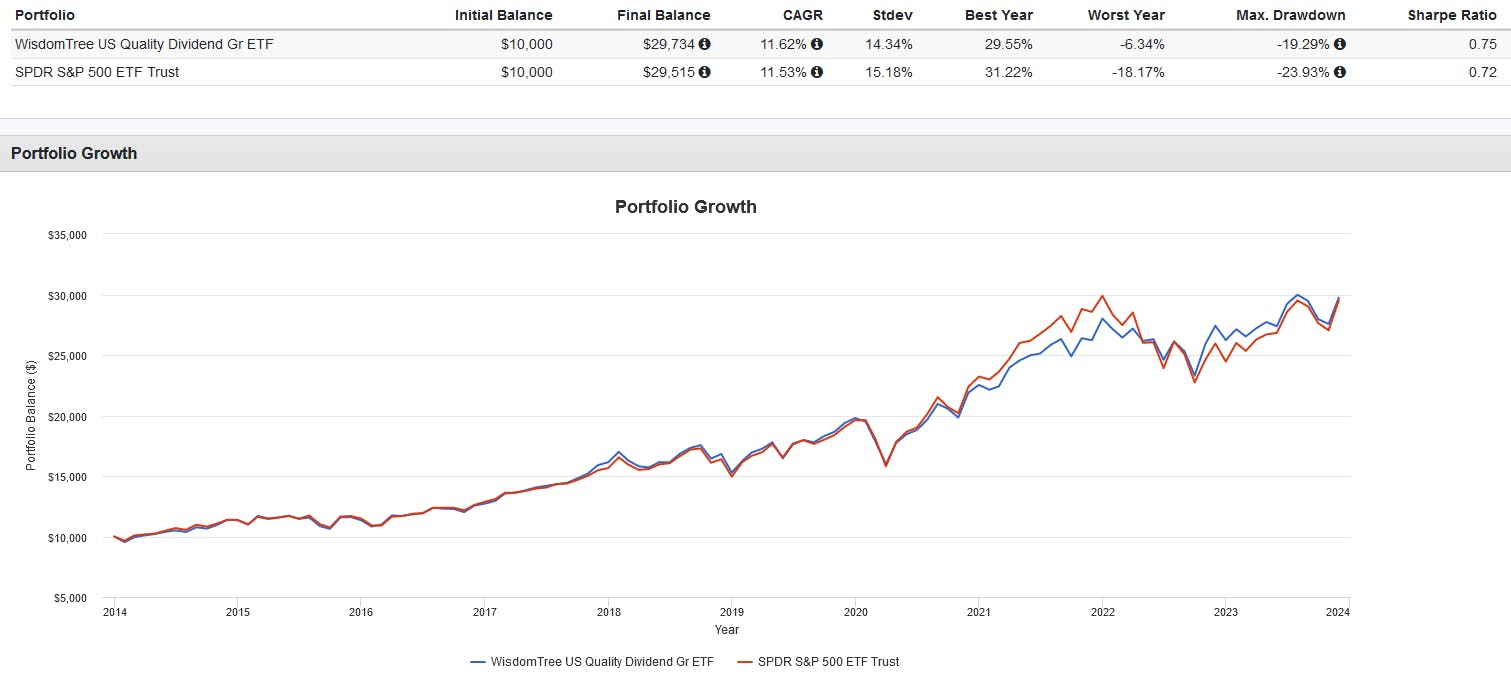
So far, this approach has worked out quite well for DGRW. Despite facing headwinds from a higher 0.28% expense ratio, the ETF has managed to beat the SPDR S&P 500 ETF (SPY (NYSE:SPY)) from January 2014 to the present, with a slightly better total and risk-adjusted return.

This content was originally published by our partners at ETF Central.
