Alberta eyes investment in Japan’s refining to boost oil exports - Reuters
In this Render Token (RNDR) price prediction 2023, 2024-2030, we will analyze the price patterns of RNDR by using accurate trader-friendly technical analysis indicators and predict the future movement of the cryptocurrency.
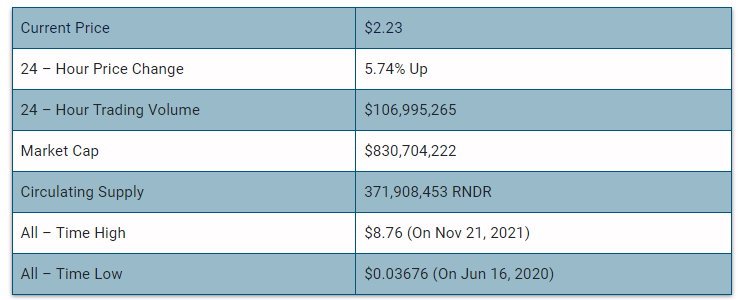
Render Token (RNDR) Current Market Status
What is Render Token (RNDR)

Render Token (RNDR) is an Ethereum token that powers Render Network, a protocol that enables distributed graphics processing. Render token (RNDR) will make the process of rendering and streaming intricate virtual works easier for all users. It will allow complex GPU-based render jobs to be distributed and processed on a peer-to-peer network, making the transactional process of rendering and streaming 3D environments, models, and objects much simpler for end-users.
Render Token 24H Technicals
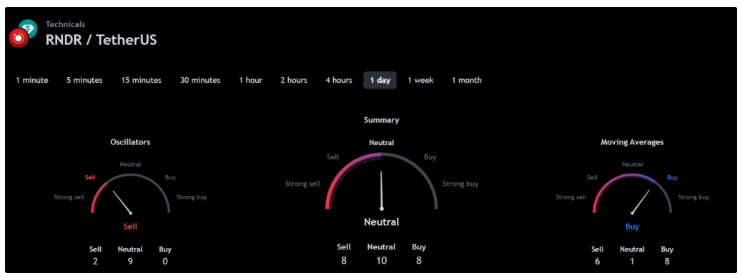
(Source: TradingView)
Render Token (RNDR) Price Prediction 2023
Render Token (RNDR) ranks 55th on CoinMarketCap in terms of its market capitalization. The overview of the Render Token price prediction for 2023 is explained below with a daily time frame.
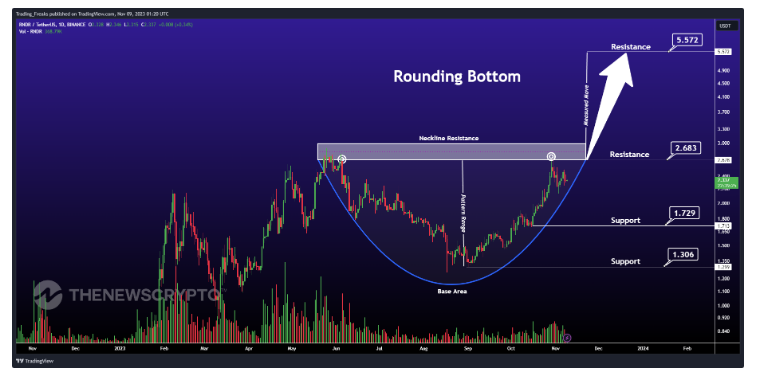
RNDR/USDT Rounding Bottom Pattern (Source: TradingView)
In the above chart, Render Token (RNDR) laid out a rounding bottom pattern. The price movements form a pattern that resembles a bow and hence is also known as the saucer bottom pattern. In general, the rounding bottom pattern indicates a long-term price reversal. This pattern also emphasizes the changes in the market sentiment as the trend seems to shift from bearish to bullish. Investors generally have to stay cautious and time the market well. If the price breaks and moves past the resistance level, it will enter a confirmed bullish trajectory.
At the time of analysis, the price of Render Token (RNDR) was recorded at $2.23. If the pattern trend continues, then the price of RNDR might reach the resistance levels of $2.683, and $5.572. If the trend reverses, then the price of RNDR may fall to the support of $1.729, and $1.306.
Render Token (RNDR) Resistance and Support Levels
The chart given below elucidates the possible resistance and support levels of Render Token (RNDR) in 2023.
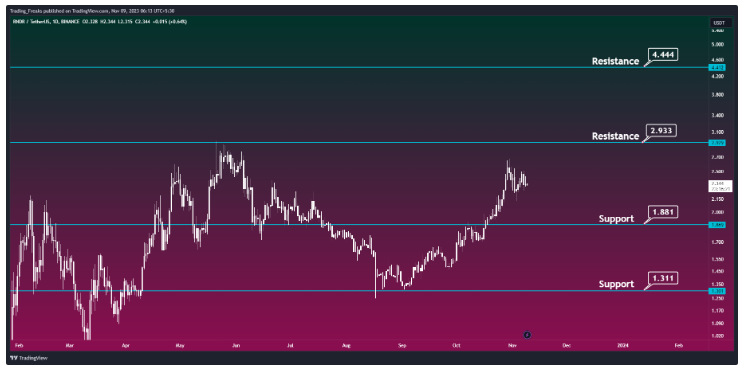
RNDR/USDT Resistance and Support Levels (Source: TradingView)
From the above chart, we can analyze and identify the following as resistance and support levels of Render Token (RNDR) for 2023.

RNDR Resistance & Support Levels
Render Token (RNDR) Price Prediction 2023 — RVOL, MA, and RSI
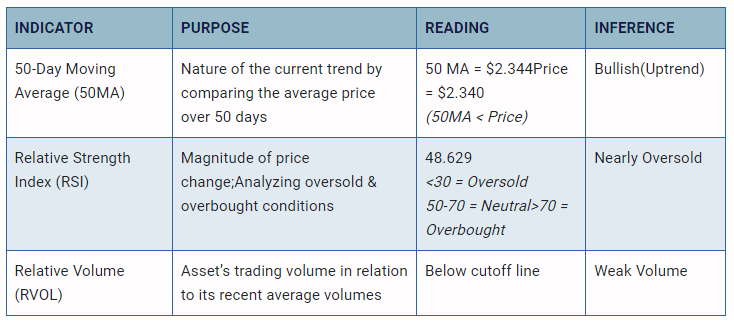
The technical analysis indicators such as Relative Volume (RVOL), Moving Average (MA), and Relative Strength Index (RSI) of Render Token (RNDR) are shown in the chart below.
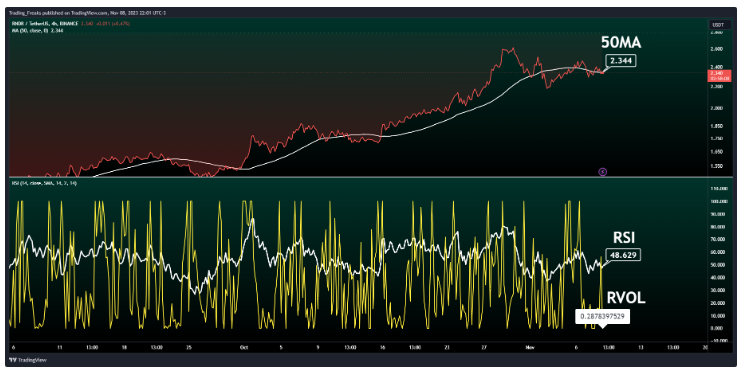
RNDR/USDT RVOL, MA, RSI (Source: TradingView)
From the readings on the chart above, we can make the following inferences regarding the current Render Token (RNDR) market in 2023.
Render Token (RNDR) Price Prediction 2023 — ADX, RVI
In the below chart, we analyze the strength and volatility of Render Token (RNDR) using the following technical analysis indicators — Average Directional Index (ADX) and Relative Volatility Index (RVI).
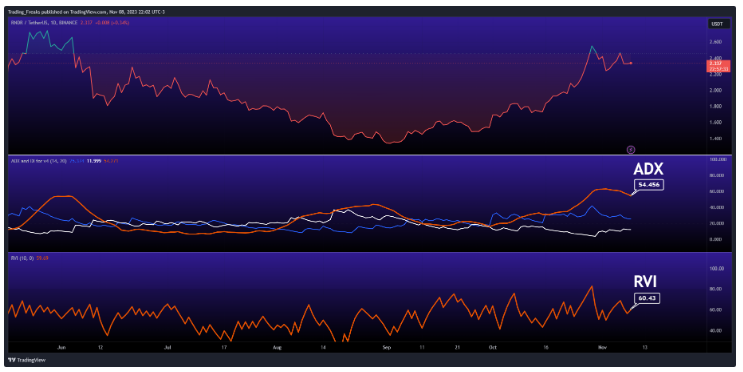
RNDR/USDT ADX, RVI (Source: TradingView)
From the readings on the chart above, we can make the following inferences regarding the price momentum of Render Token (RNDR).

Comparison of RNDR with BTC, ETH
Let us now compare the price movements of Render Token (RNDR) with that of Bitcoin (BTC), and Ethereum (ETH).
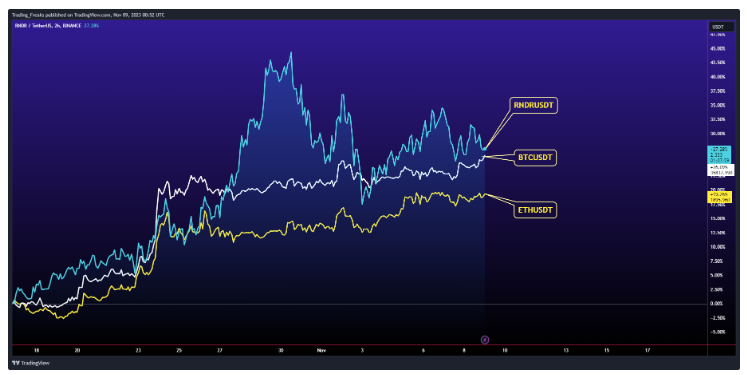
BTC Vs ETH Vs RNDR Price Comparison (Source: TradingView)
From the above chart, we can interpret that the price action of RNDR is similar to that of BTC and ETH. That is, when the price of BTC and ETH increases or decreases, the price of RNDR also increases or decreases respectively.
Render Token (RNDR) Price Prediction 2024, 2025 – 2030
With the help of the aforementioned technical analysis indicators and trend patterns, let us predict the price of Render Token (RNDR) between 2024, 2025, 2026, 2027, 2028, 2029 and 2030.
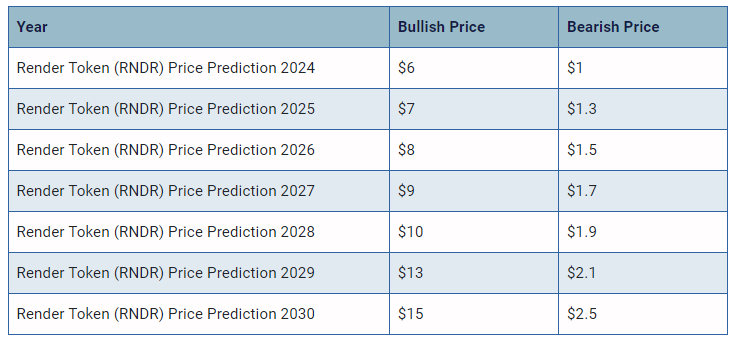
Conclusion
If Render Token (RNDR) establishes itself as a good investment in 2023, this year would be favorable to the cryptocurrency. In conclusion, the bullish Render Token (RNDR) price prediction for 2023 is $4.444. Comparatively, if unfavorable sentiment is triggered, the bearish Render Token (RNDR) price prediction for 2023 is $1.311.
If the market momentum and investors’ sentiment positively elevate, then Render Token (RNDR) might hit $5. Furthermore, with future upgrades and advancements in the Render Token ecosystem, RNDR might surpass its current all-time high (ATH) of $8.76 and mark its new ATH.
This content was originally published by our partners at The News Crypto.
Which stocks should you consider in your very next trade?
Successful investors know to check multiple angles before making their move. InvestingPro's three powerful features work together to give you that edge:
ProPicks AI runs 80+ stock-picking strategies, including Tech Titans, which doubled the S&P 500's performance in just 18 months!
Fair Value combines 17 proven valuation models to help you spot overpriced stocks and undervalued gems.
And WarrenAI delivers instant insights on any stock. Ask questions, get vetted answers backed by real-time data (unlike ChatGPT).
Our subscribers use all three to identify stocks before double-digit gains and avoid costly mistakes.
But with 50% during our Summer Sale, even if you only use one of these features the value pays for itself. Sale ends soon—don't wait until prices go back up.
