- Inflation continues to head lower, but not at the desired pace.
- And, as market volatility rises, investors should try and readjust their portfolios.
- The 60/40 portfolio is a great way to do that as it has historically proven effective.
Despite some degree of stagnation, the trend in inflation continues to be bearish, with each Consumer Price Index (CPI) reading being lower than the previous one since peaking at 9%.
While the rate of change in inflation is slowing down, it is not decreasing at the desired rate, as it remains somewhat sticky.
Here are the annualized readings (U.S. CPI) for the past year:

However, the issue with inflation lies in the rate of change since the beginning of the pandemic, which has been significant. This is partly due to the influence of the labor market, rising wages, and rapid economic recovery.
The data presented in the graph illustrates that the post-pandemic employment recovery among individuals aged 25-54 has been faster than in any previous recession.
This is considered to be a rare occurrence. One of the most notable findings from the data is that low-income workers are experiencing the fastest wage growth.

While it is positive that inflation is trending downward. But at 5%, it still remains high. Hence, it's unsurprising that many investors are looking to hedge against inflation.
Last year, commodities served as a hedge against inflation. In addition to their hedging capability, they also functioned as a diversifier.
This is especially valuable when stocks and bonds are less attractive options. Here are the returns of these 3 asset classes in 2022:
How Do You Reduce Your Portfolio’s Volatility?
The simple answer would be to diversify by studying various sub-funds and sectors within the equity market and identifying diversification opportunities.
Bonds are usually considered the most preferred asset for balancing out a portfolio. Still, this approach may not always be effective, particularly when interest rates rise steeply, as in 2022.
In such scenarios, it may be worthwhile to consider reducing exposure to equities and exploring commodities.
If we move out of equities too much, it will reduce volatility. But that also reduces long-term returns too much, and then the game is not worth the candle.

Looking at the chart, we can see that over the last 70 years, the S&P 500 has delivered positive returns 81% of the time. Additionally, if we consider investment horizons of 20 years or more, it has delivered positive returns 100% of the time.
It's important to note that beating the market or outperforming one's benchmarks is not as simple as selecting an asset and hoping for 200% returns in a year. Just think why the vast majority of hedge funds fail.
Based on the data presented earlier, it's clear that the longer the investment horizon, the more likely it is that benchmarks will outperform hedge funds.
As individual investors, our primary mantra should be diversification. This strategy may lead to lower performance during bullish markets, but it can also lead to higher performance during bearish markets.
By diversifying our investments across various asset classes and sectors, we can reduce our risk exposure and potentially achieve better long-term results.

The 60/40 portfolio strategy, which involves allocating 60% to stocks and 40% to bonds, has had a rough period recently. The chart below reveals that 2022 was an exception.

Previous negative returns, such as those experienced in 2000-2003 and 2008-2009, were primarily caused by stock market crashes. We have to go back to 1981 to find a year similar to 2022, in which stocks and bonds had double-digit losses.
This highlights the importance of having a long-term investment horizon and not relying on short-term fluctuations. The 60/40 portfolio strategy has historically been reliable over a sufficiently long timeline.
One of the advocates of this strategy is the passively managed fund giant, Vanguard.
In their U.S. portfolio, Vanguard used the S&P 500 Index for U.S. equities and the Bloomberg U.S. Aggregate Bond Index for bonds. For the globally diversified 60/40 portfolio, they allocated 36 percent to U.S. equities using the MSCI US Broad Market index, 24 percent to non-U.S. equities using the MSCI World Ex USA, 28 percent to U.S. bonds using the Bloomberg U.S. Aggregate Bond index, and 12 percent to non-U.S. bonds using the Bloomberg Global Aggregate ex-USD index.
Forecasts for the United States 10-Year yield (annualized) increased from 3.83 percent at the end of 2021 to 6.09 percent at the end of 2022. The upward revision comes from the improved performance expected from bonds, and the 60/40 has a good chance of having a positive decade.
Rebalancing should not be underestimated and should be done periodically to adjust the percentages of assets in a portfolio, whether it is a 60/40 or any other type of portfolio.
It is necessary when the percentages become skewed in favor of a particular asset or when the portfolio volatility increases. Currently, according to research conducted by JP Morgan, investors should favor more defensive assets.

Finally, here are two more indicators:
1. According to Goldman Sachs indicators, the market is predicting a recession within the next year, as indicated by the market-implied probability of a recession starting within 1 year (blue line) and the market-implied probability of a recession occurring (blue line).

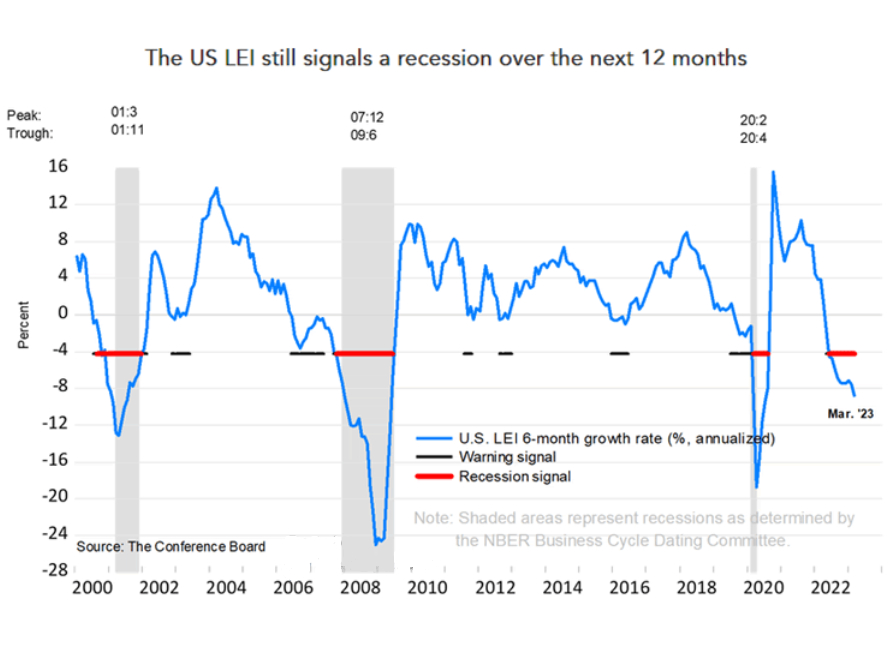
2) The Conference Board Leading Economic Index signals a recession in the next 12 months.

To conclude, investors should never forget:
- Simplicity is everything.
- Long-term returns are the only ones that matter.
- Markets are irrational in the short run.
- Predicting movements in markets is almost impossible.
Disclaimer: This article is written for informational purposes only; it does not constitute a solicitation, offer, advice, or recommendation to invest as such; it is not intended to incentivize the purchase of assets in any way. I would like to remind you that any type of asset is evaluated from multiple points of view and is highly risky therefore, any investment decision and the associated risk remain with the investor.

