The biggest news out on Wednesday was two FOMC members making their case for no hike in June. This language and timing is no accident. After 500bps of 10 consecutive hikes the effective Fed Funds rate is at 5.08%:
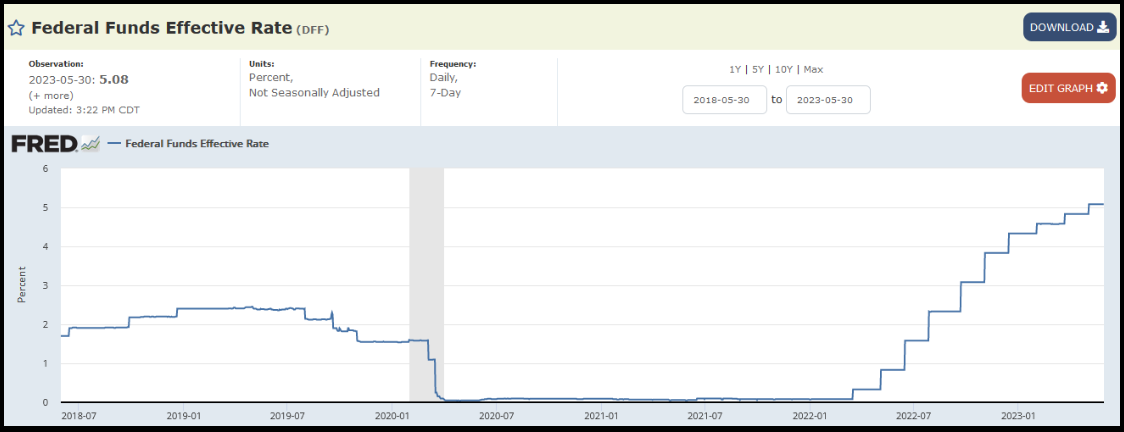
Of note, Core PCE, the Fed’s favored inflation gauge is below 5%. Historically, this is when the Fed stops hiking (FFR above the rate of inflation).
This would give them time to collect more data and determine whether future hikes would be necessary or if they would be able to turn the skip into a pause. On Wednesday evening the “Fed Whisperer” at WSJ – Nick Timiraos – confirmed the stance.
As we have stated since January on our podcast|videocast(s) the key inflation months were going to be May, June and July. This is when inflation would “fall off a cliff” due to base effects of owners equivalent rents (major weighting in CPI) and the twelve month lag on leases. It would not suprise us to see a “3 handle” on the next print. We get the first of these numbers (May) on Tuesday, June 13. The Fed makes its rate decision on Wednesday, June 14.
Even European inflation is starting to cool:
-The euro zone’s annual headline inflation rate fell to 6.1% in May from 7% in April, below the 6.3% predicted in a Reuters poll of economists.
-Core inflation, closely-watched by the European Central Bank, eased to 5.3% from 5.6%.
YoY numbers declining across the board:
-Germany has dropped from 7.2% to 6.1%.
-Spain has dropped from 4.1% to 3.2%.
-France has dropped from 6.9% to 6%.
Fed Governor Jefferson wanted to be explicit that a skip was not a pause, but as the inflation numbers roll over, we believe the June skip will in fact become a pause through the end of the year.Source WSJ
The market responded kindly to the words of Harker and Jefferson’s comments and the odds of a June hike immediately flipped:
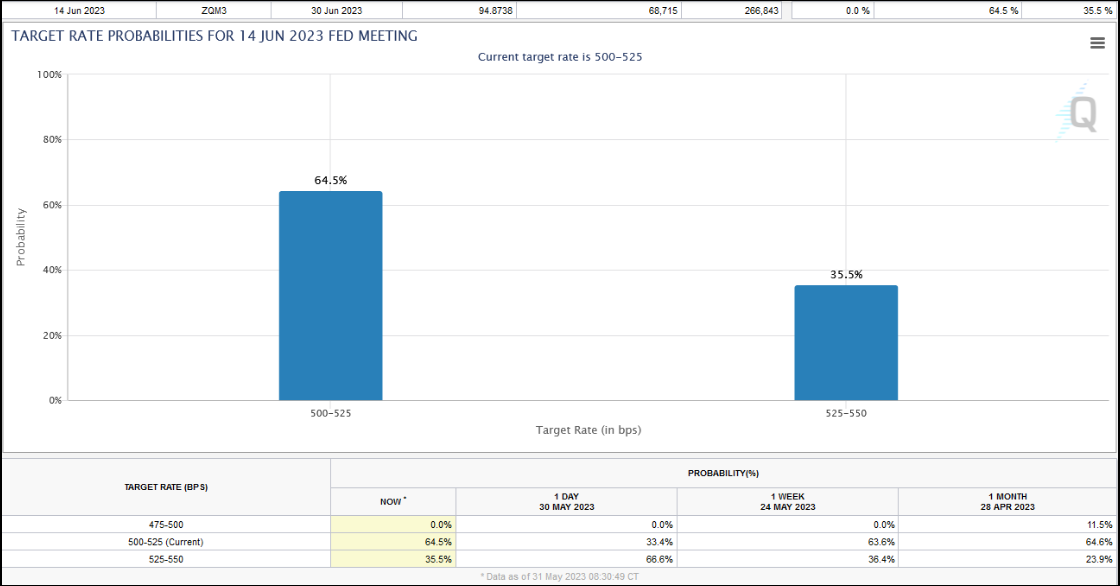
We are at the cusp of a sea change, and the knock on effects will be material. We expect to see two meaningful changes in coming months as a result of the Fed being done:
1) The Dollar will resume its downtrend after a “debt ceiling safe haven bid” in recent weeks.
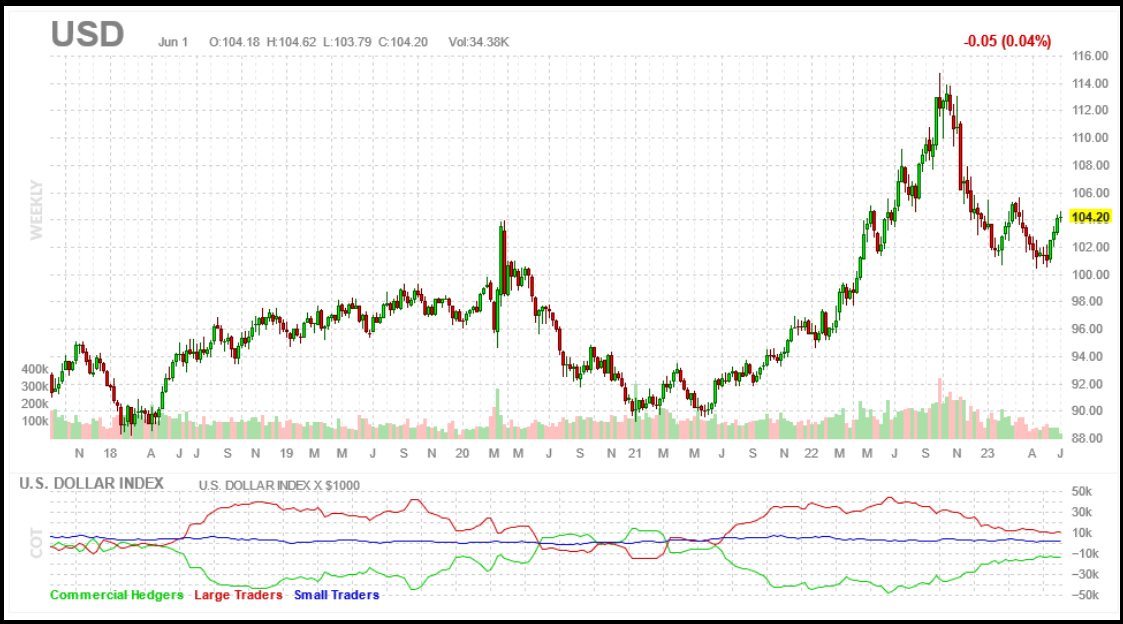
The most directly impacted asset classes from this development will be the groups that have been left behind in the recent rally:
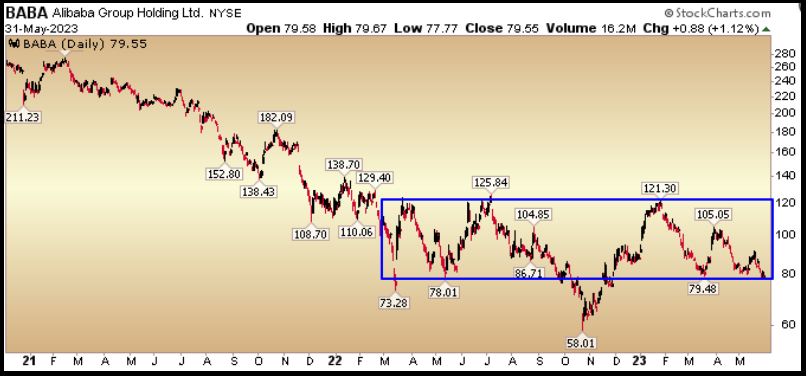
a) Emerging Markets and China will resume the uptrend they began in October. China trades inversely with the USD and is the heaviest weighting in Emerging Markets Indices.
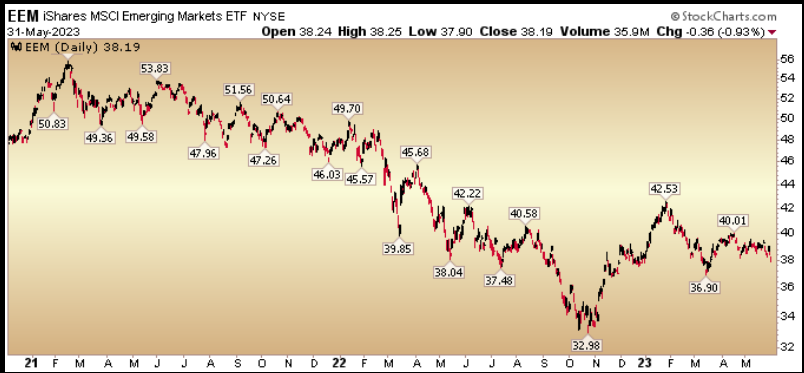
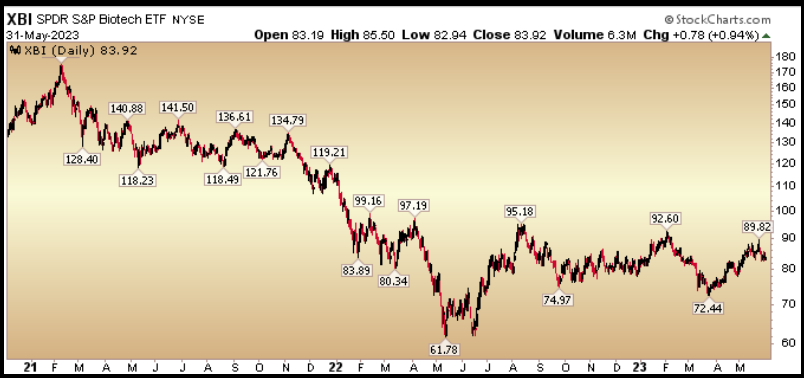
b) Biotech will accelerate its slow recovery from last May’s low as risk comes back into the market.
c) Any multi-national company with revenues abroad will increase earnings materially as the USD weakens. Roughly 40% of S&P 500 revenues are generated outside of the U.S. For example, Intel (NASDAQ:INTC) gets ~82% of their revenues from outside U.S. 3M (NYSE:MMM) gets ~49% of their revenues from outside U.S. PayPal (NASDAQ:PYPL) gets ~47% of their revenues from outside U.S. VF Corp (NYSE:VFC) gets ~45% of their revenues from outside U.S. Stanley Black and Decker (SWK) gets ~45% of their revenues from outside U.S. Baxter International (NYSE:BAX) gets ~45% of their revenues from outside U.S.
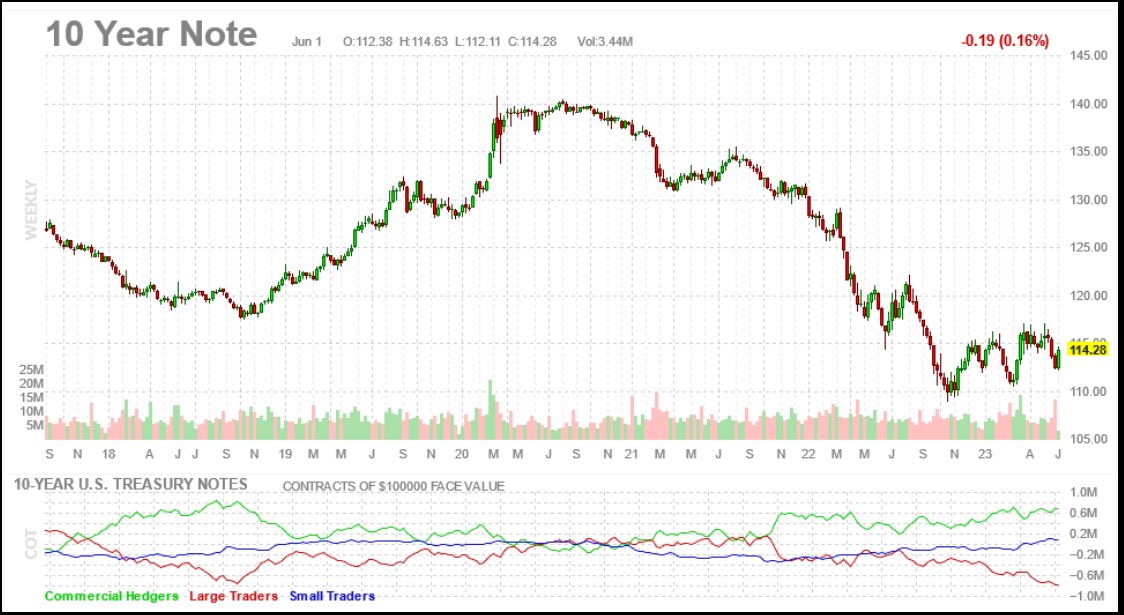
2) Long Term Treasuries will begin to get bid after a few weeks of heavy issuance following the debt deal:
Interest rate sensitive sectors will get bid:
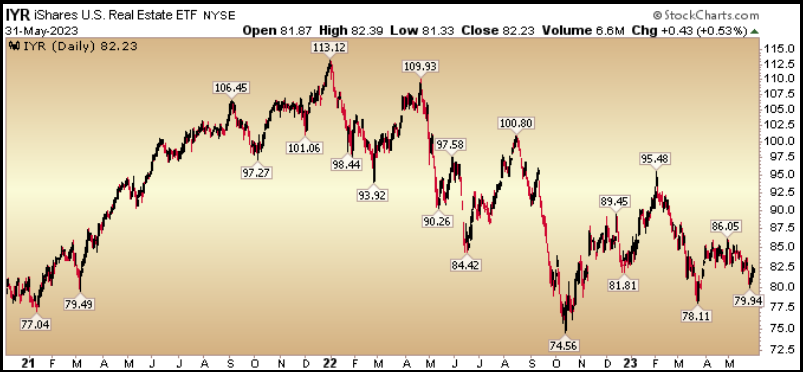
a) REITS have been left for dead. As the long end of the curve gets bid and rates come down, you will see this group begin to recover.
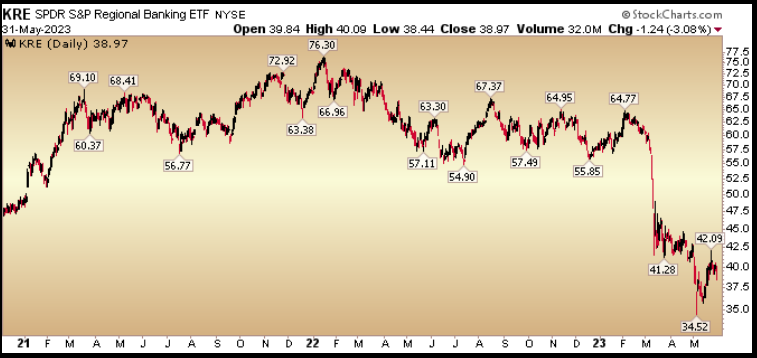
b) BANKS will start to get bid again as their portfolio and loan book “mark-to-market” improves – reducing the need to raise capital. Funding costs will begin to moderate as deposit rates become more competitive to alternatives.
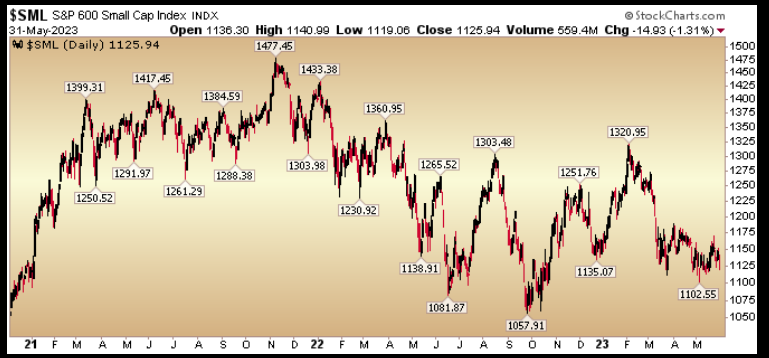
c) Small Caps will get bid as banks begin to recover. They have been a major laggard this year.
Now onto the shorter term view for the General Market:
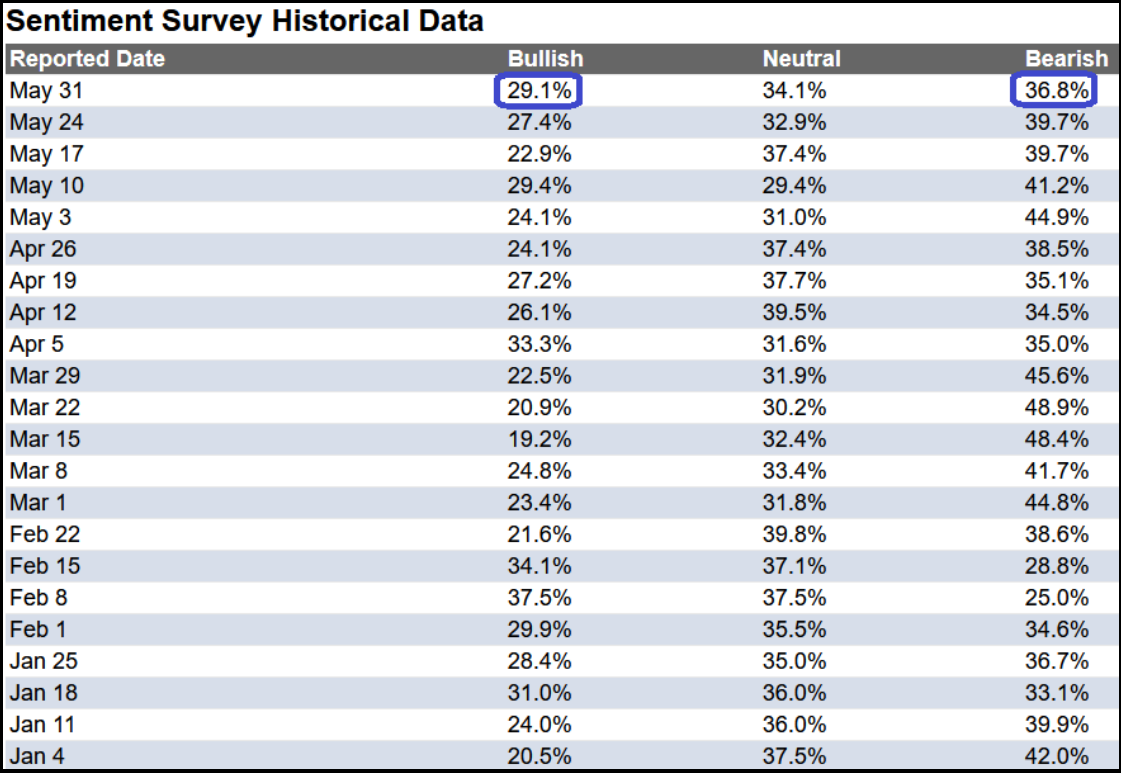
In this week’s AAII Sentiment Survey result, Bullish Percent (Video Explanation) rose to 29.1% from 27.4% the previous week. Bearish Percent declined to 36.8% from 39.7%. The retail investor is still fearful.
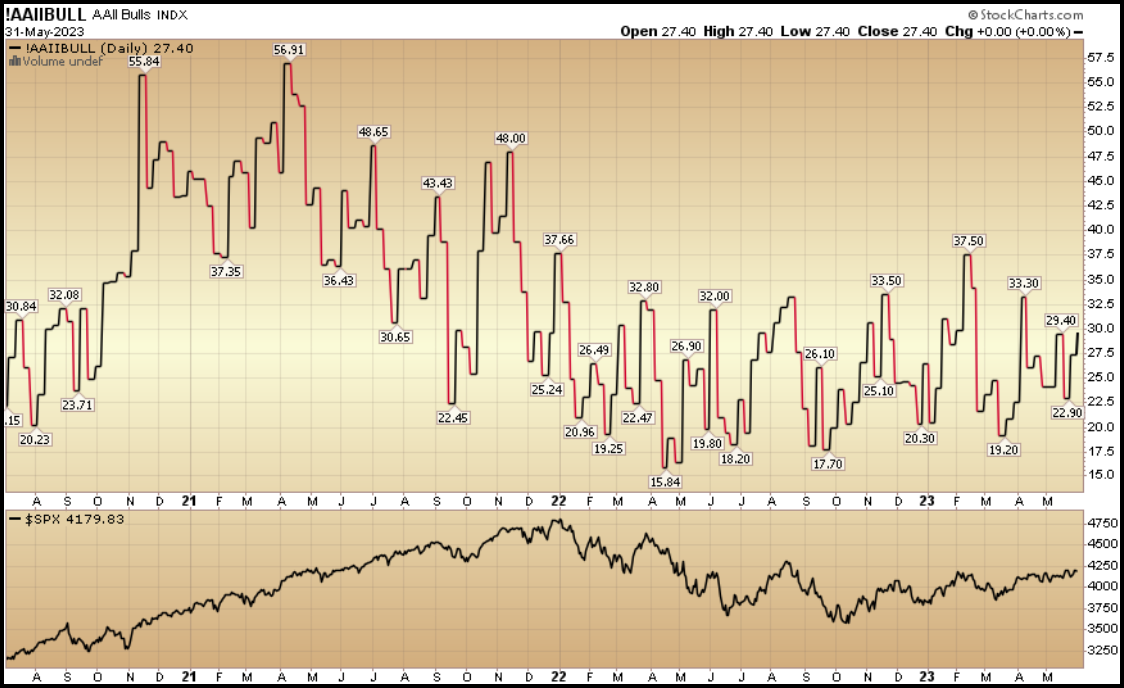
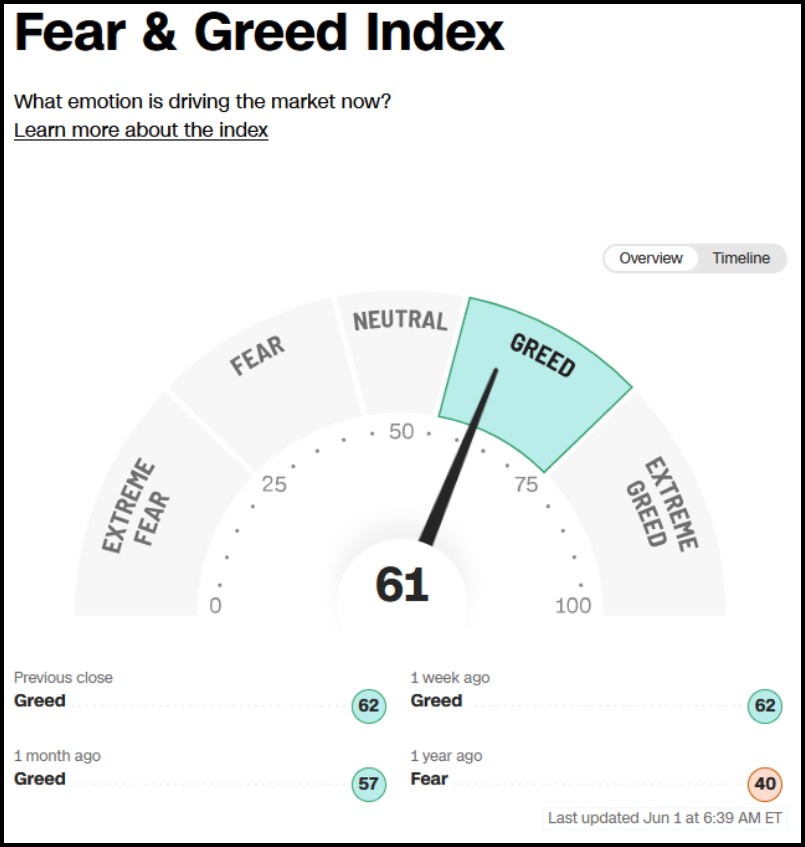
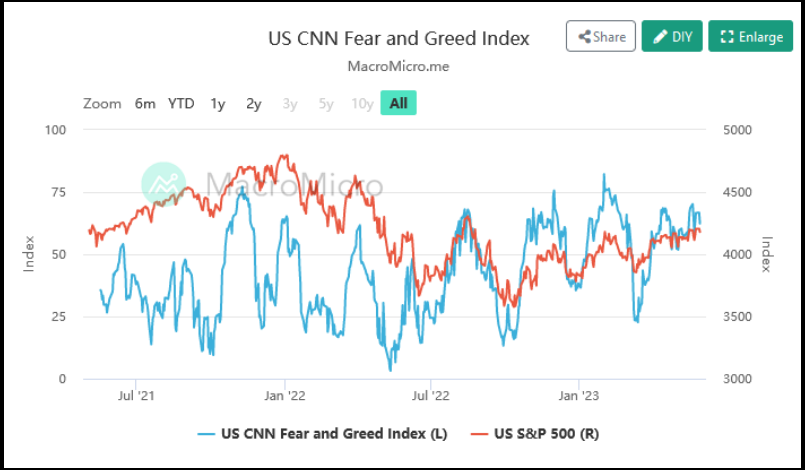
The CNN “Fear and Greed” flat-lined from 61 last week to 61 this week. Sentiment is slowly thawing. You can learn how this indicator is calculated and how it works here: (Video Explanation)
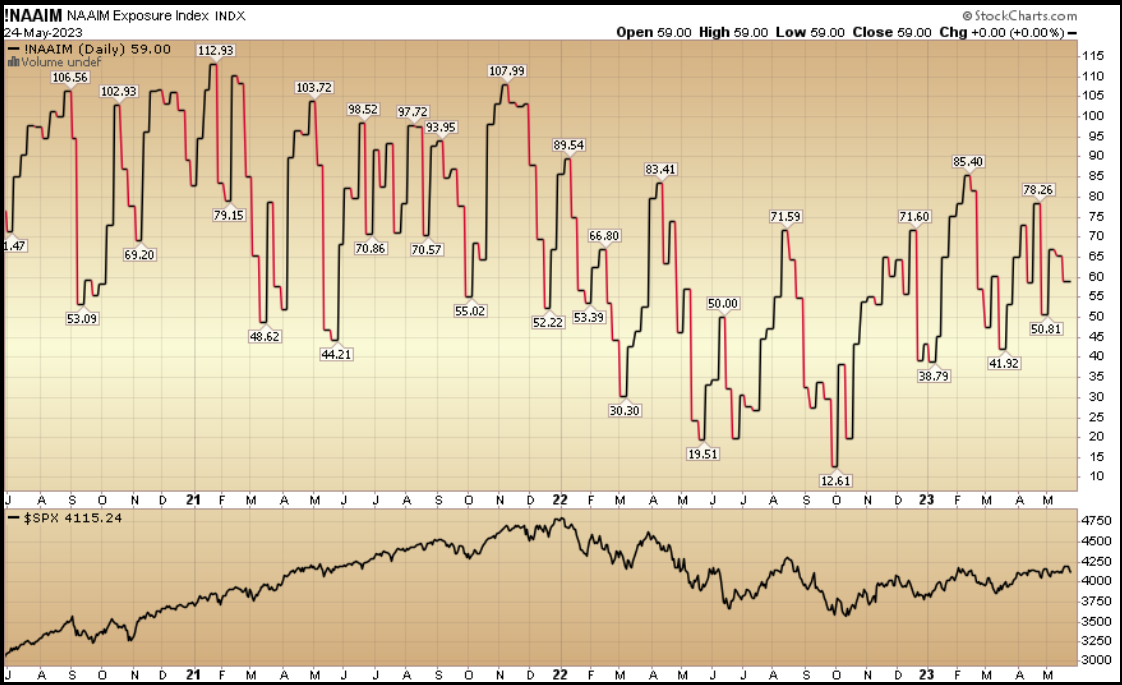
And finally, the NAAIM (National Association of Active Investment Managers Index) (Video Explanation) ticked up to 65.51% this week from 59% equity exposure last week.
This content was originally published on Hedgefundtips.com.
