Get 40% Off
🚀 AI-picked stocks soar in May. PRFT is +55%—in just 16 days! Don’t miss June’s top picks.Unlock full list

“So Far, So Good” Stock Market (and Sentiment Results)…

Published 2023-08-31, 09:42 a/m

“So Far, So Good” Stock Market (and Sentiment Results)…

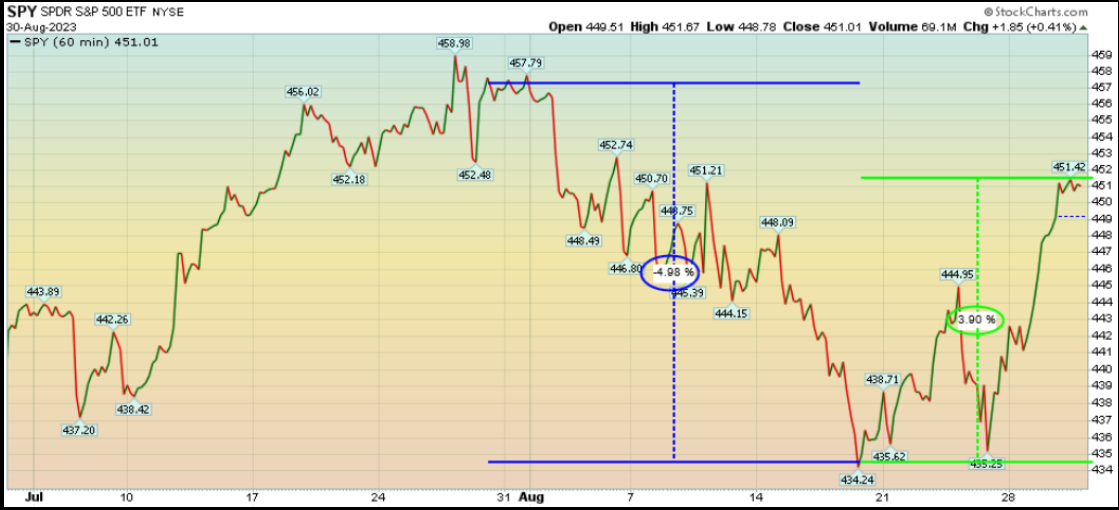
SPDR S&P 500 ETF

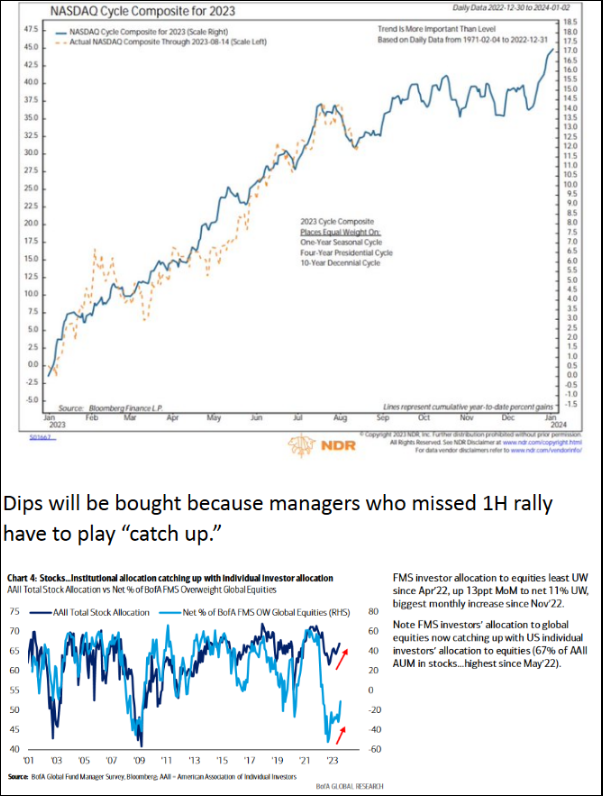
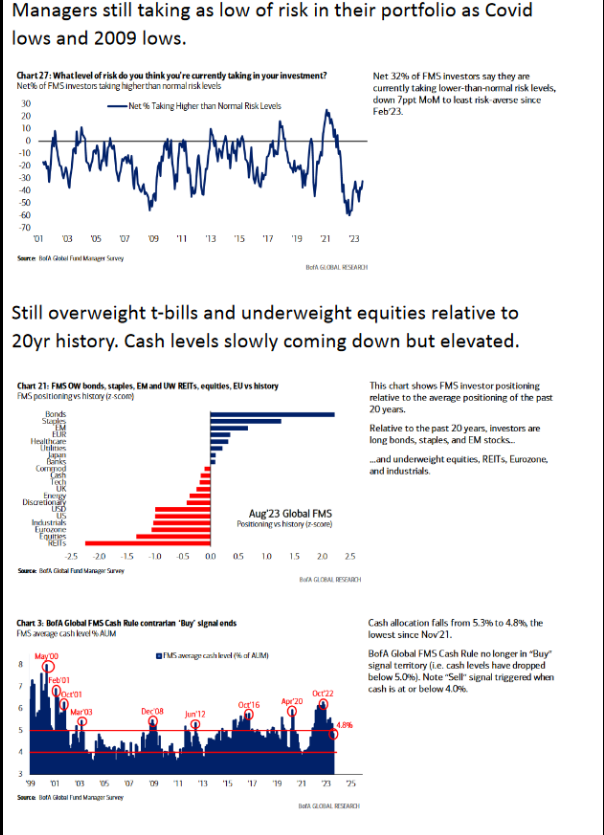
In our July 27, 2023 weekly note and podcast|videocast we talked about a 3-5% pullback in the month of August. We also said we expected these dips would be BOUGHT due to the fact that most managers under-performed in 1H and were still overweight cash/t-bills and underweight equities (relative to their 20 year history):
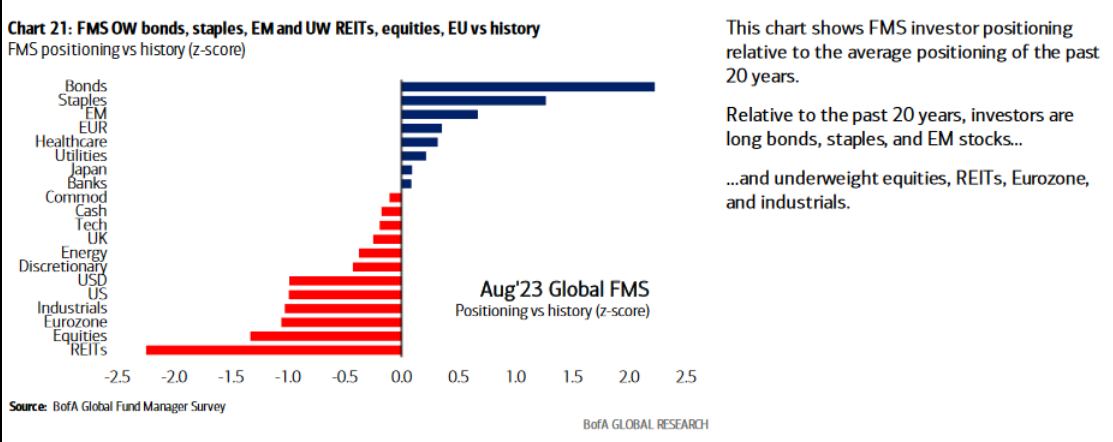
FMS OW bonds, staples, EM and UW REITs, equities, EU vs history

In my media appearances yesterday I talked about what this “catch up” trade would look like and some areas we are finding opportunity to pounce.

First, I joined Nicole Petallides – on The Schwab Network – live from the NYSE. Thanks to Heidi Schultz and Nicole for having me on (and Kenny Polcari for making the connection). Also Thanks to Joshua A. Gallant for being a great host. You can watch it here

Later in the afternoon I joined Seana Smith and Akiko Fujita on Yahoo! Finance. Thanks to Taylor Clothier, Sydnee Fried, Seana and Akiko for having me on. You can find it here

Watch in HD directly on Yahoo! Finance

Here were some of my “show notes” ahead of the segments:
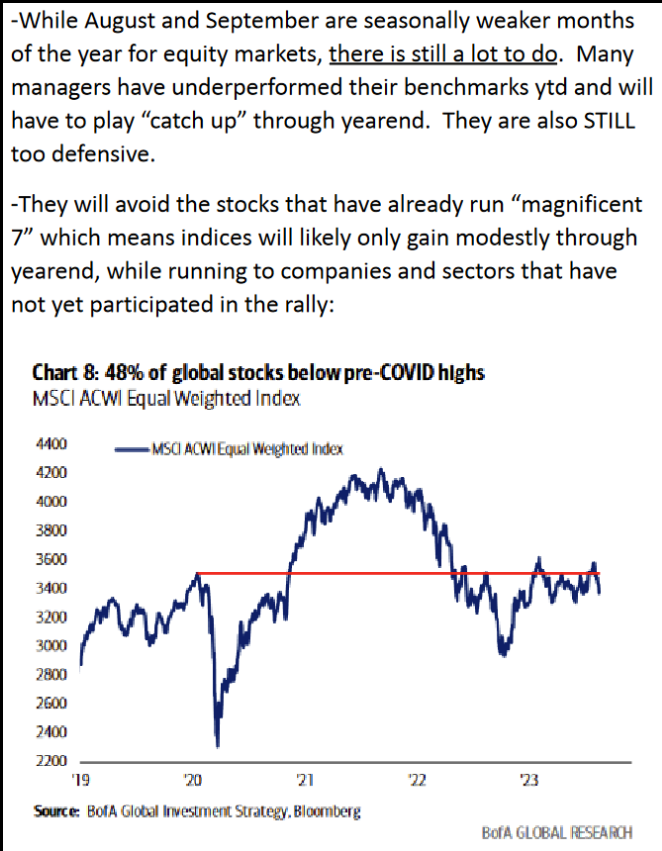
48% of global stocks below pre-COVID highs

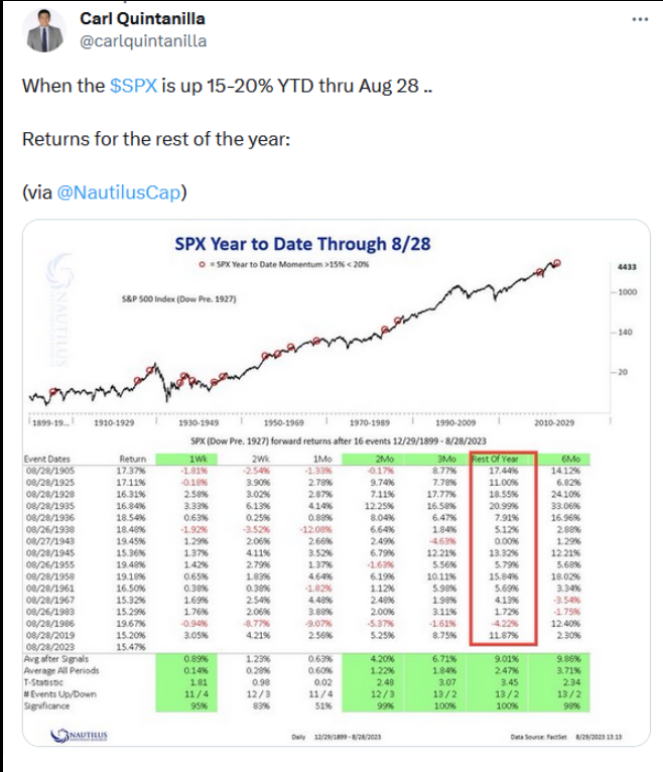
SPX Year to Date Through 8/28

NASDAQ Cycle Composite for 2023

Managers still taking as low of risk in their portfolio as Covid

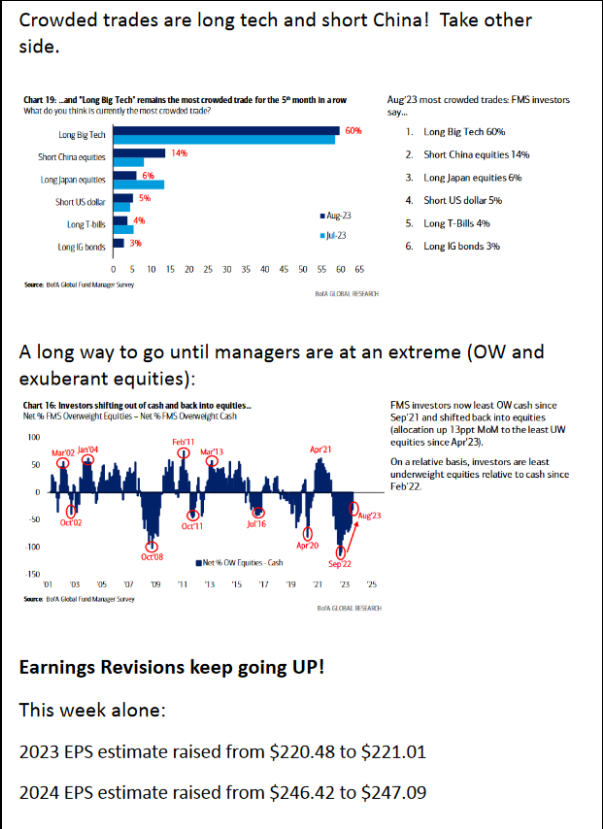
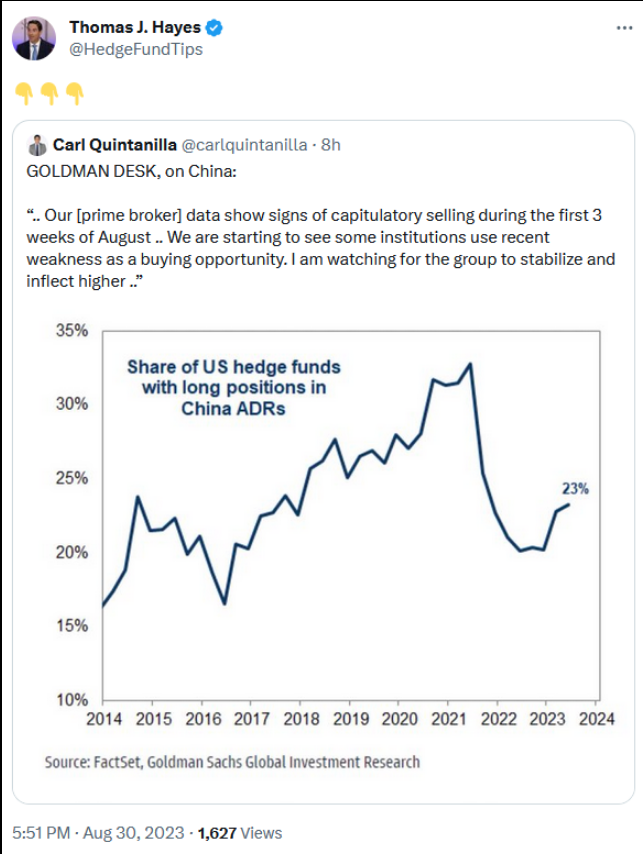
Crowded trades are long tech and short China! Take other side

h/t Seth Golden

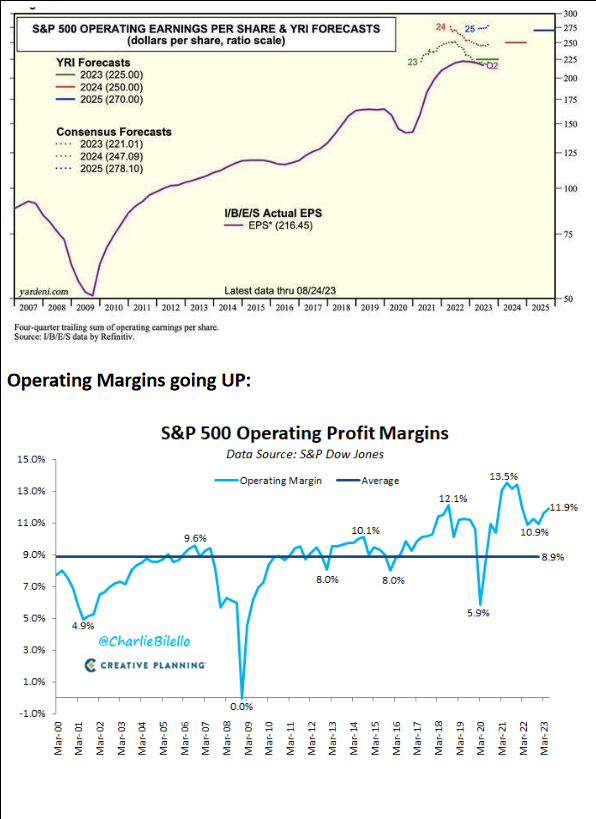
S&P 500 Operating Earnings per Share & YRI Forecasts

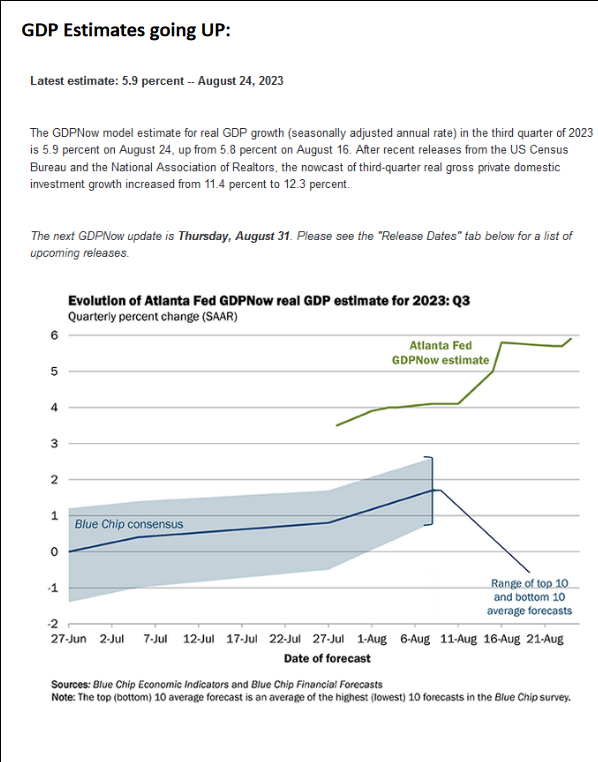
GDP Estimates going UP:

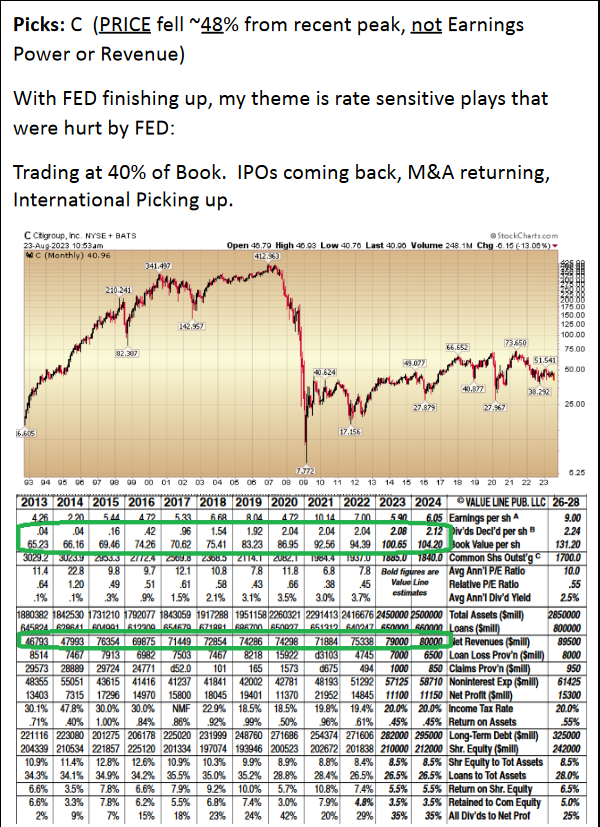
CTGroup Inc

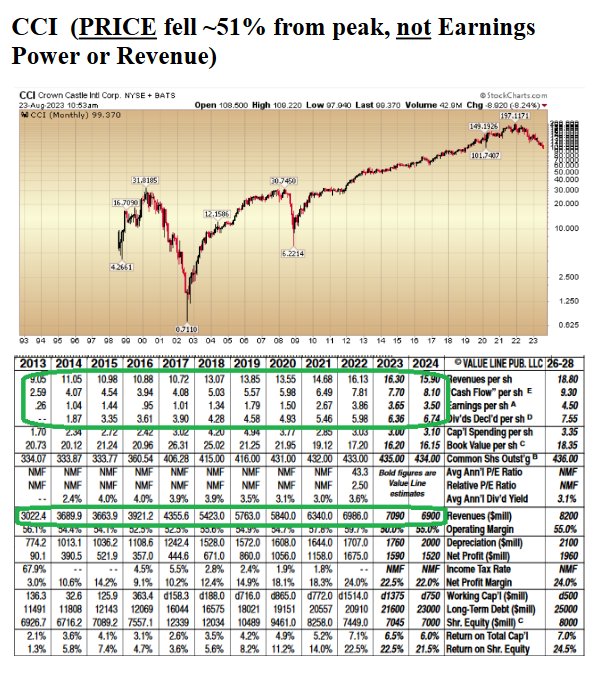
Crown Castle Intl Corp

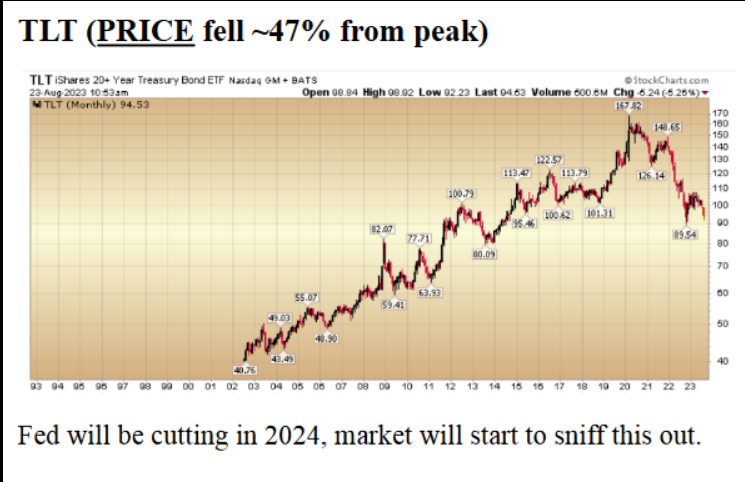
TLT iShares 20+ Year Treasury Bond ETF

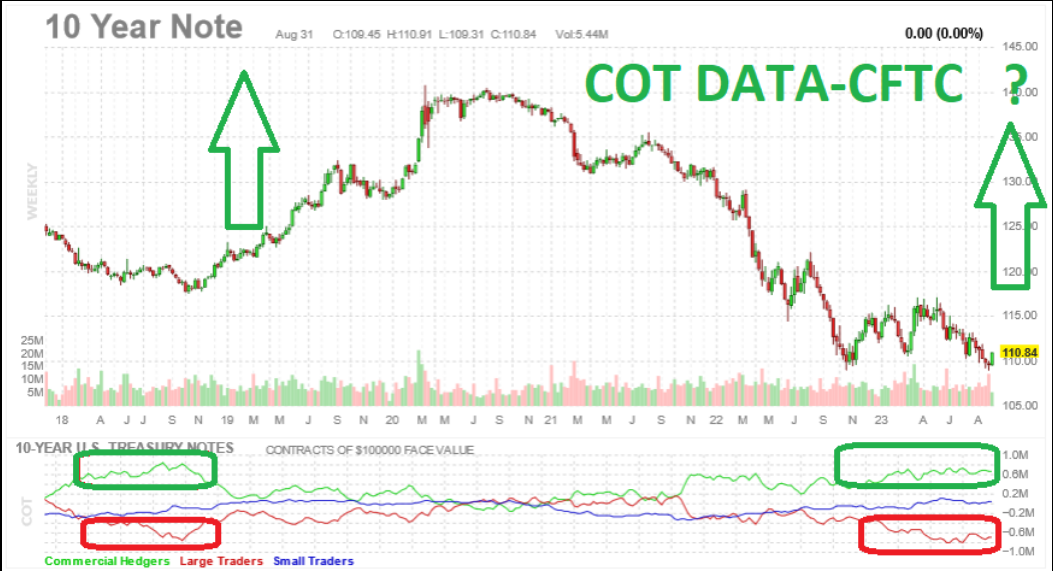
10 Year Note

BABA UPDATE

Share of US hedge funds with long positions in China ADRs

Now onto the shorter term view for the General Market:

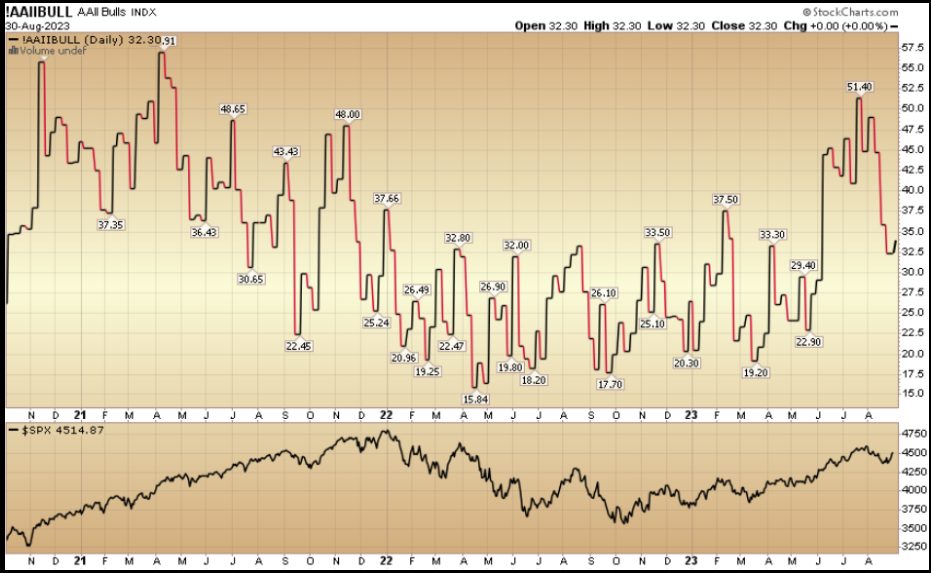
In this week’s AAII Sentiment Survey result, Bullish Percent (Video Explanation) ticked up to 33.1% from 32.3% the previous week. Bearish Percent ticked down to 34.5% from 35.9%. The retail investor is showing continued trepidation.
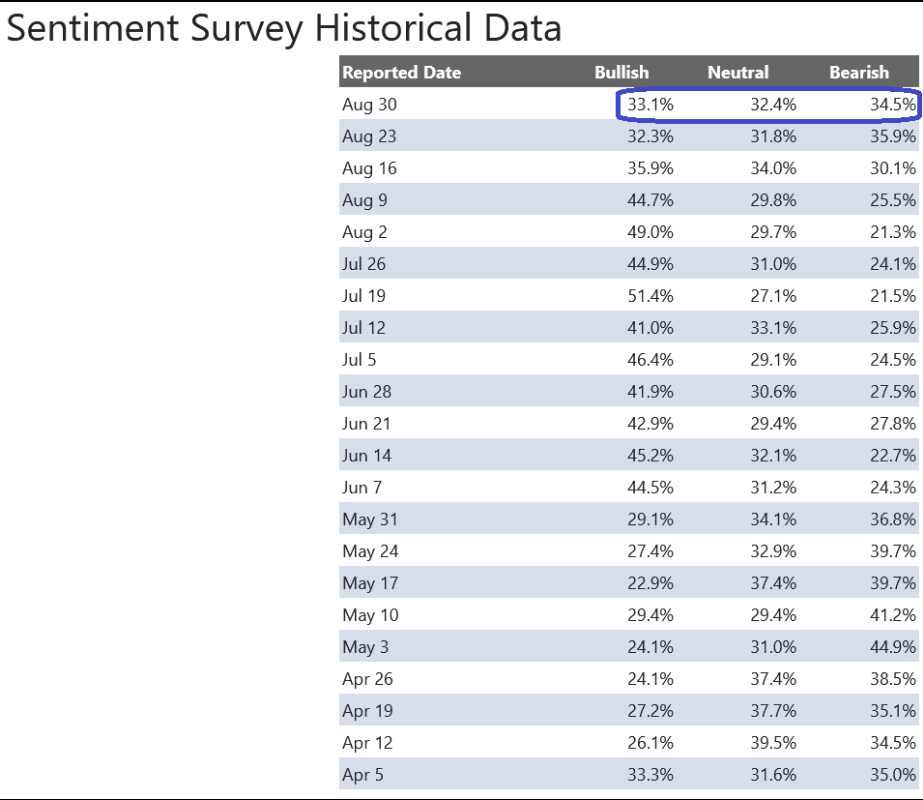
Sentiment Survey Historical Data

AAII Bulls

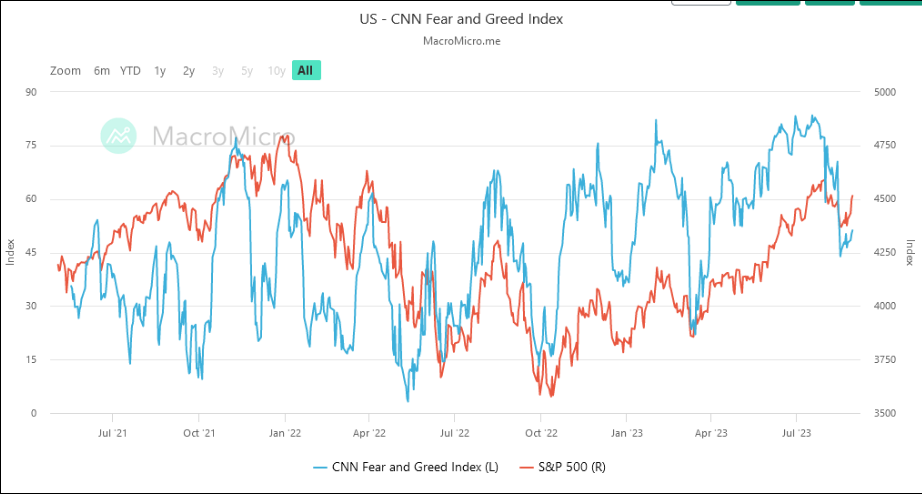
The CNN “Fear and Greed” ticked up from 49 last week to 51 this week. You can learn how this indicator is calculated and how it works here: (Video Explanation)
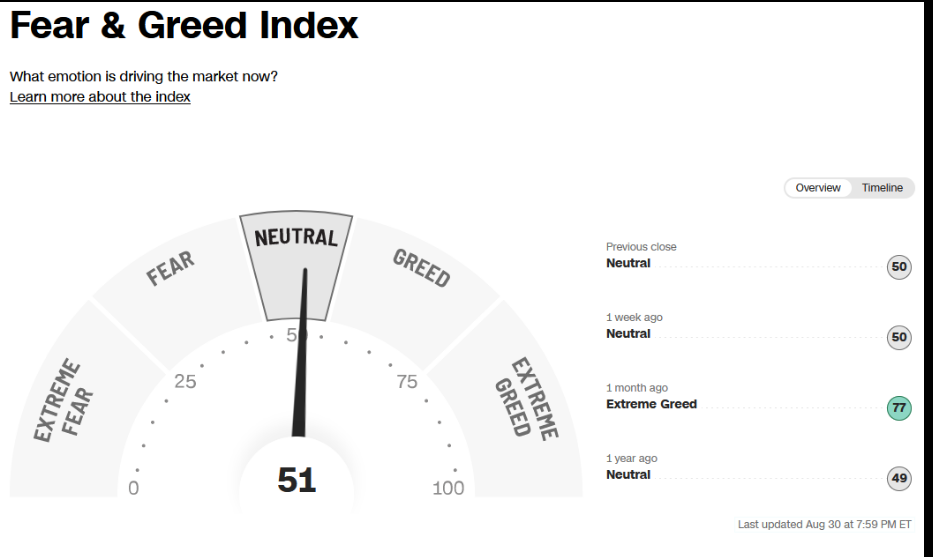
Fear & Greed Index

US - CNN Fear and Greed Index

And finally, the NAAIM (National Association of Active Investment Managers Index) (Video Explanation) dropped to 34.36% this week from 59.87% equity exposure last week. Guess who sold in the hole and is going to have to “chase up” yet again?
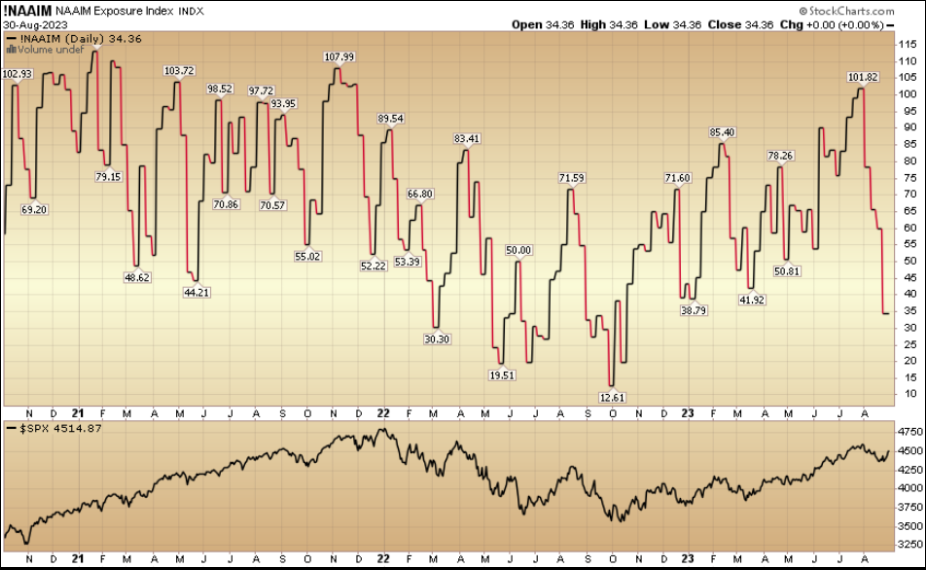
NAAIM Exposure Index

This content was originally published on Hedgefundtips.com.

Latest comments

Loading next article…
Risk Disclosure: Trading in financial instruments and/or cryptocurrencies involves high risks including the risk of losing some, or all, of your investment amount, and may not be suitable for all investors. Prices of cryptocurrencies are extremely volatile and may be affected by external factors such as financial, regulatory or political events. Trading on margin increases the financial risks.
Before deciding to trade in financial instrument or cryptocurrencies you should be fully informed of the risks and costs associated with trading the financial markets, carefully consider your investment objectives, level of experience, and risk appetite, and seek professional advice where needed.
Fusion Media would like to remind you that the data contained in this website is not necessarily real-time nor accurate. The data and prices on the website are not necessarily provided by any market or exchange, but may be provided by market makers, and so prices may not be accurate and may differ from the actual price at any given market, meaning prices are indicative and not appropriate for trading purposes. Fusion Media and any provider of the data contained in this website will not accept liability for any loss or damage as a result of your trading, or your reliance on the information contained within this website.
It is prohibited to use, store, reproduce, display, modify, transmit or distribute the data contained in this website without the explicit prior written permission of Fusion Media and/or the data provider. All intellectual property rights are reserved by the providers and/or the exchange providing the data contained in this website.
Fusion Media may be compensated by the advertisers that appear on the website, based on your interaction with the advertisements or advertisers.
© 2007-2024 - Fusion Media Limited. All Rights Reserved.