We begin with the energy markets where the carnage continues. The selloff started with the latest report on US crude oil inventories showing crude in storage rising by 2.6M barrels (vs. -0.8M expected).
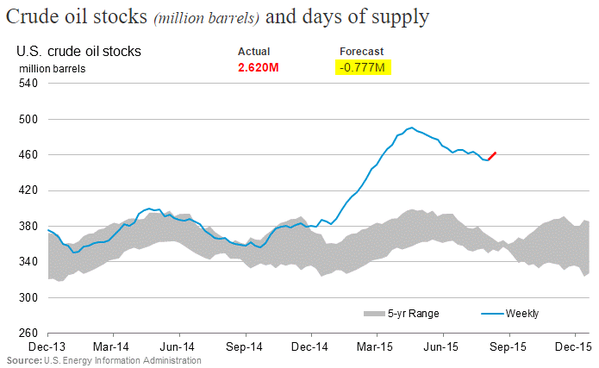
There are several reasons for this increase in supplies:
1. Refinery demand in the US Midwest declined because of the BP's (NYSE:BP) Whiting Indiana refinery outage.
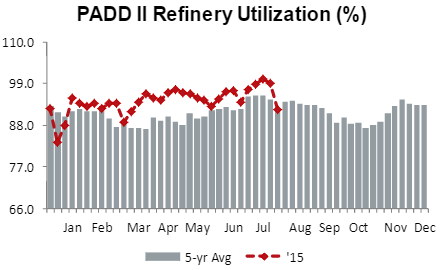
To complicate the situation, there are other refineries that will be undergoing maintenance as well, which should push crude levels in storage even higher.
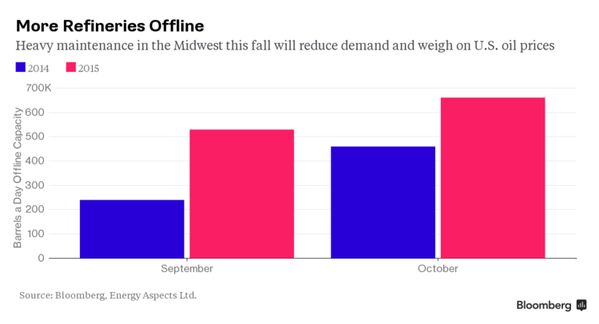
Source: @BloombergNRG
2. As the crude oil futures curve steepens (contango increases), storage becomes profitable again. Storage costs are elevated but at some point the cash and carry trade becomes attractive.
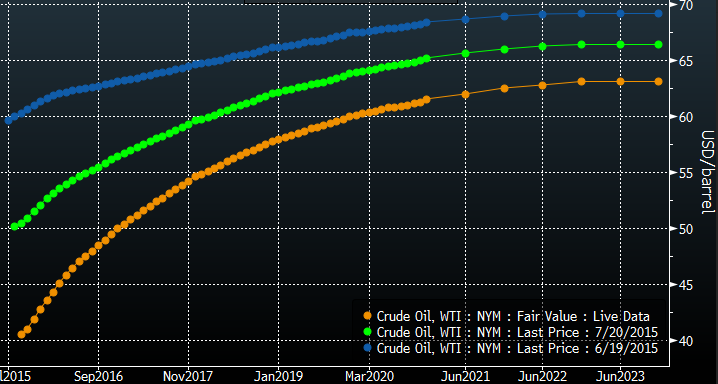
Source: Bloomberg; Thanks Mike!
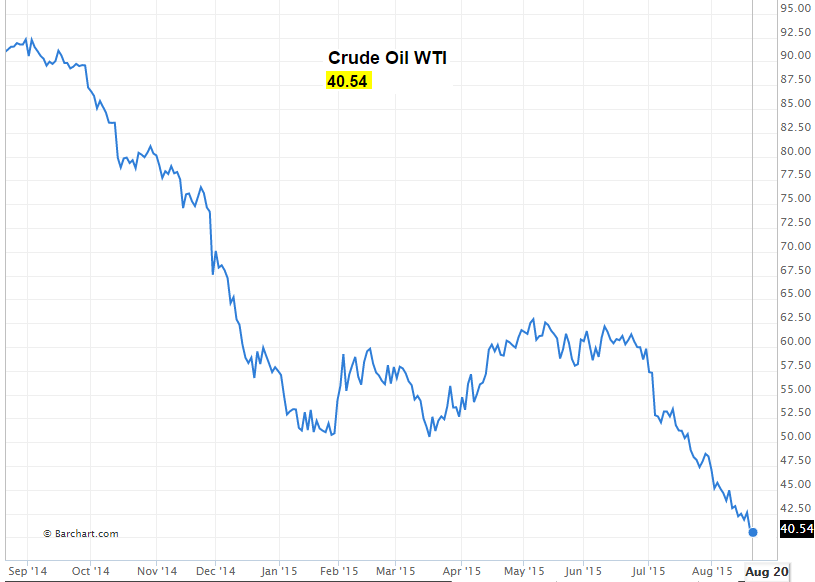
3. The US actually imported more crude than usual recently. Needless to say, crude oil futures went into free-fall, with the September contract now trading below $41/bbl. The decline in recent weeks has been nothing short of spectacular.
Source: barchart
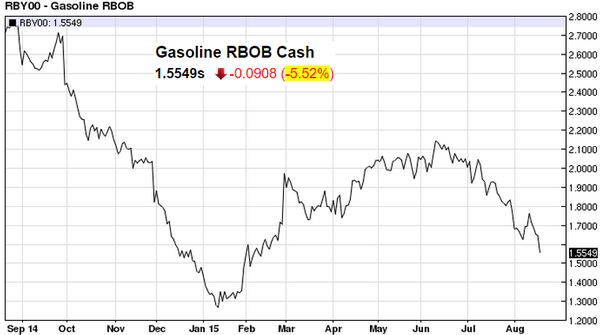
East Coast wholesale gasoline is finally being pressured lower as well. Let's hope this shows up at the pump soon.
Source: barchart
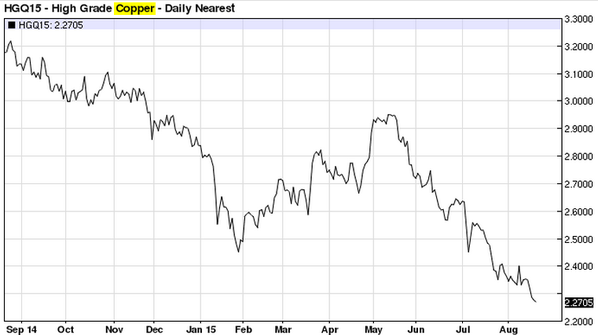
The pain in commodities markets was not limited to energy, as copper prices hit new multi-year lows.
Source: barchart
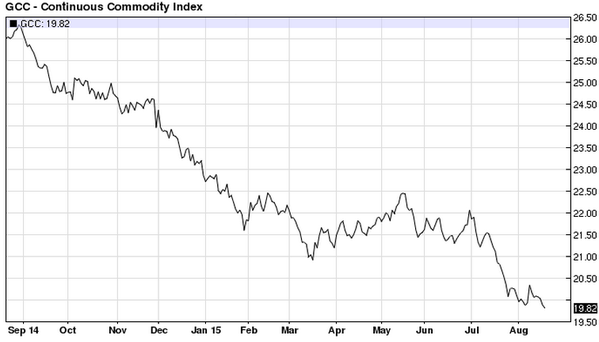
In fact, the broad Continuous Commodity Index followed copper and oil to cycle lows.
Source: barchart
With the massive commodities selloff in progress and China slowing, we continue to see pressure on emerging economies. Here are some examples:
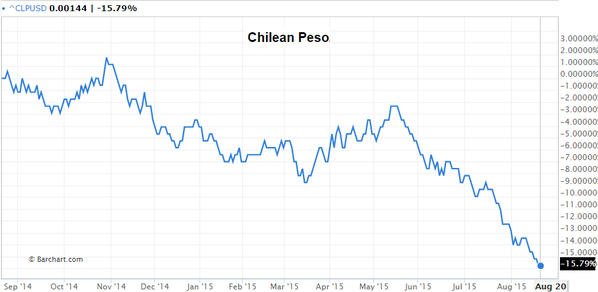
1. The Chilean peso fell to a 12-year low on renewed weakness in copper prices. Here is the peso's relative move against the dollar.
h/t @vexmark
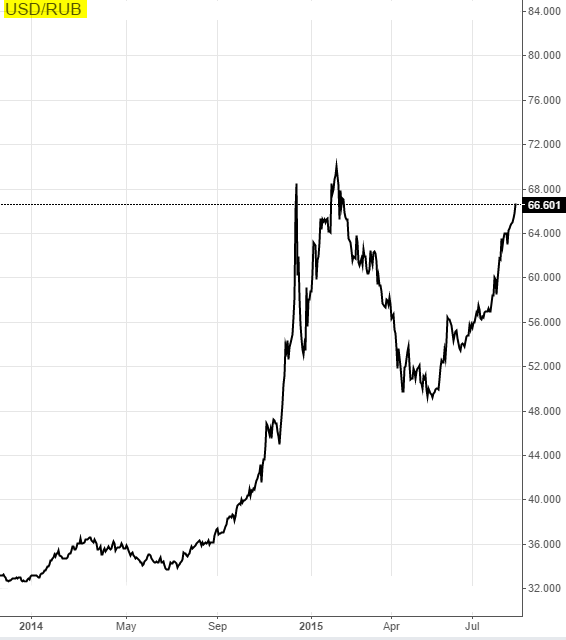
2. The ruble is pushing toward the recent lows, as the US dollar now buys almost 67 rubles. Is Russia going to spend foreign reserves in an attempt to stabilize the situation?
Source: Investing.com
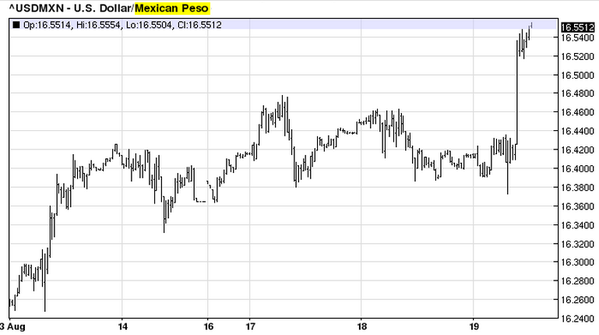
3. The Mexican peso gaps lower despite the ongoing efforts by the country's central bank to stem the slide. Chart below shows how many pesos one dollar buys.
Source: barchart
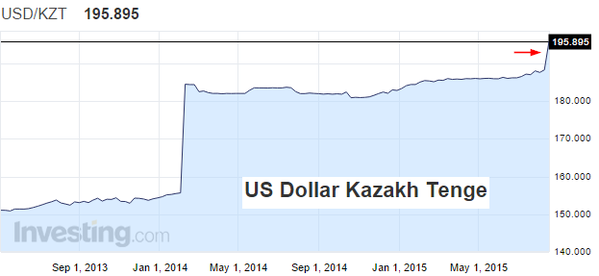
4. Kazakhstan (KZT) and Vietnam (VND) devalued their currencies again. Kazakhstan responded to the falling ruble and energy prices. Vietnam is dealing with the yuan devaluation.
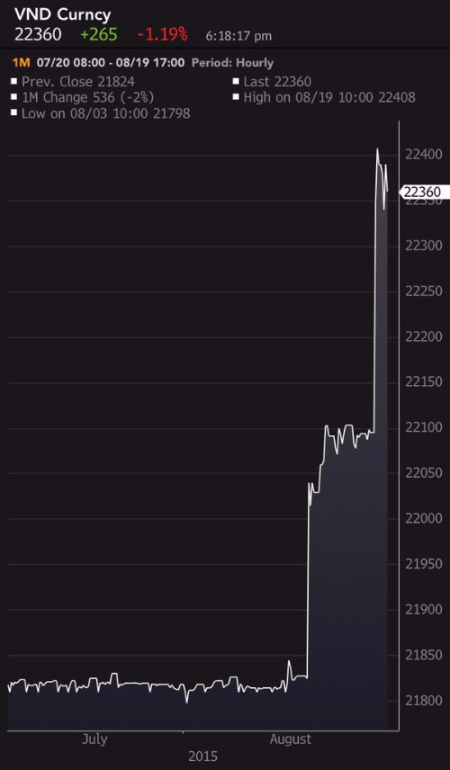
Source: @DavidInglesTV
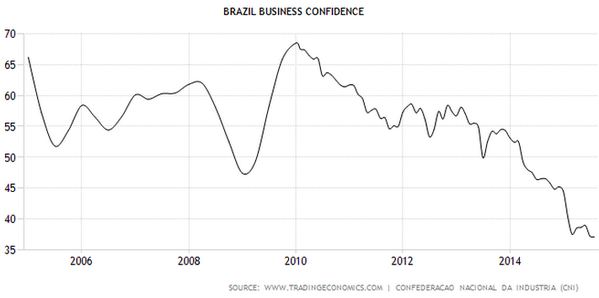
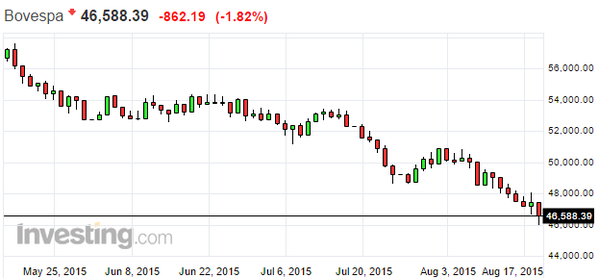
5. Business confidence in Brazil continues to weaken as the stock market approaches correction territory.
6. With capital outflows continuing, shares across emerging markets are tanking and the underperformance against global indices widens.
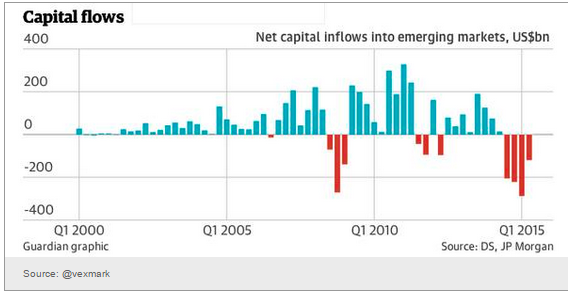
Source: @vexmark
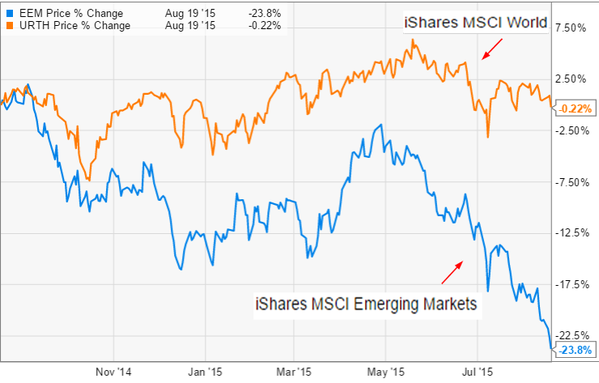
Source: Ycharts
7. Foreign reserves are collapsing.
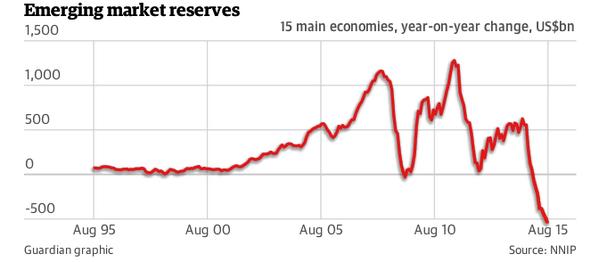
Source: @vexmark
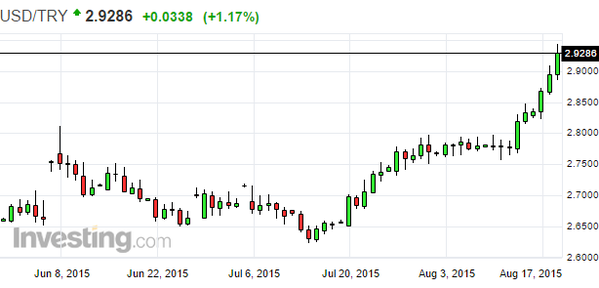
The Turkish lira is not impacted by the commodities rout. Nevertheless, with the risks of a new election rising and Turkish troops killed in a bomb attack in Siirt, the lira hit a record low against the dollar.
As a result of China dumping industrial commodities into the global markets, aluminum premium ("commission" to deliver product to end-user) has declined significantly.
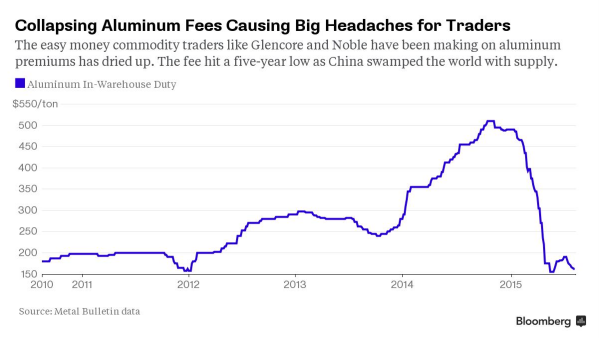
Source: @markets
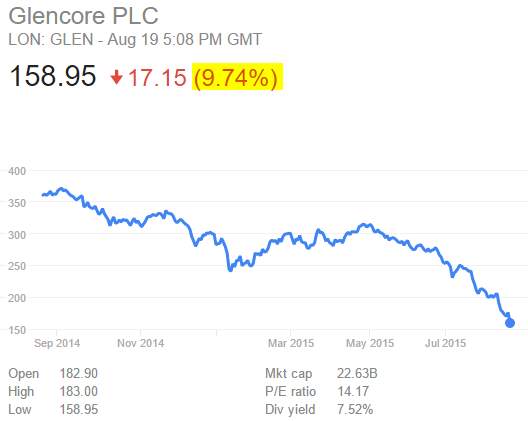
With commodity trading margins under pressure, Glencore (LONDON:GLEN) PLC shares dropped 10% on the latest earnings release. There is no shortage of pain as the commodities supercycle comes to an end.
Source: Google
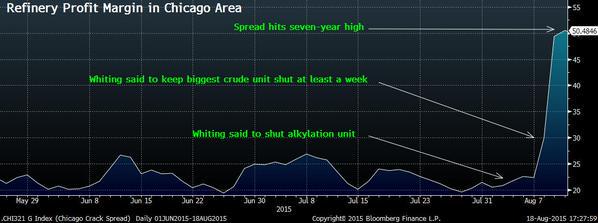
There are some firms who make money on commodity spreads. Chicago area refineries enjoy a massive spike in margins as a result of the Whiting refinery outage. This has really angered many Chicago residents.
Source: @BloombergNRG
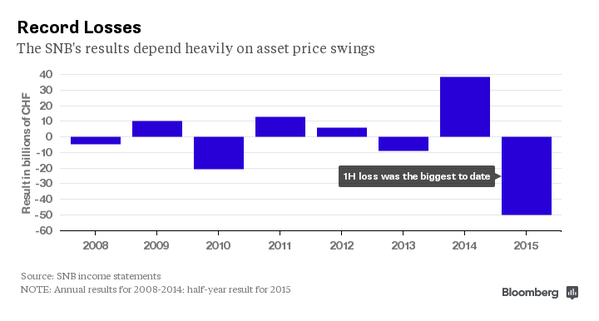
In other developments around the world, the Swiss central bank (the SNB) is experiencing significant P&L volatility in its portfolio. The SNB has material market exposure, particularly when the Swiss franc strengthens. Yes, the vertical axis is in billion Swiss francs.
Source: @business
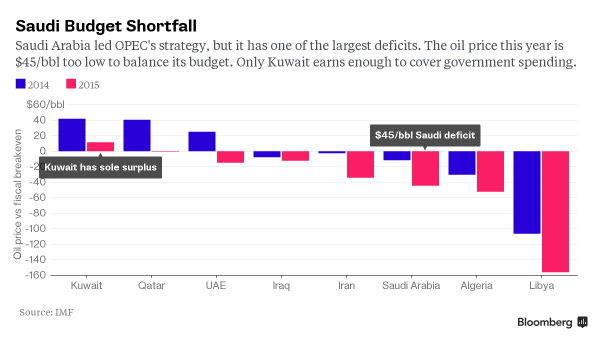
With the collapse in oil prices, a number of OPEC nations are seeing rising budget shortfalls. It will be interesting how the various nations handle this.
Source: @BloombergNRG
