This article was written exclusively for Investing.com
Energy stocks have surged in 2021, with the Energy Select Sector SPDR ETF (NYSE:XLE) the best performing sector, up nearly 18% to start the year. The group may still have room to climb based on some bullish options betting, suggesting the ETF rises to as high as $48.50, a jump of nearly 9%.
The strong start to 2021 for the sector is due to a slumping US dollar, which has helped to support oil prices, sending the commodity to more than $53 after starting the year below $50. But it isn't just improving oil prices helping; sentiment among the group has improved, with sell-side analysts like JP Morgan upgrading Exxon Mobil (NYSE:XOM).
Bullish Betting Taking Place
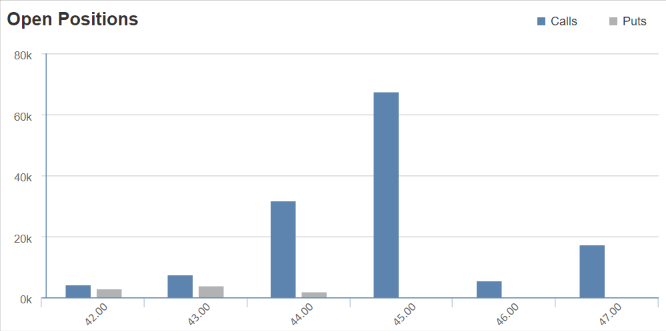
There has been plenty of bullish betting taking place on the XLE ETF at the $45 strike price for expiration on Feb. 19. Over the past 5 trading sessions, the open interest for those calls rose by around 52,000 contracts over that time. The data shows that most of the calls were bought for approximately $1.05 per contract. It would suggest that the ETF is trading over $46.05 by the expiration date.

Additionally, there has been some bullish betting on the XLE at the $48 strike price for the same expiration date. In this case, the calls were bought for about $0.45 per contract, suggesting the ETF is trading above $48.45 by the middle of February. That would be an increase of almost 9% over the next few weeks.
Big Exxon Upgrade
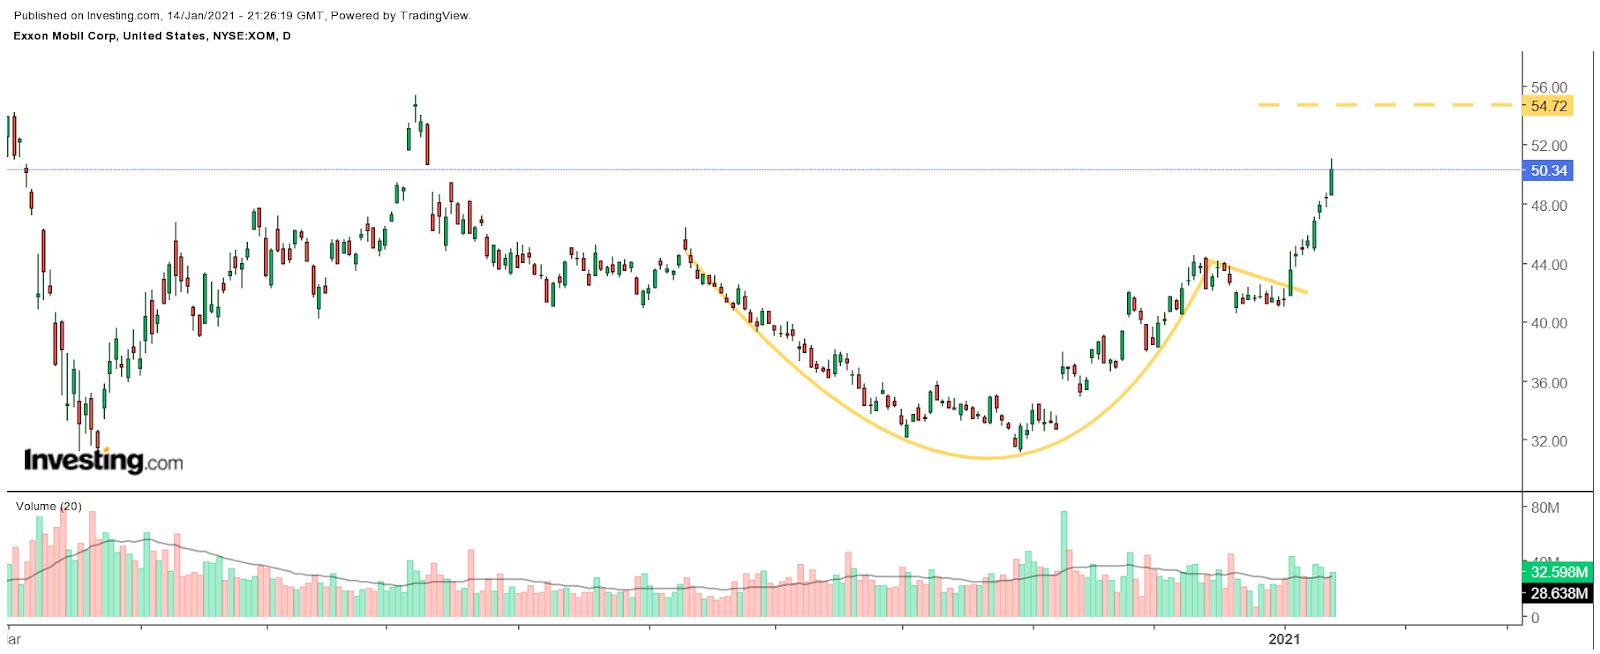
The bullish outlook has been aided by the big moves higher by stocks like Exxon Mobil, which has surged off its lows of $31.50 back in October. The stock got an added boost recently when JPMorgan (NYSE:JPM) upgraded the stock to overweight for the first time in seven years, while giving the equity a price target of $56, which would amount to a gain of around 11%.
The bullish optimism is undoubtedly also reflected in Exxon's technical chart, which currently shows a cup-and-handle pattern. This pattern would suggest further upside to the stock from its current levels of around $50. A projection of the bullish technical pattern would indicate that the stock climbs to approximately $54.75, a gain of nearly 9%. That happens to also be where a technical level resides from a previous peak on June 8.

Improving Economy
The bullish outlook has been driven by improving oil prices as the dollar has plunged, and as the global economy begins to recover. The outlook for the economy has been aided by the prospect of more fiscal stimulus from the US. That has resulted in yields, including the 10-year note, rising while pushing the dollar lower. The falling dollar has sent the oil prices surging their highest level since February of 2020.
If the dollar remains weak and global demand for oil continues to recover. It certainly seems possible that the energy sector can continue to see a significant tailwind in 2021. After all, the energy group had a horrible 2020, despite many investors focusing their attention on the world of renewable energy. The business of fossil fuels isn't likely to disappear anytime soon, and that means the sector could continue to push higher in 2021, as it recovers from its horrible 2020 losses.
