Key Points:
- Near-term downsides are looking likely.
- Long-term head and shoulders could be shaping up.
- Keep an eye on the FOMC meeting.
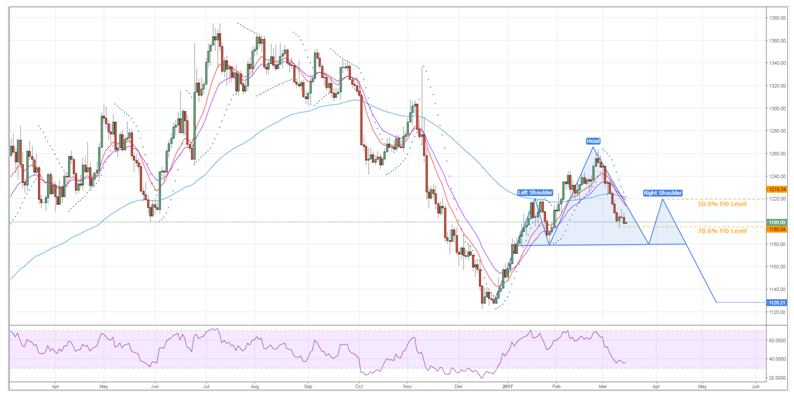
Despite a slowing rate of decline, gold could have further downsides on offer moving ahead. Specifically, the shift in the metal’s technical bias should see it back at around the 1180.00 handle within the next week or so. However, these losses could be hinting at the formation of a long-term chart pattern which might lead to a rather tumultuous future for gold prices.
However, before we get into the long-term forecast, let’s take a look at some of the technical arguments for further losses moving forward. For one, the EMA bias provides what could be the clearest indication of further downsides, largely as a result of the recent bearish crossover of the 12, 20, and 100 day moving averages. Additionally, the Parabolic SAR retains a firm bearish bias which should keep selling pressure in place.

If the metal does pull back as forecasted, this could hint at the presence of a long term head and shoulders pattern. If such a pattern is indeed present, this could mean that we see a rally in the immediate aftermath of the coming tumble. This uptick in buying pressure will likely bring gold prices back up to the 1219.34 mark before resistance kicks in. Conveniently, the presence of the 50.0% Fibonacci level and the 100 day EMA around this price will be instrumental in encouraging the right hand shoulder retrace as visualised above.
In the event that this second shoulder forms and confirms the long-term structure, downside risks for gold will spike considerably. In fact, we could have December’s low tested once again before we see any meaningful support come into effect. However, it will be worthwhile waiting for that 78.6% Fibonacci level to be broken before pricing in a slip all the way back to the 1128.21 level.
From a fundamental perspective, it’s a fairly safe bet to assume gold prices are long-term bullish. Of course, this is a direct result of the US Fed’s plan to tighten monetary policy significantly moving ahead. The main uncertainty is exactly when the Fed chooses to begin tightening which is especially pertinent this week given the impending FOMC meeting. However, if we don’t see the much-talked-about hike this week, it will basically assure one for the next meeting which would work well with the above technical forecast.
Ultimately, keep an eye on the metal as it is sure to be in focus over the coming weeks. As discussed above, this could see some interesting moves for gold prices which offers much in the way of trading opportunities for both the bulls and the bears out there. Additionally, whilst the FOMC will be one of the major drivers of price, don’t forget to keep an eye on political risks in the EU and the standard US economic news.
