In this TRON (TRX) price prediction 2023, 2024-2030, we will analyze the price patterns of TRX by using accurate trader-friendly technical analysis indicators and predict the future movement of the cryptocurrency.
TRON (TRX) Current Market Status
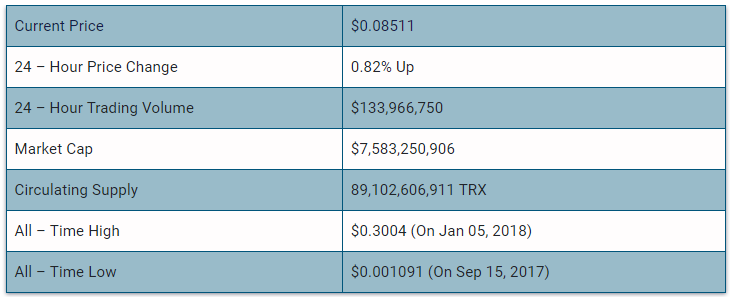
What is TRON (TRX)

TRON (TRX) exists as the native crypto coin on the TRON blockchain. TRON was founded by Justin Sun and is managed by the TRON Foundation. Initially, TRX was launched as an ERC-20 token on the Ethereum blockchain in 2017. Later in 2018, TRX migrated onto its native blockchain. TRON blockchain runs based on the delegated proof-of-stake (DPoS) consensus mechanism.
TRON (TRX) is utilized as a governance token on the blockchain granting voting rights. It is also deployed as credit card payments too. Even more, TRX continues to stay as a potential payment option for content creators.
TRON 24H Technicals
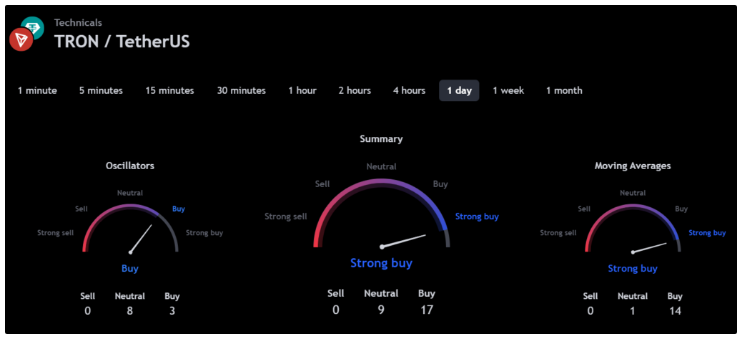
(Source: TradingView)
TRON (TRX) Price Prediction 2023
TRON (TRX) ranks 10th on CoinMarketCap in terms of its market capitalization. The overview of the TRON price prediction for 2023 is explained below with a daily time frame.
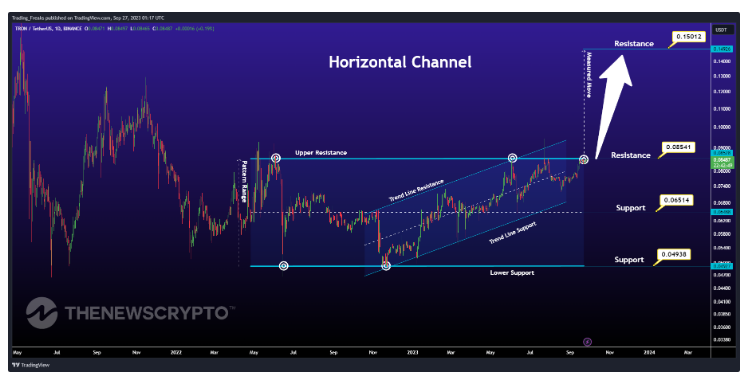
TRX/USDT Horizontal Channel Pattern (Source: TradingView)
In the above chart, TRON (TRX) laid out a horizontal channel. A horizontal channel or sideways trend has the appearance of a rectangle pattern. It consists of at least four contract points. This is because it needs at least two lows to connect, as well as two highs. Horizontal channels provide a clear and systematic way to trade by providing buy and sell points. The longer the horizontal channel, the stronger the exit movement will be. There is frequently a price on the channel after exit. the exit often occurs at the fourth contact point on one of the horizontal channel’s lines.
At the time of analysis, the price of TRON (TRX) was recorded at $0.08511. If the pattern trend continues, then the price of TRX might reach the resistance levels of $0.08541 and $0.15012. If the trend reverses, then the price of TRX may fall to the support of $0.06514, and $0.04938.
TRON (TRX) Resistance and Support Levels
The chart given below elucidates the possible resistance and support levels of TRON (TRX) in 2023.
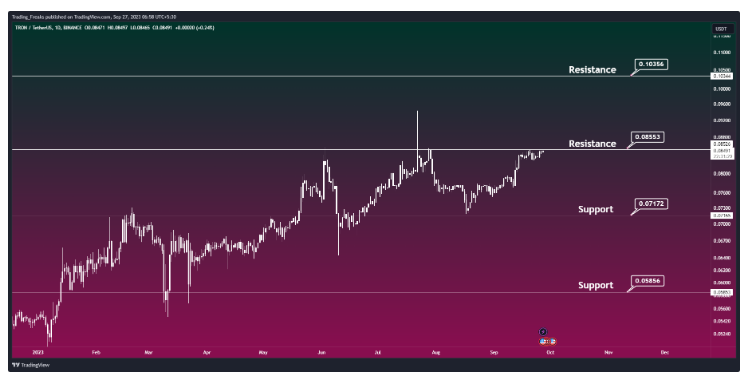
TRX/USDT Resistance and Support Levels (Source: TradingView)
From the above chart, we can analyze and identify the following as resistance and support levels of TRON (TRX) for 2023.

TRX Resistance & Support Levels
TRON (TRX) Price Prediction 2023 — RVOL, MA, and RSI
The technical analysis indicators such as Relative Volume (RVOL), Moving Average (MA), and Relative Strength Index (RSI) of Bitcoin (TRX) are shown in the chart below.
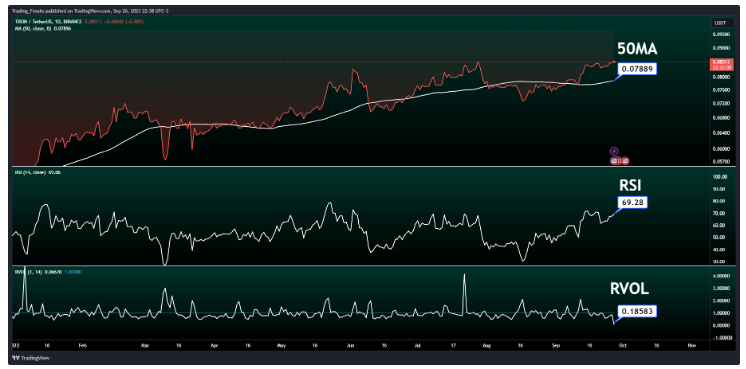
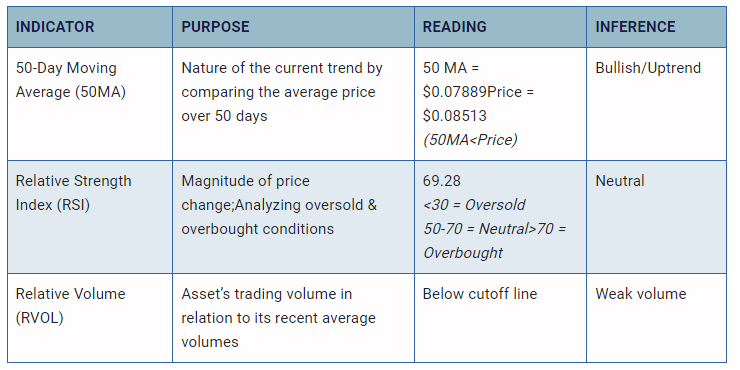
TRX/USDT RVOL, MA, RSI (Source: TradingView)
From the readings on the chart above, we can make the following inferences regarding the current TRON (TRX) market in 2023.
TRON (TRX) Price Prediction 2023 — ADX, RVI
In the below chart, we analyze the strength and volatility of TRON (TRX) using the following technical analysis indicators — Average Directional Index (ADX) and Relative Volatility Index (RVI).
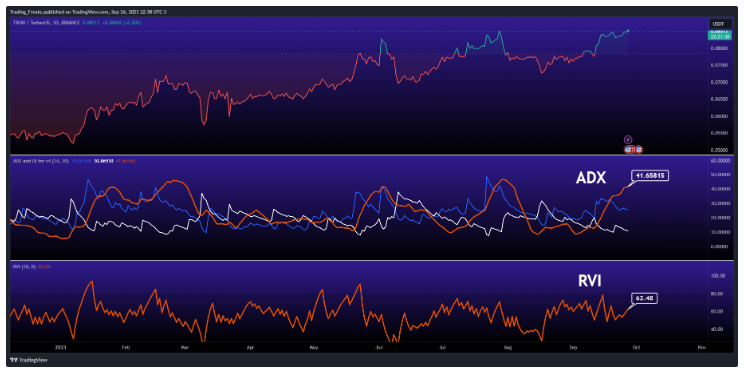
TRX/USDT ADX, RVI (Source: TradingView)
From the readings on the chart above, we can make the following inferences regarding the price momentum of TRON (TRX).

Comparison of TRX with BTC, ETH
Let us now compare the price movements of TRON (TRX) with that of Bitcoin (BTC), and Ethereum (ETH).
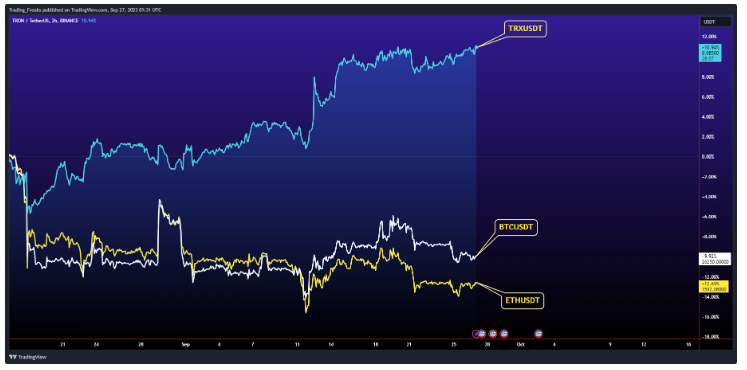
BTC Vs ETH Vs TRX Price Comparison (Source: TradingView)
From the above chart, we can interpret that the price action of TRX is similar to that of BTC and ETH. That is, when the price of BTC and ETH increases or decreases, the price of TRX also increases or decreases respectively.
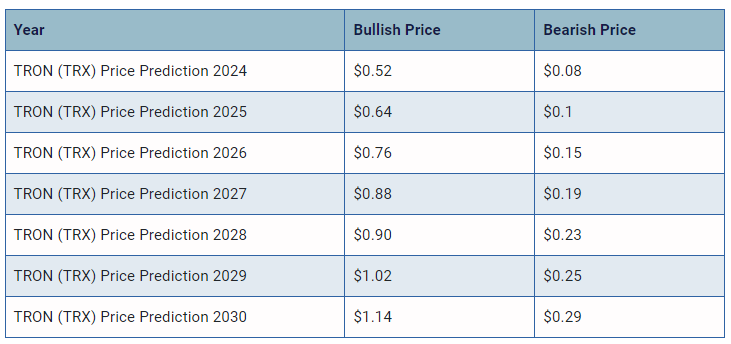
TRON (TRX) Price Prediction 2024, 2025 – 2030
With the help of the aforementioned technical analysis indicators and trend patterns, let us predict the price of TRON (TRX) between 2024, 2025, 2026, 2027, 2028, 2029 and 2030.
Conclusion
If TRON (TRX) establishes itself as a good investment in 2023, this year would be favorable to the cryptocurrency. In conclusion, the bullish TRON (TRX) price prediction for 2023 is $0.10356. Comparatively, if unfavorable sentiment is triggered, the bearish TRON (TRX) price prediction for 2023 is $0.05856.
If the market momentum and investors’ sentiment positively elevate, then TRON (TRX) might hit $0.5. Furthermore, with future upgrades and advancements in the TRON ecosystem, TRX might surpass its current all-time high (ATH) of $0.3004. and mark its new ATH.
This content was originally published by our partners at The News Crypto.
