
Tyson Foods (NYSE:TSN) investors have had a good year. The total return for TSN YTD is 23.6%, substantially higher than the S&P 500’s return of 16.3%.
The meat and prepared food company reported blowout FY Q3 earnings on Aug. 9, 2021, with quarterly EPS exceeding the consensus expected level by 66.5%. TSN’s forward P/E is 11.55 and the forward dividend yield is 2.27%.

Source: Investing.com
The meatpacking industry is vulnerable to COVID-related risks to its workforce and Tyson has suffered significant outbreaks among employees. Tyson recently announced that 91% of its workforce is vaccinated, following a company mandate announced in August.
Inflation and labor availability are headwinds for TSN. The company is raising prices on its products in response to increasing feedstock costs, but the company reports that keeping up with rising costs is a challenge. The company is also hampered by a worker shortage and the CEO, Donnie King, referred to hiring and retention as the “single biggest issue” the company faces.
Tyson is building out product lines of non-meat protein to compete with upstarts like Beyond Meat (NASDAQ:BYND). This move makes a lot of sense as the market sees high growth potential for vegetable-based faux meat, which is reflected in BYND’s forward P/B of 26, as compared to TSN’s forward P/B of 1.7. Anything TSN can do to motivate a higher valuation will be good for shareholders. Vegetable protein also opens up channels to health-conscious consumers who are eating less, or no, meat.
I last analyzed TSN on May 4, when I gave the stock a neutral rating. Over the 5 months since, the shares have gained 0.39% (up 1.54% including dividends), as compared to the S&P 500, which has gained 2.7% (3.39% including dividends) over the same period.
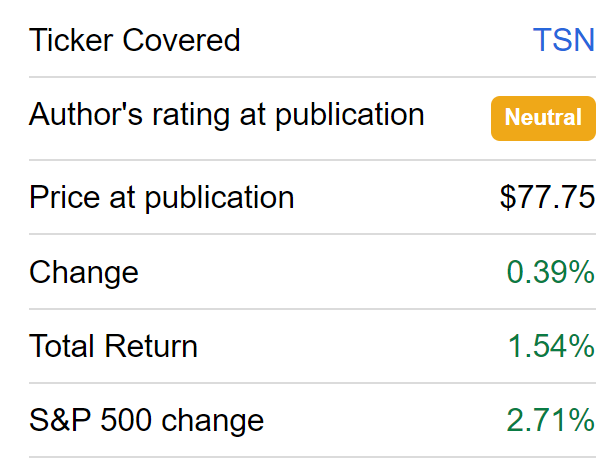
Source: Seeking Alpha
In analyzing stocks, I rely on two forms of consensus outlooks. The first is the well-known Wall Street analyst consensus rating and price target. The second is the consensus of buyers and sellers of options, the market-implied outlook, which is derived from options prices at a range of strikes. The price of an option represents the market’s consensus estimate for the probability that the price of the underlying security or index (TSN, in this case) will rise above (call option) or fall below (put option) a specific level (the strike price) between now and when the option expires.
By analyzing calls and puts at a range of strike prices and a common expiration date, it is possible to calculate a probabilistic outlook for the underlying security that reconciles the options prices. This is called the market-implied outlook. For those who are unfamiliar with the concept, I have written an overview post, including links to the relevant financial literature.
On Mar. 4, the Wall Street consensus outlook was bullish, with a 12-month price target that was about 4.5% above the share price at that time (for an expected total return of 6.8%). The market-implied outlook to early 2022 was neutral, and the highest-probability outcome was -1.75% in price return, with annualized volatility of 26%. As a rule of thumb for a buy rating, I look for expected total return that is at least half the annualized expected volatility. Even taking the analyst consensus price target at face value, TSN was far below the threshold for an attractive risk/return balance.
With five months since my last analysis and the market having had time to process TSN’s impressive recent earnings, I am updating my view.
Wall Street Consensus Outlook for TSN
ETrade calculates the Wall Street consensus using the views of 5 ranked analysts who have issued ratings and price targets within the past 90 days. The consensus rating is bullish (as it has been since late 2020) and the consensus 12-month price target is 12.15% above the current price. The lowest price target is 1.14% above the current price. Of the 5 analysts, 3 assign a neutral rating and 2 assign a buy rating.

Source: ETrade
Investing.com calculates the Wall Street consensus using a larger population of 12 analysts. The consensus rating is outperform (bullish) and the 12-month price target is 12.83% above the current share price. The lowest price target from the 12 analysts is $82, 5% above the current price.

Source: Investing.com
While the analyst coverage for TSN is fairly thin, the ratings and price targets exhibit a fair level of agreement and the two versions of the consensus outlook, from ETrade and Investing.com, indicate a bullish view with expected 12-month price appreciation of 12.5% (averaging the two).
Market-Implied Outlook for TSN
I have analyzed call and put options at a range of strike prices, all expiring on Jan. 21, 2022, to generate the market-implied outlook for TSN for the next 3.6 months (from now until the expiration date). There is a fairly high level of options trading on TSN for this expiration date, which is largely why I chose to analyze January 2022 options. I have also generated the market-implied outlook for the next 8.4 months using options that expire on June 17, 2022. These options are thinly traded, however, so this longer outlook is considered only marginally meaningful.
The standard presentation for the market-implied outlook is a probability distribution of price returns, with probability on the vertical axis and return on the horizontal.

Source: Author’s calculations using options quotes from ETrade
The market-implied outlook to early 2022 has a significant tilt that favors positive returns (a bullish outlook), with the peak probability corresponding to a price return of 3.4% over this period. The distribution exhibits negative skewness, which means that the probability of large negative returns is higher than for positive returns of the same magnitude. The annualized volatility calculated from this distribution is 26.3%.
To make it easier to directly compare the probabilities of positive and negative returns, I look at a version of the market-implied outlook with the negative-return side of the distribution rotated about the vertical axis (see chart below).

Source: Author’s calculations using options quotes from ETrade. The negative return side of the distribution has been rotated about the vertical axis.
This view of the market-implied outlook emphasizes the elevated probabilities of positive vs. negative returns from now until early 2022 (the solid blue line is above the red dashed line for a wide range of the most-probable outcomes). This is a solidly bullish market-implied outlook.
Theoretically, market-implied outlooks are expected to show somewhat elevated probabilities of negative returns, reflecting risk-averse investors' tendency to pay more than fair value for put options. In addition, dividend-paying stocks exhibit somewhat elevated probabilities of negative returns because dividend payments reduce the upside potential. There is no way to robustly estimate the size of these effects, but considering the potential impacts emphasizes the bullishness of this outlook.
The 8.4-month market-implied outlook to June 17, 2022 (calculated using options that expire on this date) shows slightly elevated probabilities of negative returns (the red dashed line tends to be slightly above the solid blue line). The annualized volatility derived from this outlook is 28.8%. In light of the two factors discussed in the previous paragraph, I interpret this market-implied outlook to be neutral. Because of the thin options market at this time horizon, I don’t consider the market-implied outlook to be very meaningful. That side, it would have been a bit concerning if this outlook was very bearish.

Source: Author’s calculations using options quotes from ETrade. The negative return side of the distribution has been rotated about the vertical axis.
The market-implied outlook for TSN is bullish into early 2022 and neutral to mid-year. The expected volatility is 26.3% for the outlook to Jan. 21, 2022, rising to 28.8% for the outlook to June 17, 2022.
Summary
Tyson Foods has rallied in 2021, but the current valuation remains reasonable. While the company faces significant near-term challenges due to inflation and labor shortages, the consensus-beating earnings over recent quarters provide some reason for optimism.
As we approach winter, with the potential for higher rates of COVID-19 infections, Tyson’s commitment to maintaining a fully-vaccinated workforce puts the company in a favorable position.
Longer-term, Tyson is moving proactively to diversify into non-meat protein. The new products expand Tyson’s market and allow the firm to benefit from trends favoring lower consumption of meat. The Wall Street consensus outlook continues to be bullish and the 12-month price target has increased, to give the shares an expected 12.5% price appreciation, for a total expected return of 14.8% over the next year.
As a rule of thumb for a buy rating, I look for an expected 12-month return that is at least half the expected annualized volatility. Taking the Wall Street consensus price target at face value, TSN meets this criterion (14.8% expected return vs. annualized volatility of 26.3%-28.8%). The market-implied outlook to early 2022 is bullish. My final overall rating for TSN is bullish.