After years of anticipation and endless speculation as to timing, this year's most heralded initial public offering (IPO) is finally on track. With the release of Uber’s S-1 filing this past Friday, the San Francisco-based ride-hailing company is expected to begin trading sometime next month. It's anticipated to be one of the biggest IPOs in recent years.
Over the past few years, Uber (NYSE:UBER) has upended the conventional transportation marketplace, by allowing any interested individual to essentially become a taxi driver simply by registering with the company's website and/or app. The venture has been popular with users—both drivers and passengers alike—but has really set Silicon Valley on fire, from where it received billions in startup and bridge funding.
According to Reuters, Uber is looking to raise around $10 billion via the IPO. When it does, the company will have the honor of becoming the seventh biggest IPO ever in the United States. If all goes according to plan, the ride-sharing giant is expected to be worth around $100 billion—a market cap unheard of for IPOs since Alibaba's (NYSE:BABA) debut in 2014.
Key Metrics
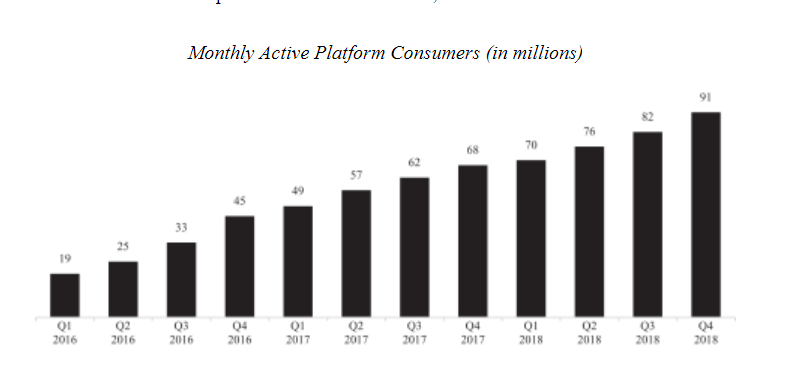
Though Uber’s S-1 filling is well over 200 pages long, it contains surprisingly little information on the company's key metrics. For its critical 'users' number, Uber provides something it calls monthly active platform consumers, or MAPCs.

In Q4 2018, the year-over-year monthly user count grew by 35%, from 68 million to 91 million. During the previous year, however, Uber’s MAPC growth was more robust, up 51%. Of course, it isn’t fair to expect continuing 50% YoY expansion; if Uber manages to keep its growth rate at or above 30% YoY, investors would be more than satisfied.
The problem with this version of their user metric is that, since Uber operates in 63 countries, there's no indication of the percentage of U.S. user vs. international customers. U.S.-based users are more significant to the company's the bottom line since a ride in the U.S is many times more profitable than a similar transaction in India, for example.
This is true for another key metric as well: trips.

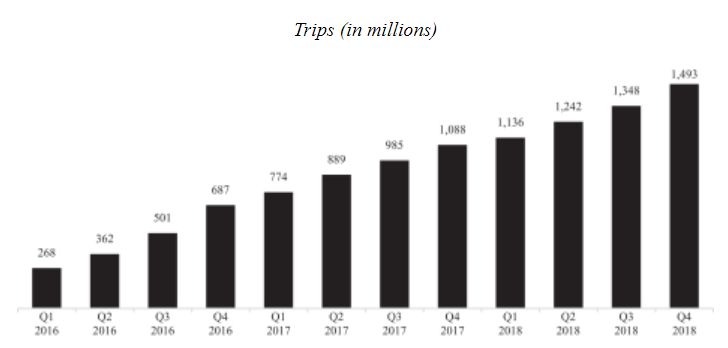
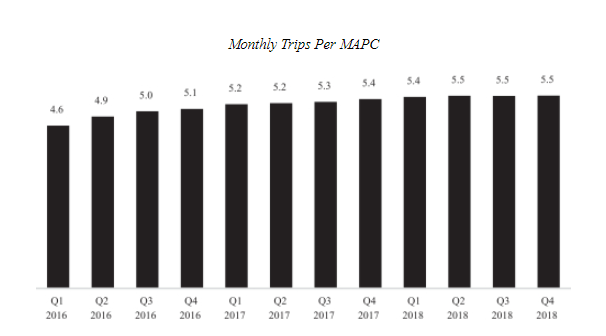
In Q4 2018, Uber customer's logged almost 1.5 billion trips, up from 1.08 billion in Q4 2017, a 37% gain. But the drilldown Uber provides for monthly trips per MAPC is murky as well.
After years of managing to increase the number of trips from every single user, Uber appears to have maxed out on this metric:

But here again the information is somewhat murky. Uber defines a trip in the broadest possible sense—this includes an actual Uber ride, an e-scooter rental, even a delivery from Uber Eats, its food-delivery division. Aggregating activity from all of Uber's three segments into one number doesn't enable a full, nor accurate, analysis of Uber’s growth potential. As can be seen below, not all of the company's segments are created equal.
Segments and Revenue
Uber operates in three separate segments: Ride hailing—which includes cars, bikes, boats and even planes; Uber Eats; and Other, which includes such things as a vehicle leasing program the company is shuttering and a freight service they're currently testing. Combined, ride hailing and Uber Eats make up 95% of Uber’s revenue.
Not surprising, ride hailing is the biggest part of the business. In 2018, it brought in $9.1 billion, or 81% of the total revenue. This segment grew 33% since last year when it brought in $6.8 billion. Uber Eats had a more spectacular 2018, growing from $587 million in revenue to $1.4 billion, or +149%.
For 2018, Uber’s total revenue was $11.2 billion, up 42% from the $7.9 billion it brought in in 2017. Last year saw a significant revenue-growth slowdown for Uber, after it grew by 106% in 2017, jumping from $3.8 billion to $7.9 billion.
Though Uber is showing strong but slowing revenue growth, its top-line growth does not, unfortunately, translate into bottom-line growth. Uber is losing a lot of money.
It's ride-hailing competitor Lyft (NASDAQ:LYFT), which we covered last month ahead of its own IPO, had losses of $688 and $911 million in 2017 and 2018, respectively. Those numbers seem minimal compared to Uber’s operational losses of $4 billion and $3 billion in 2017 and 2018.
Of course, it's notable that for Uber, the ratio of net losses to revenue has shrunk from 51% to 26% in 2018. Still, Uber is very clear in its filing that the situation isn't about to get better anytime soon:
“We expect our operating expenses to increase significantly in the foreseeable future, and we may not achieve profitability.”
Bottom Line
Unfortunately for Uber, Lyft's recent IPO didn’t go very well. Lyft began trading at the end of March on the NASDAQ, opening at $87, only to fall more than 35% to its current price of $56.11 as of yesterday's close. Investors don't seem to be overly optimistic about the future of ride-hailing, which doesn't bode well for Uber's public listing.
Still, Uber has a significant advantage over Lyft which only operates in two countries. Uber's strong global presence includes significant operations in Europe, Russia, Asia, and the Middle East. Just last month, the company purchased Careem, a Middle Eastern rival, for $3.1 billion. Uber's food delivery service has also been a major growth engine in 2018, providing some revenue diversity.
As well, Uber’s revenue is more than five times that of Lyft’s, for a proportionally smaller bottom line loss. It's therefore in better shape than Lyft at this stage.
But if Lyft is currently valued at $17 billion and dropping, how much is Uber actually worth? Knowing what we currently do, $100 billion seems too high for a suitable entry point.
Nonetheless, in the equity market, high growth businesses have always enjoyed a premium price tag. Investors always become dissatisfied though when growth starts to slow and losses begin to pile up. Uber is dangerously close to hitting both these elements simultaneously.
