EIA crude oil inventory data was released yesterday, mirroring Tuesday's API data featuring dramatic draws when compared to the estimated builds that were widely expected. This has become a bit of a theme as the estimates for crude oil appear to have become harder to predict, with data consistently missing expectations by wide margins.
Yesterday’s estimate, for roughly a 3 million barrel build, was off by approximately 8 million barrels as the EIA showed a -4.937 million barrel draw in stocks for the week. Distillates and gasoline showed a modest build that was greater than expected. Additionally, crude oil imports were down nearly 500,000 barrels below the four week average.
While this data does give some clarity to the price discovery for the moment, it does very little to clear up the uncertainty that is ever apparent in the past several months of crude and refined products pricing. The market understands that the world is flush with crude products justifying the past several years' decline to the ‘new normal’ pricing that we are seeing today.
Therefore, the trade has become more nuanced as we attempt to parse through modest fundamental details in an effort to put together a picture that defines the true value for petro products in this climate (most of these have been highlighted so many times over the past several months yet remain important to the price going forward):
- Global supply shifts; i.e. the January freeze on output through OPEC and Russia in an effort to stabilize prices (keep in mind this is not a decline in daily production, just a short term commitment to not continue to raise production week to week).
- Once powerful oil producing nations coming back ‘online’ in recent months (increased Libyan production and the re-introduction of Iranian supplies to the market post sanctions).
- Stalling European and Chinese economies bringing ongoing demand into question.
- Global shifts in the upstream/downstream production and export scenarios (i.e. The Saudis continue to ramp up refining as they shift to exporting more refined petro products and less crude; Continued political pressure in the US in this pivotal election year to alter the export laws for raw crude, etc.).
- Sharp declines in petro values' harsh effect on those economies relying chiefly upon the production and sale of crude products at a significantly higher base line price (US frackers, Venezuela, African producers, Russia, etc.).
With all of these factors going into the daily price discovery, one can see why the volatility had first existed and why it now feels a bit like ‘no man’s land’ for the price of crude, as traders seem wary of over committing in either direction. Rumor and innuendo tend to drive the price more significantly, with the final actual fact tending to correct the overreach of the price discovery.
For example, when the Russian minister suggests that a meeting is in place with OPEC to discuss production decreases in an effort to support falling prices, the market reacts sharply to the bullish side. Yet when the facts become clear that not only are they not cutting production, they aren’t even meeting, then the market corrects, though usually not as far down as it had moved up.
This enables effected parties to continue to try and have an important effect on pricing through words and conjecture without actually having anything substantive to add. 
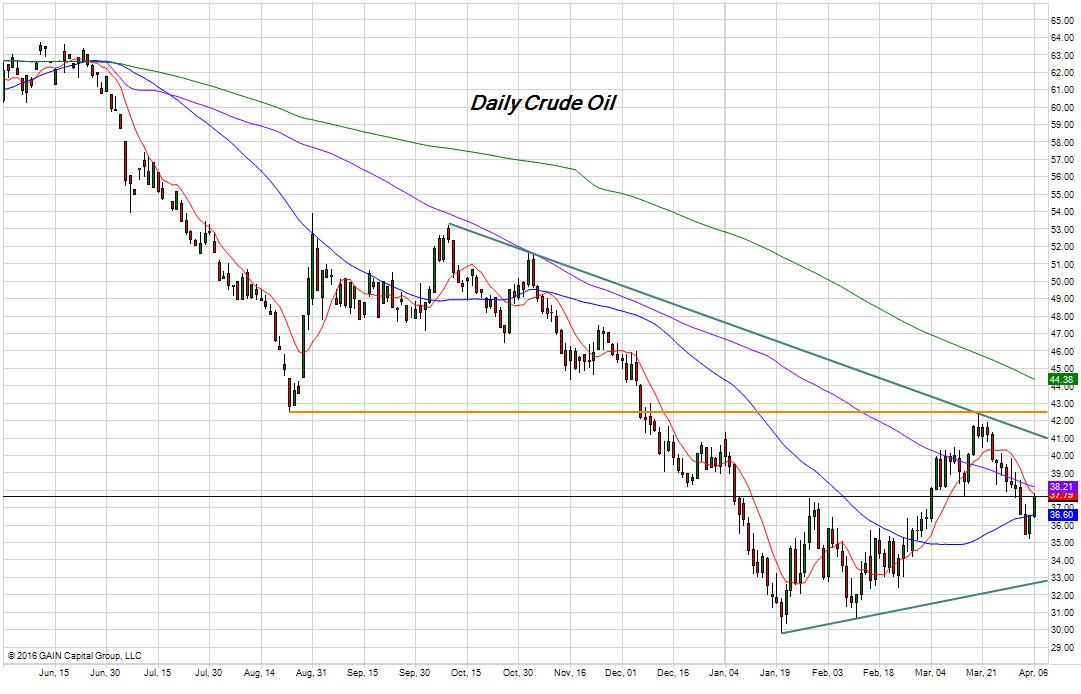
For those participants looking to capitalize on the indecision of the market in recent sessions, look at the current range as bulls and bears fight it out. The relatively muddy fundamental picture clears the way for the technicians to use the chart to trade more actively. Consider the chart above with the defined trend lines providing an ever-narrowing range that, for now, could be used to fade moves in either higher and or lower directions (currently about 41.00 on the higher side and 33.00 on the low side).
As those tend lines come closer to converging, be more wary of trading them as fades to price discovery and start to look toward a breakout one way or the other.
Disclosure: Trading commodity futures and options involves substantial risk of loss and may not be suitable for all investors.
