- Ahead of the inflation data tomorrow, the US dollar is trading sideways and hovering near three-month highs.
- The greenback is currently approaching a key resistance level and could break higher if CPI data surprises.
- In this piece, we will take a look at key levels to watch for those looking to trade the US dollar as data is released.
- In 2024, invest like the big funds from the comfort of your home with our AI-powered ProPicks stock selection tool. Learn more here>>
Markets are eagerly awaiting the first rate cut from the Fed, and all eyes will be on inflation data tomorrow.
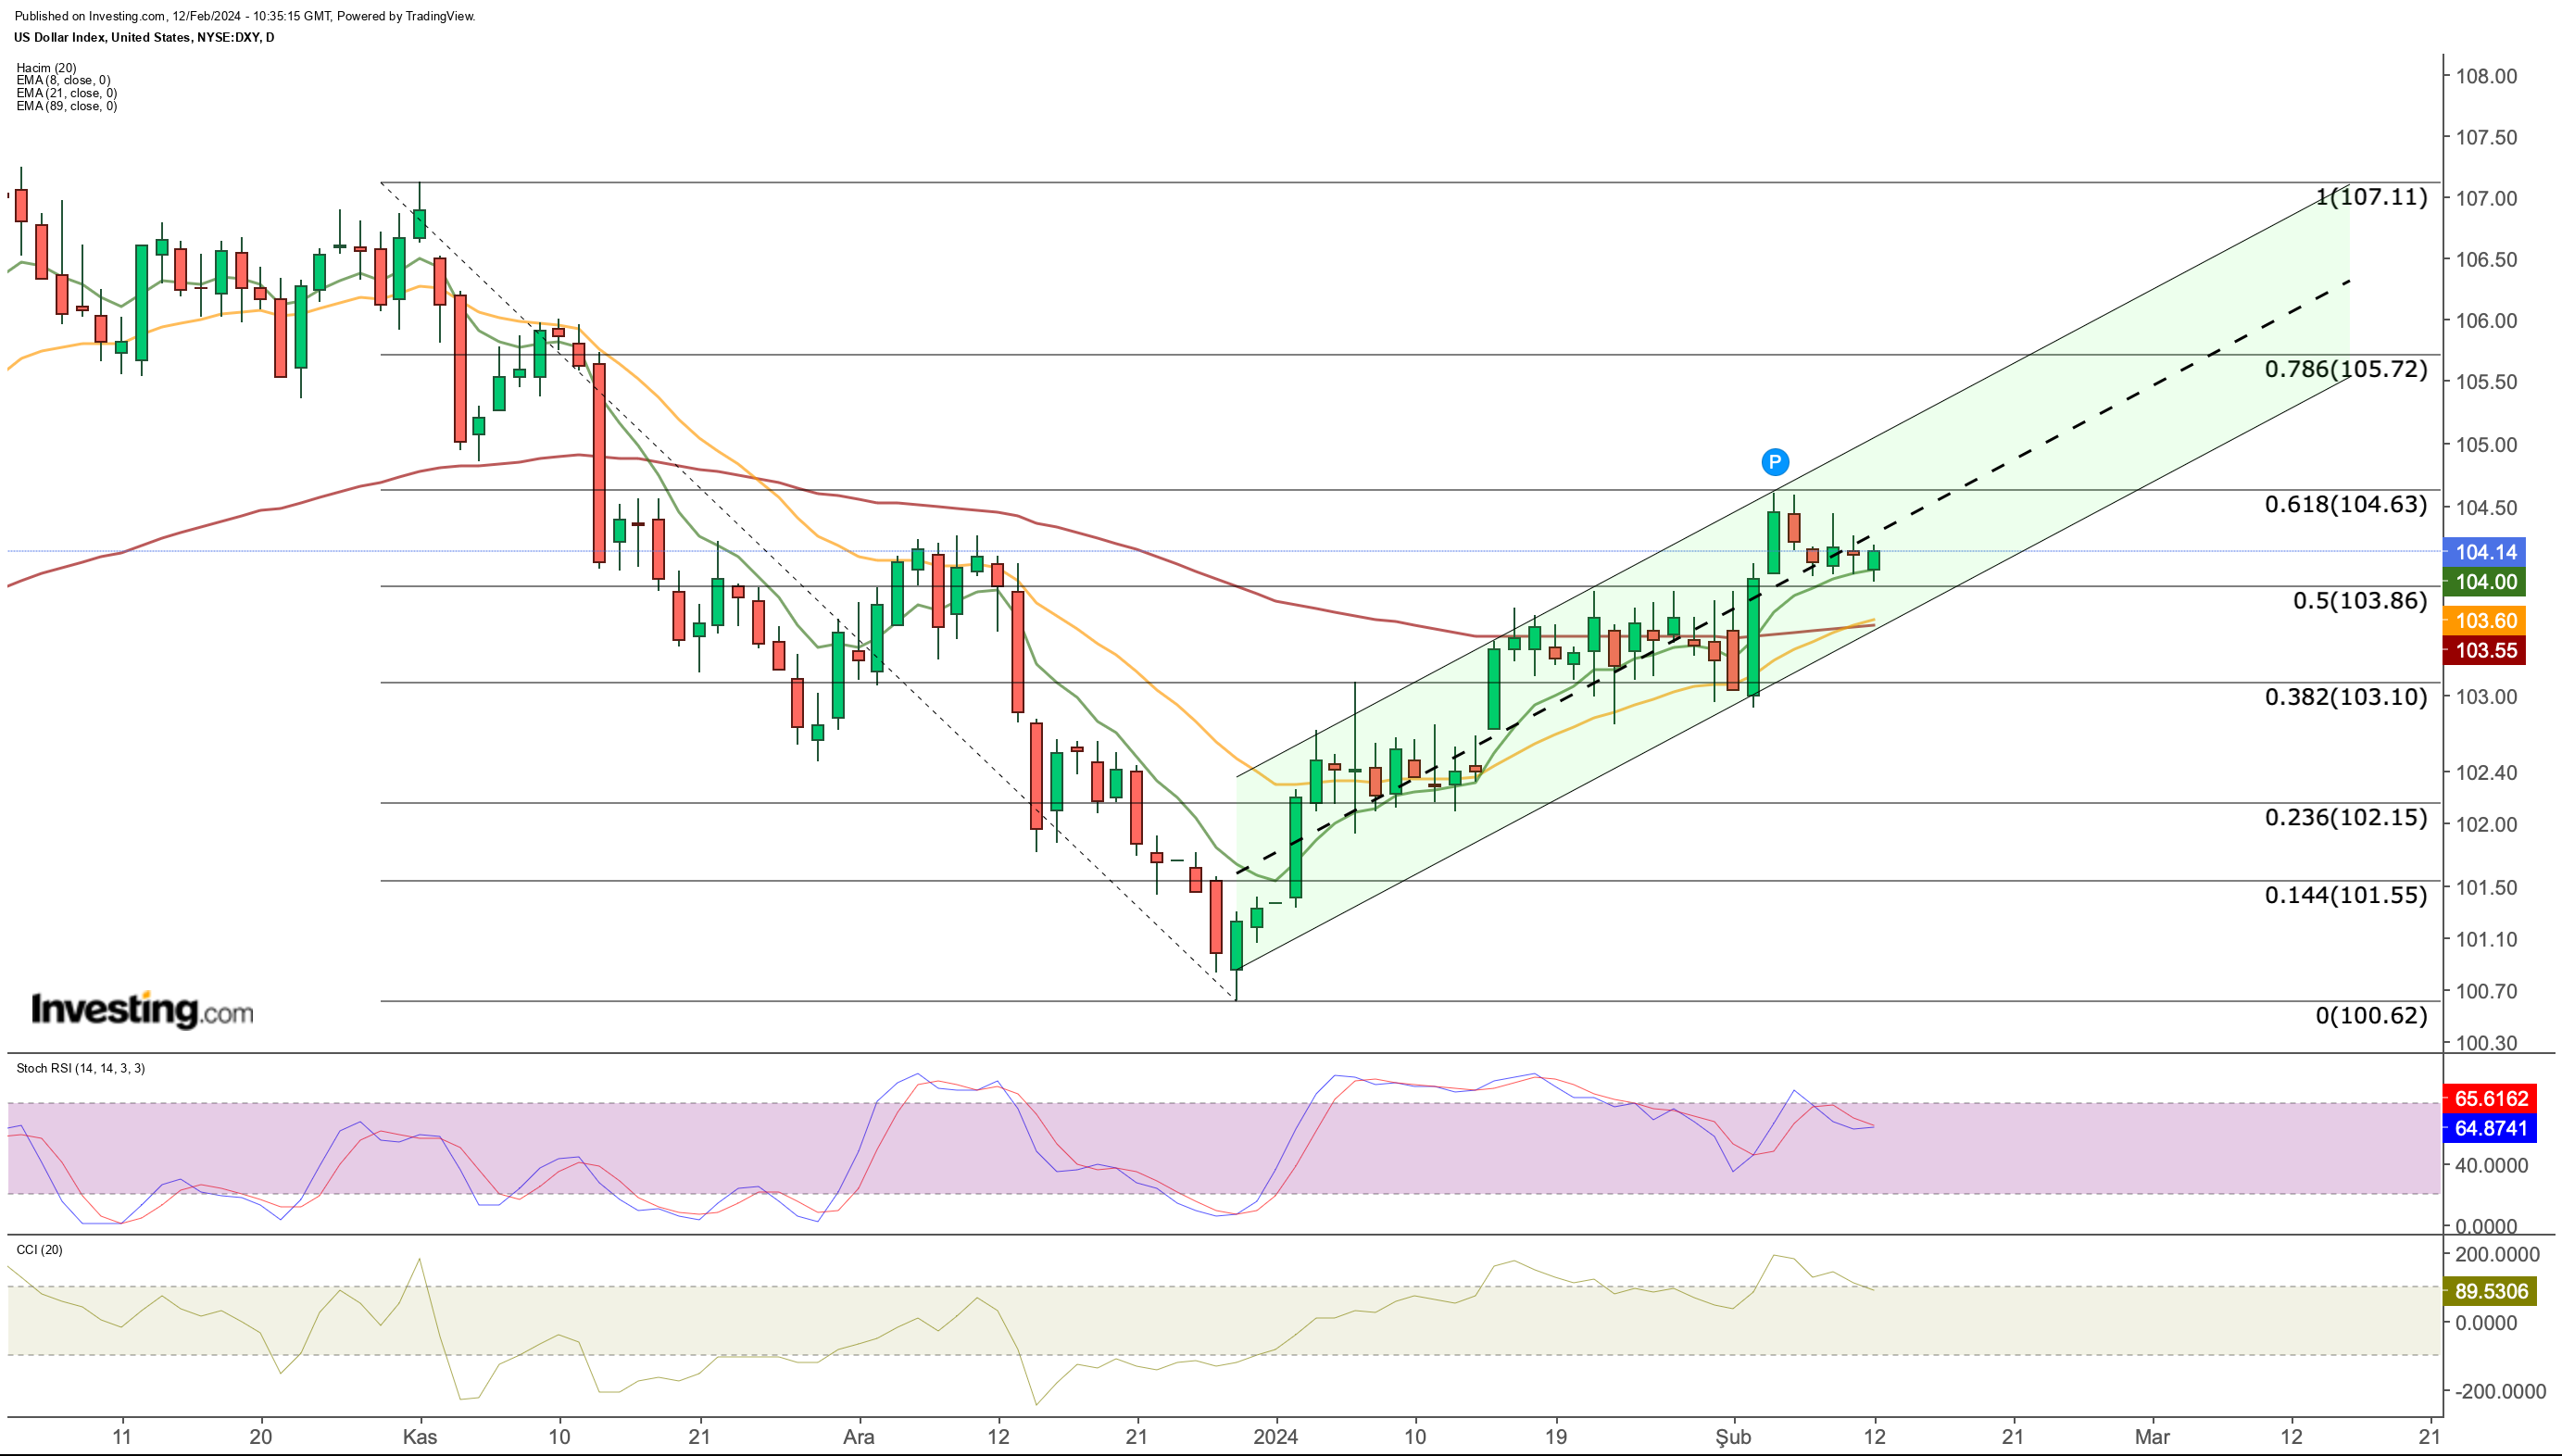
Ahead of the release, the US dollar has started the week trading sideways. Last week, the dollar index rose to 104.6, a level not seen since November, before pulling back to the 104 mark.
Despite this retreat, the greenback managed to sustain its position near the three-month highs, remaining within range of the critical resistance point.
However, the spike in 2-year and 10-year yields last week was a factor that partially supported the dollar.
Morgan Stanley Research analysts, on the other hand, once again mentioned the high correlation in their note on the relationship between the dollar and government bonds. They said that long-term bond auctions, especially 10 and 30-year bond auctions, tend to have an impact on the dollar.
The fact that the dollar currently offers higher real rates than major currencies and even some emerging markets continues to stand out as another factor that maintains its attractiveness.
On the other hand, although the Fed's extremely cautious stance on interest rate cuts supports the narrative that interest rates may remain high for much longer, the US dollar's slowly building momentum is noteworthy.
Macro View
The cautious increase in demand for the dollar may be repositioned with new positions to be taken with the inflation data.
Accordingly, if inflation data comes in below expectations, this will strengthen the markets' narrative that the Fed may cut interest rates earlier, and in this case, we may see a weakening in the dollar.
Otherwise, it is more likely that demand for the dollar could rise rapidly and break through its critical resistance.
Jerome Powell and other Fed members have recently downplayed the possibility of an early rate cut, emphasizing the need for additional data to make sure inflation in heading toward the central bank's target range.
The data release holds particular significance as it can directly influence the short-term outlook of the dollar. The moderate decline in inflation is a key factor that could lead to a decrease in the dollar.
Additionally, any signs of weakening in the labor force market are crucial. Strong employment data earlier in the month had almost ruled out an interest rate cut in March, contributing to the dollar's upward momentum.
Presently, markets are factoring in a rate cut in May, with tomorrow's data release playing a pivotal role in this pricing.
Technical View
The dollar index chart reveals gradual increases since the beginning of the year.

Finally, a bounce was seen with the employment data, which was almost double the expectations, and the DXY weakly tested the 104.6 level (fib 0.618).
This level could work as an important resistance point according to the recent downward momentum.
Since then, the DXY has partially eased and continues to use Fib 0.5 and 8-day EMA at 104 as support.
This week, a support line for the DXY may form up to 103.8, while the CPI coming in within expectations may cause a decline to 103.5.
This level is firm support with short-term EMAs and the bottom line of the rising channel.
If the idea that January CPI alone will not be convincing for the Fed's decision and that labor data should also be seen, DXY may manage to hold at 103.5 levels in a possible pullback.
On the other hand, it is very possible to see a jump in the DXY after a higher-than-expected inflation.
This may support the dollar index to break the resistance at 104.6 decisively and move quickly towards Fib 0.786 and the upper band of the channel at 105.7.
EUR/USD Key Levels to Watch
EUR/USD slowed its depreciation against the US dollar, which has been continuing since the beginning of the year, last week.
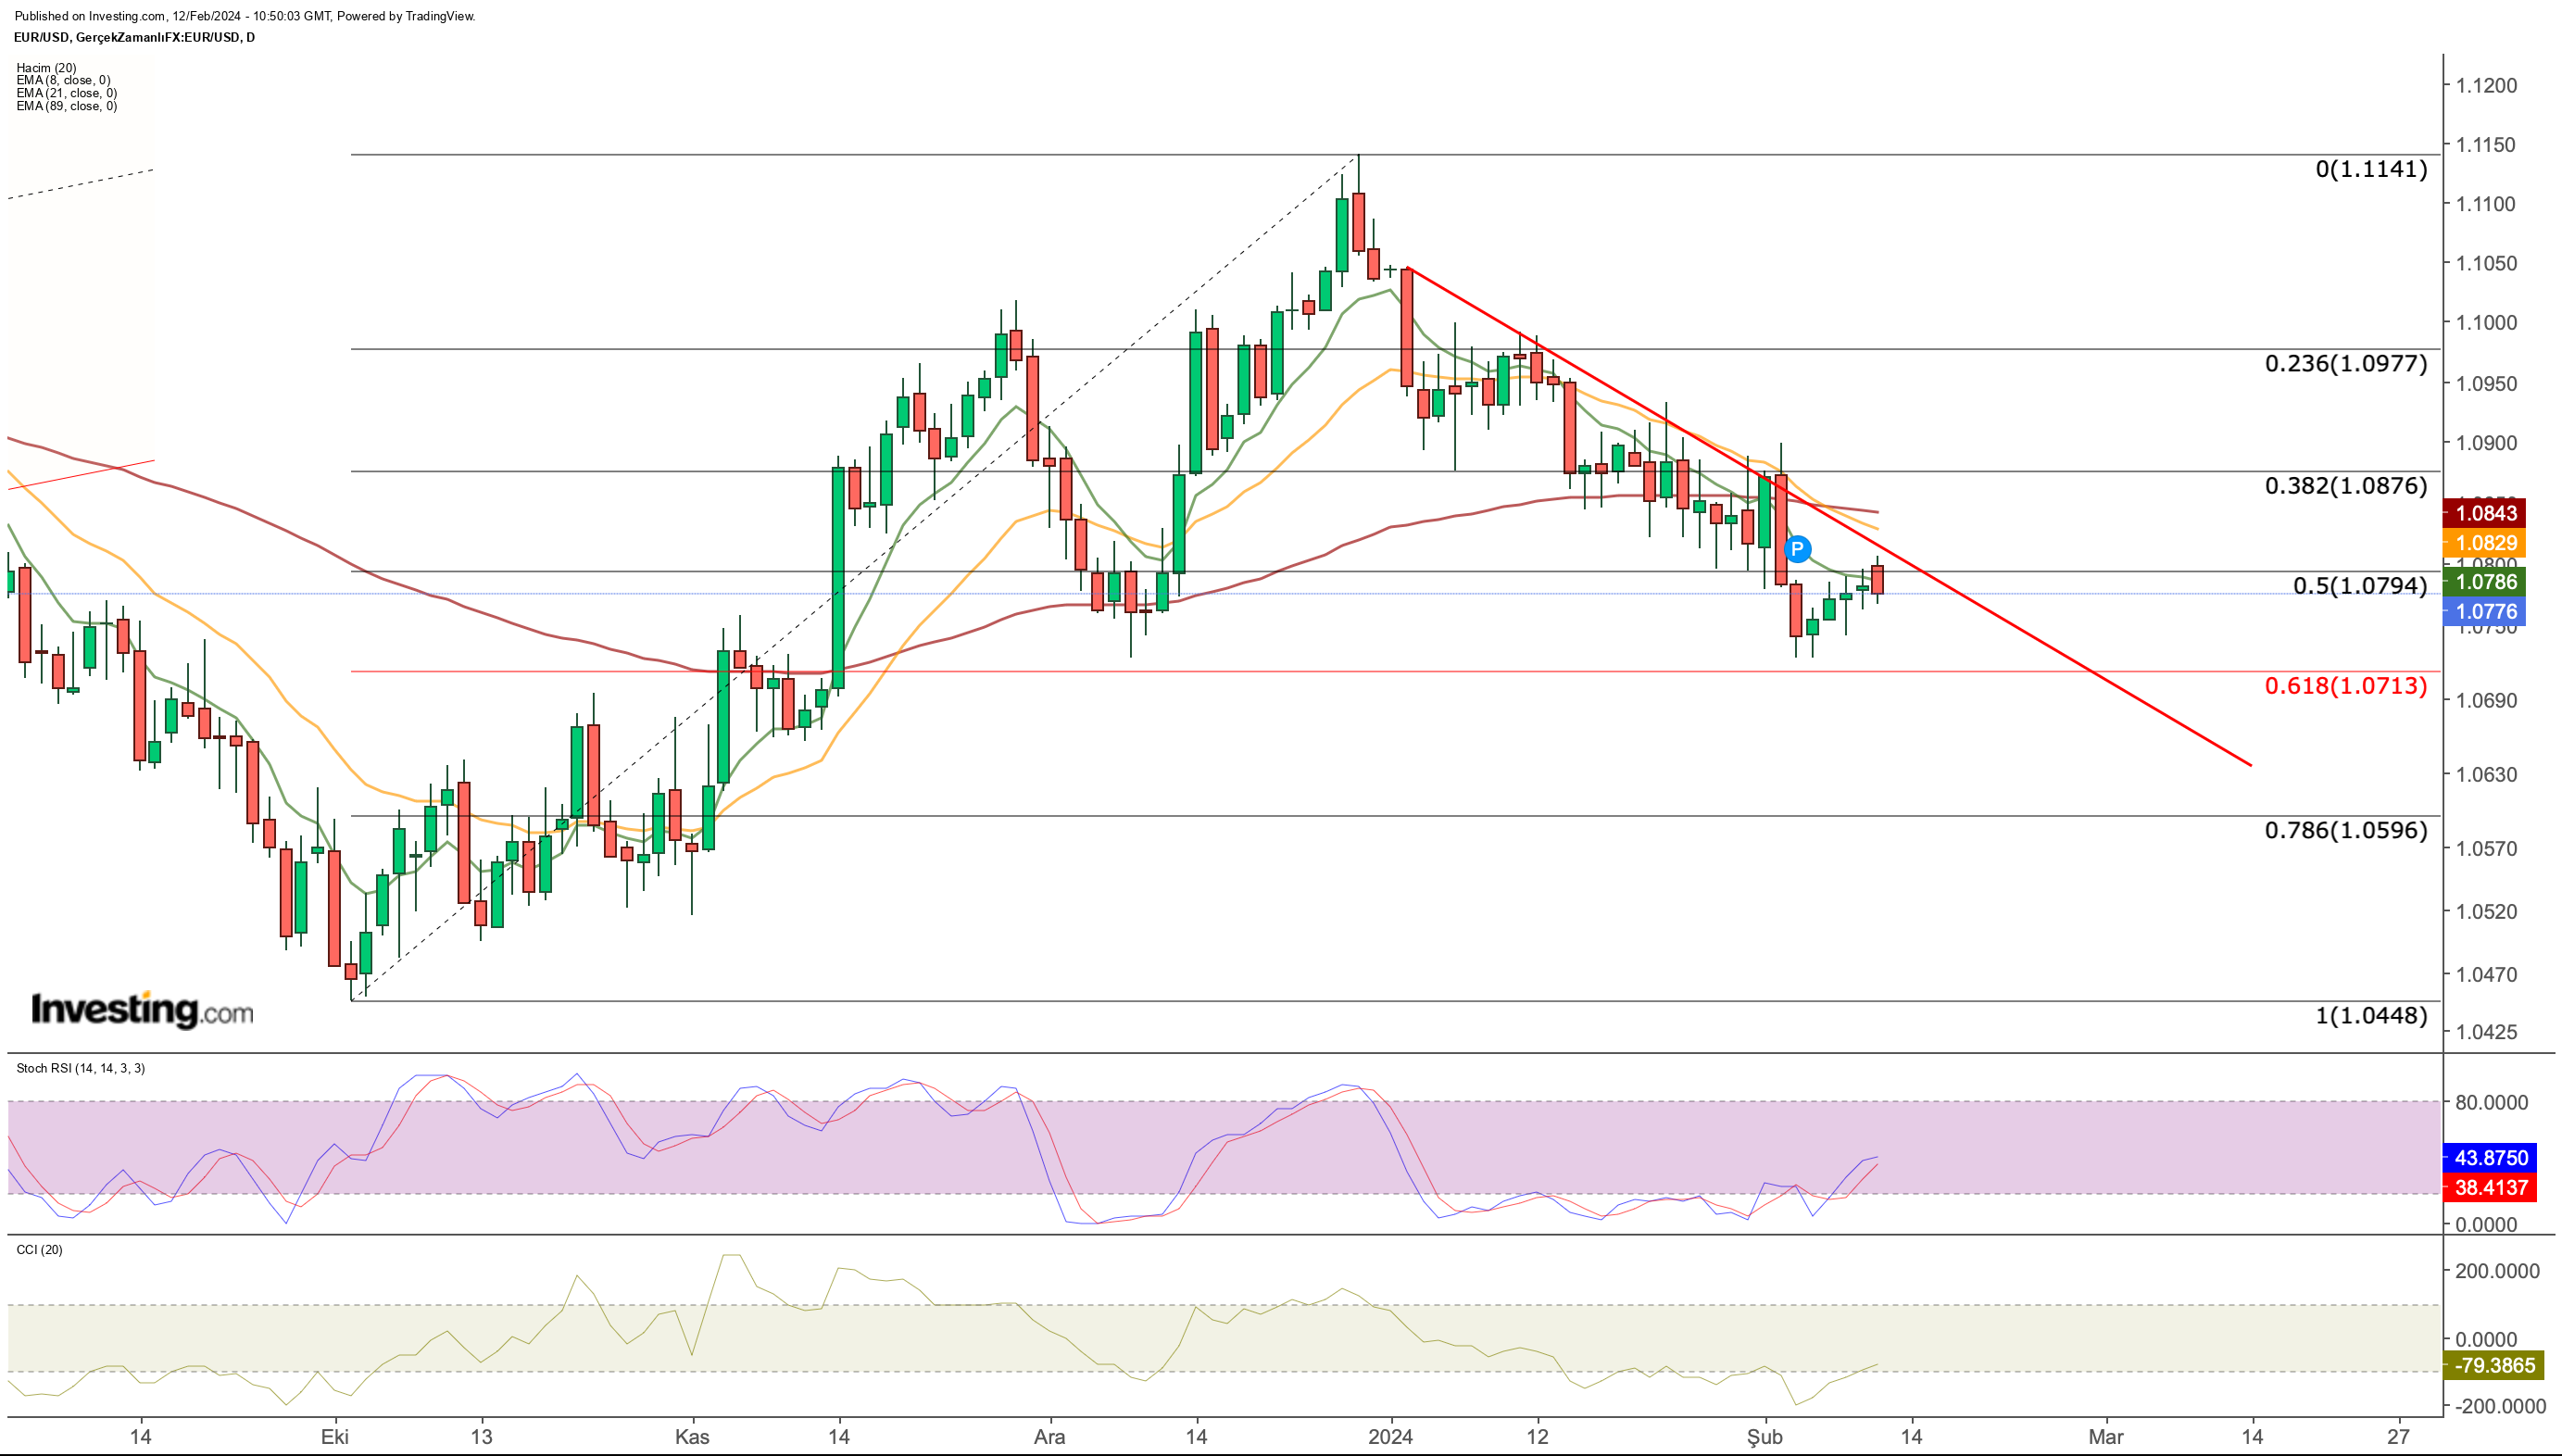
EUR/USD, which fell as low as 1.072 last week, closed the week at 1.078 appearing to stabilize.
The rhetoric that the ECB may start cutting interest rates earlier than the Fed is gaining weight, and there are some statements from the ECB wing to support this interpretation.
This continues to keep the euro under pressure against the dollar while supporting the strong dollar. Mid-week last week, the Eurozone's Q4 economic growth data may increase the volatility in the pair.
However, we can mention that the US inflation data to be announced beforehand may remain more dominant in the direction of EUR/USD.
Looking at the daily EUR/USD chart, the movement of the bearish momentum in the last swing towards the ideal correction rate Fib 0.618 stands out.
While rapid reaction buying is coming from this area, the average level of 1.08 remains valid as a critical resistance.
If EUR/USD fails to recapture the 1.08 level this week, we may see a stronger move towards 1.07 with selling pressure.
While the negative outlook for the euro remains valid at the moment, below 1.07, it may become possible to see a decline to the 1.06 border after the weak support in the 1.066 region.
On the other hand, if a floor above 1.08 is formed, weekly closes above 1.088 can be expected for a possible recovery in the euro.
***
Take your investing game to the next level in 2024 with ProPicks
Institutions and billionaire investors worldwide are already well ahead of the game when it comes to AI-powered investing, extensively using, customizing, and developing it to bulk up their returns and minimize losses.
Now, InvestingPro users can do just the same from the comfort of their own homes with our new flagship AI-powered stock-picking tool: ProPicks.
With our six strategies, including the flagship "Tech Titans," which outperformed the market by a lofty 1,183% over the last decade, investors have the best selection of stocks in the market at the tip of their fingers every month.
Subscribe here and never miss a bull market again!
Don't forget your free gift! Use coupon code OAPRO1 at checkout for a 10% discount on the Pro yearly plan, and OAPRO2 for an extra 10% discount on the by-yearly plan.
Disclaimer: This article is written for informational purposes only; it does not constitute a solicitation, offer, advice, or recommendation to invest as such it is not intended to incentivize the purchase of assets in any way. I would like to remind you that any type of asset, is evaluated from multiple points of view and is highly risky and therefore, any investment decision and the associated risk remains with the investor.


