- US dollar has continued to gain ground after taking a breather on the weekend
- Meanwhile, both crude oil and gold have experienced minor corrections following their significant surges
- Another price surge remains in the cards US dollar, oil and gold as geopolitical turmoil escalates in the Mideast
In the lead-up to last week, the US Dollar Index experienced some weakening as the Federal Reserve adopted a more dovish stance. This trend coincided with escalating geopolitical risks in the Middle East, which were expected to intensify over the weekend.
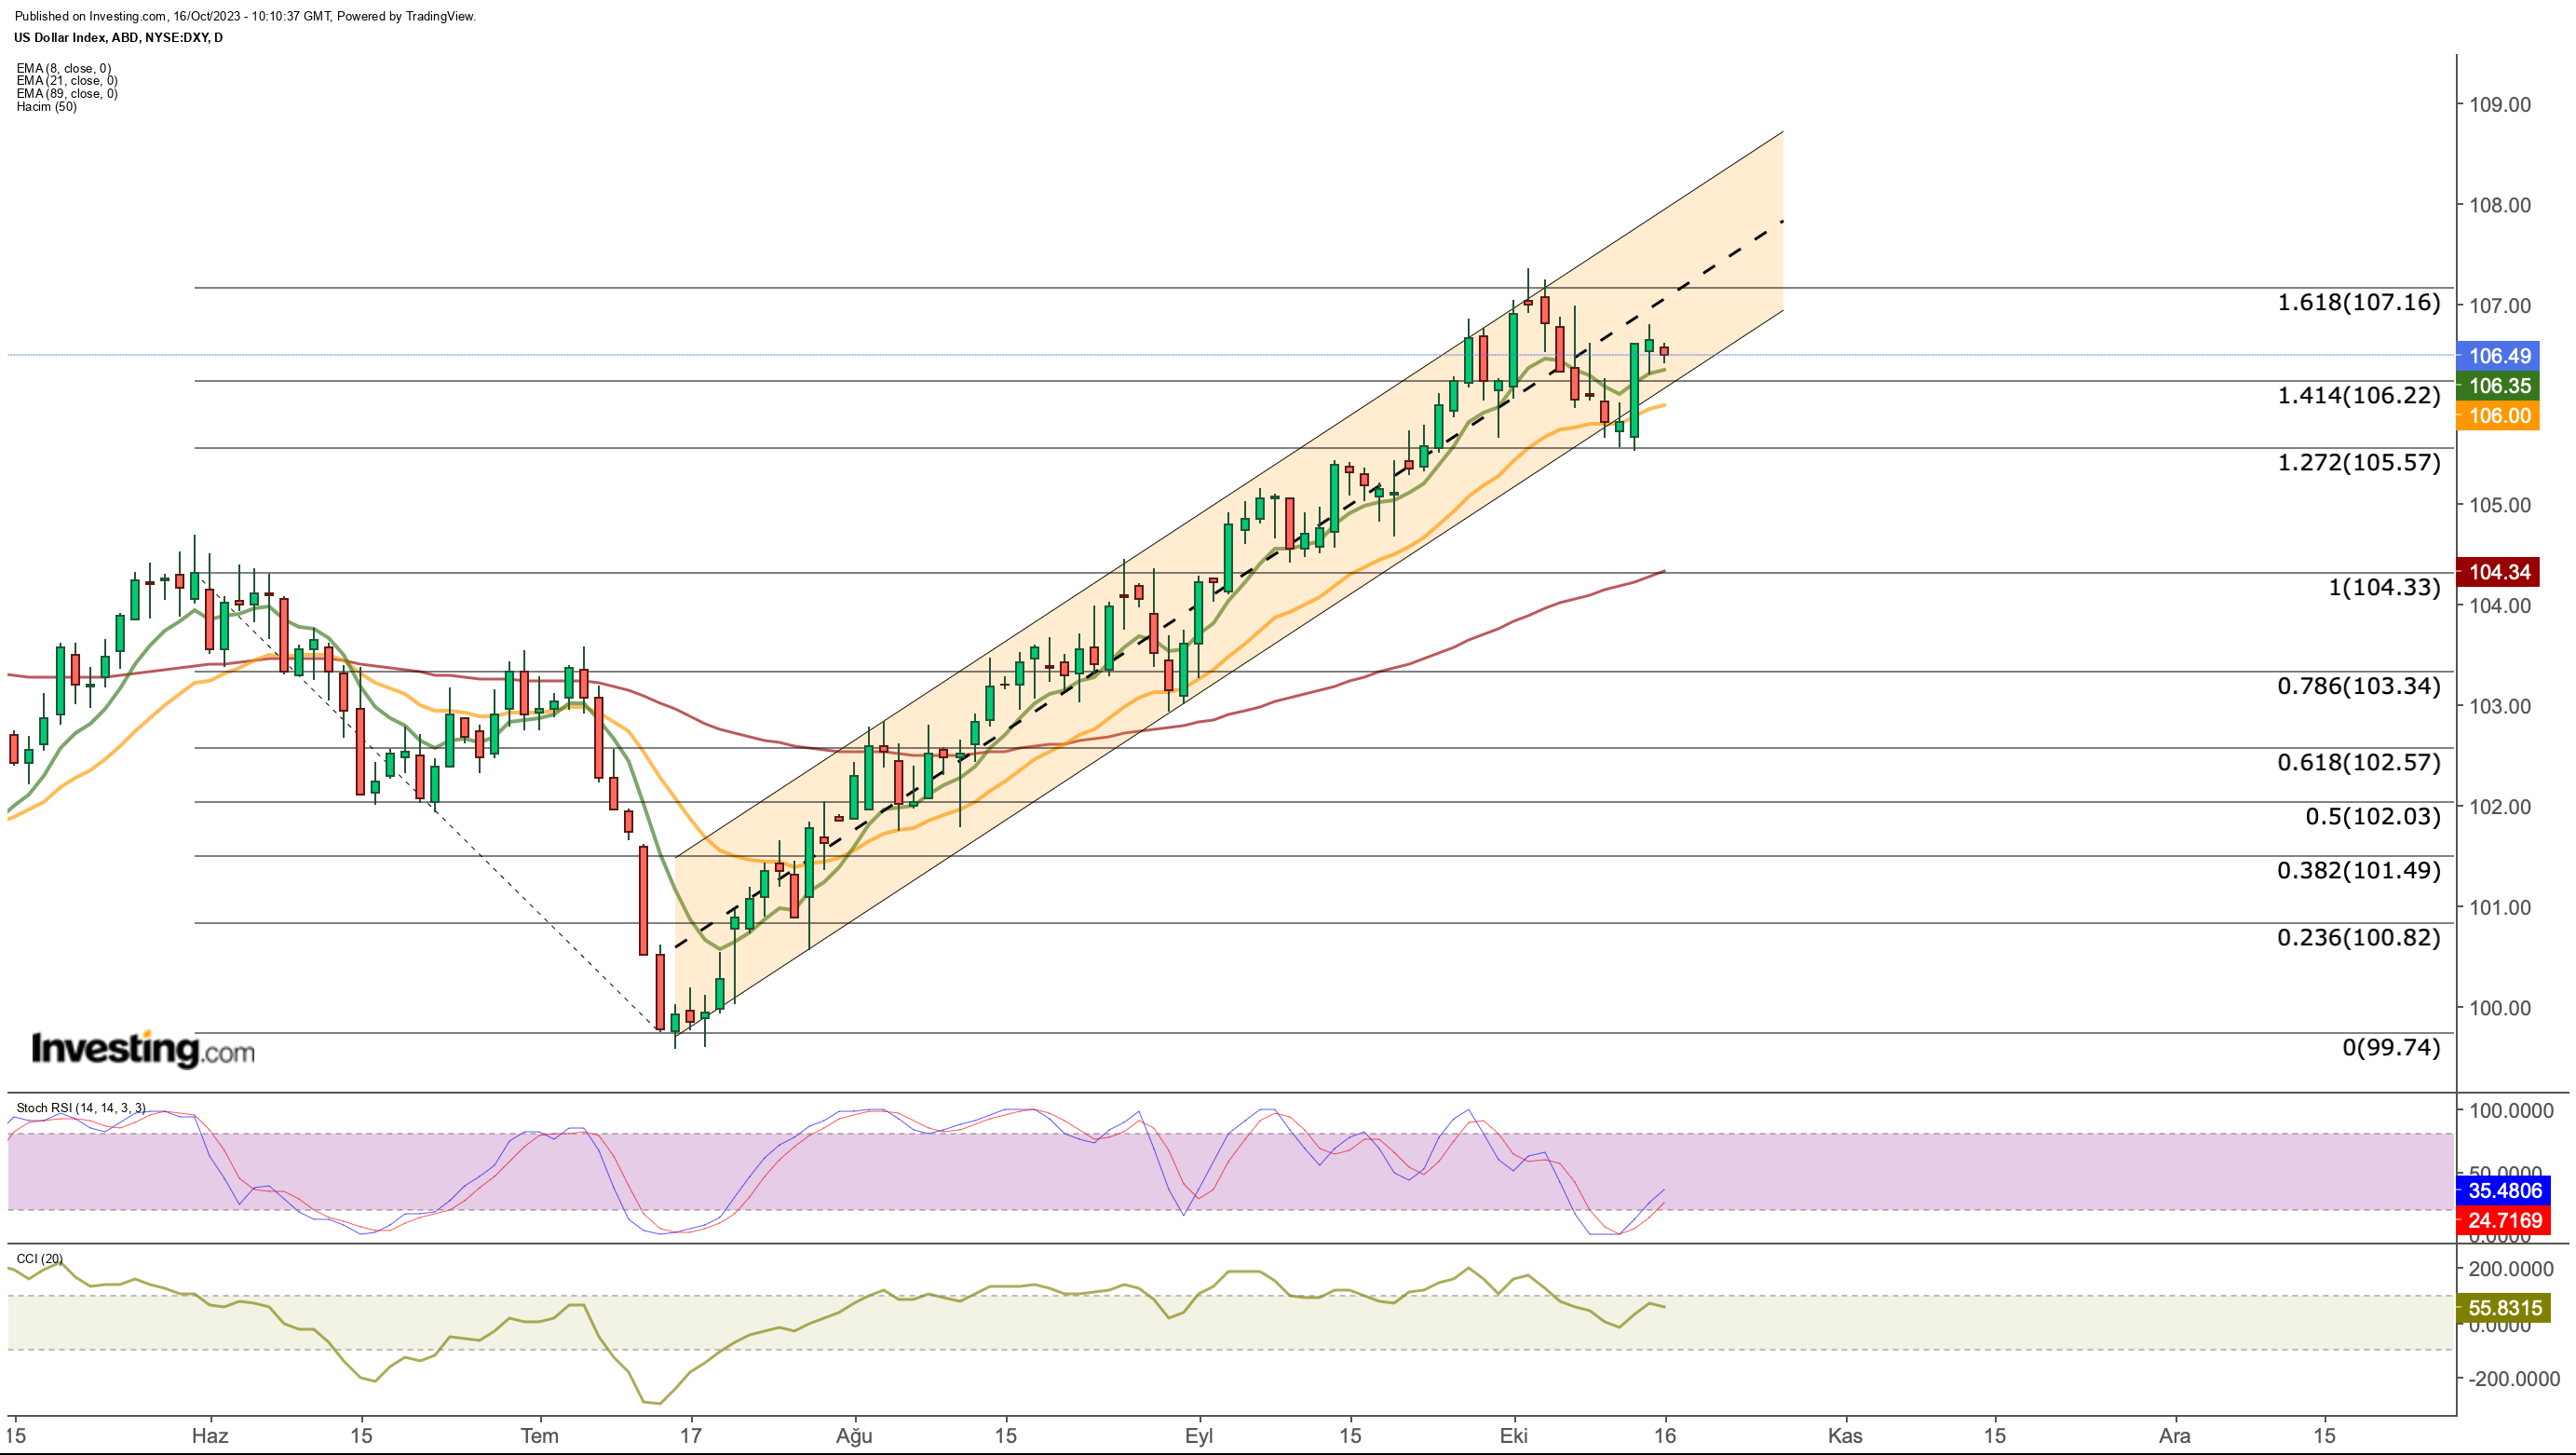
However, the US dollar has since undergone a corrective phase, retreating to 105.5 after reaching new yearly highs in early October.
As we kick off the new week, the dollar is trading around the 106.4 mark, demonstrating a somewhat bearish horizontal trend. This shift comes as the anticipated ground operation in the Middle East failed to materialize over the weekend, and diplomatic efforts took center stage.
While the postponement of the operation was attributed to weather conditions, ongoing concerns about the region persist.
It's worth noting that the Middle East issue may not be fully reflected in the broader market, and any expansion of conflicts to new regions could potentially trigger negative trends on a global scale.
This is further underscored by substantial increases in oil and gold prices observed on the last business day of the previous week, which may serve as an early warning of such developments.  A technical analysis of the index of the dollar against 6 major currencies shows that the upward trend remained intact despite the correction that lasted until the middle of last week.
The index, which attempted to sag from the lower band of the rising channel last week, found support again at the average 21-day EMA. This average value had also worked as dynamic support in the previous short correction in August.
Currently, 106.35 (8-EMA) is the closest support point for the DXY. Just below it, the 106 level appears as a more critical support to prevent the decline from expanding. In a possible correction, the 104 level (89-EMA) may come up as the main support.
However, while last week's jump indicates that there will be an increase in dollar demand in case of increased tension, technically there are some signals that the upward trend may continue.
For example, on the daily chart, the Stochastic RSI indicator has turned back up after pointing to oversold conditions in the short term. Short-term EMA values also remain bullish.
Accordingly, 107 for the DXY can be followed as the first resistance as it coincides with the midline of the ascending channel. Then, we may see that the new peak of the year may occur in the 108 band.
Apart from geopolitical developments that may have a direct impact on the trend this week, US retail sales and Fed Chairman Powell's speech will be among the prominent economic developments.
What Powell will say has become more important, especially after the lower-toned views from Fed officials last week. In addition, CPI data to be announced in the Eurozone is also among the important data of the week.
Gold, Oil Aggressively Price In Geopolitical Risks
With the start of conflicts in the Middle East, the direction of gold and oil turned upwards quickly, while the upward momentum accelerated after the deadline for ground operations was given on Friday.
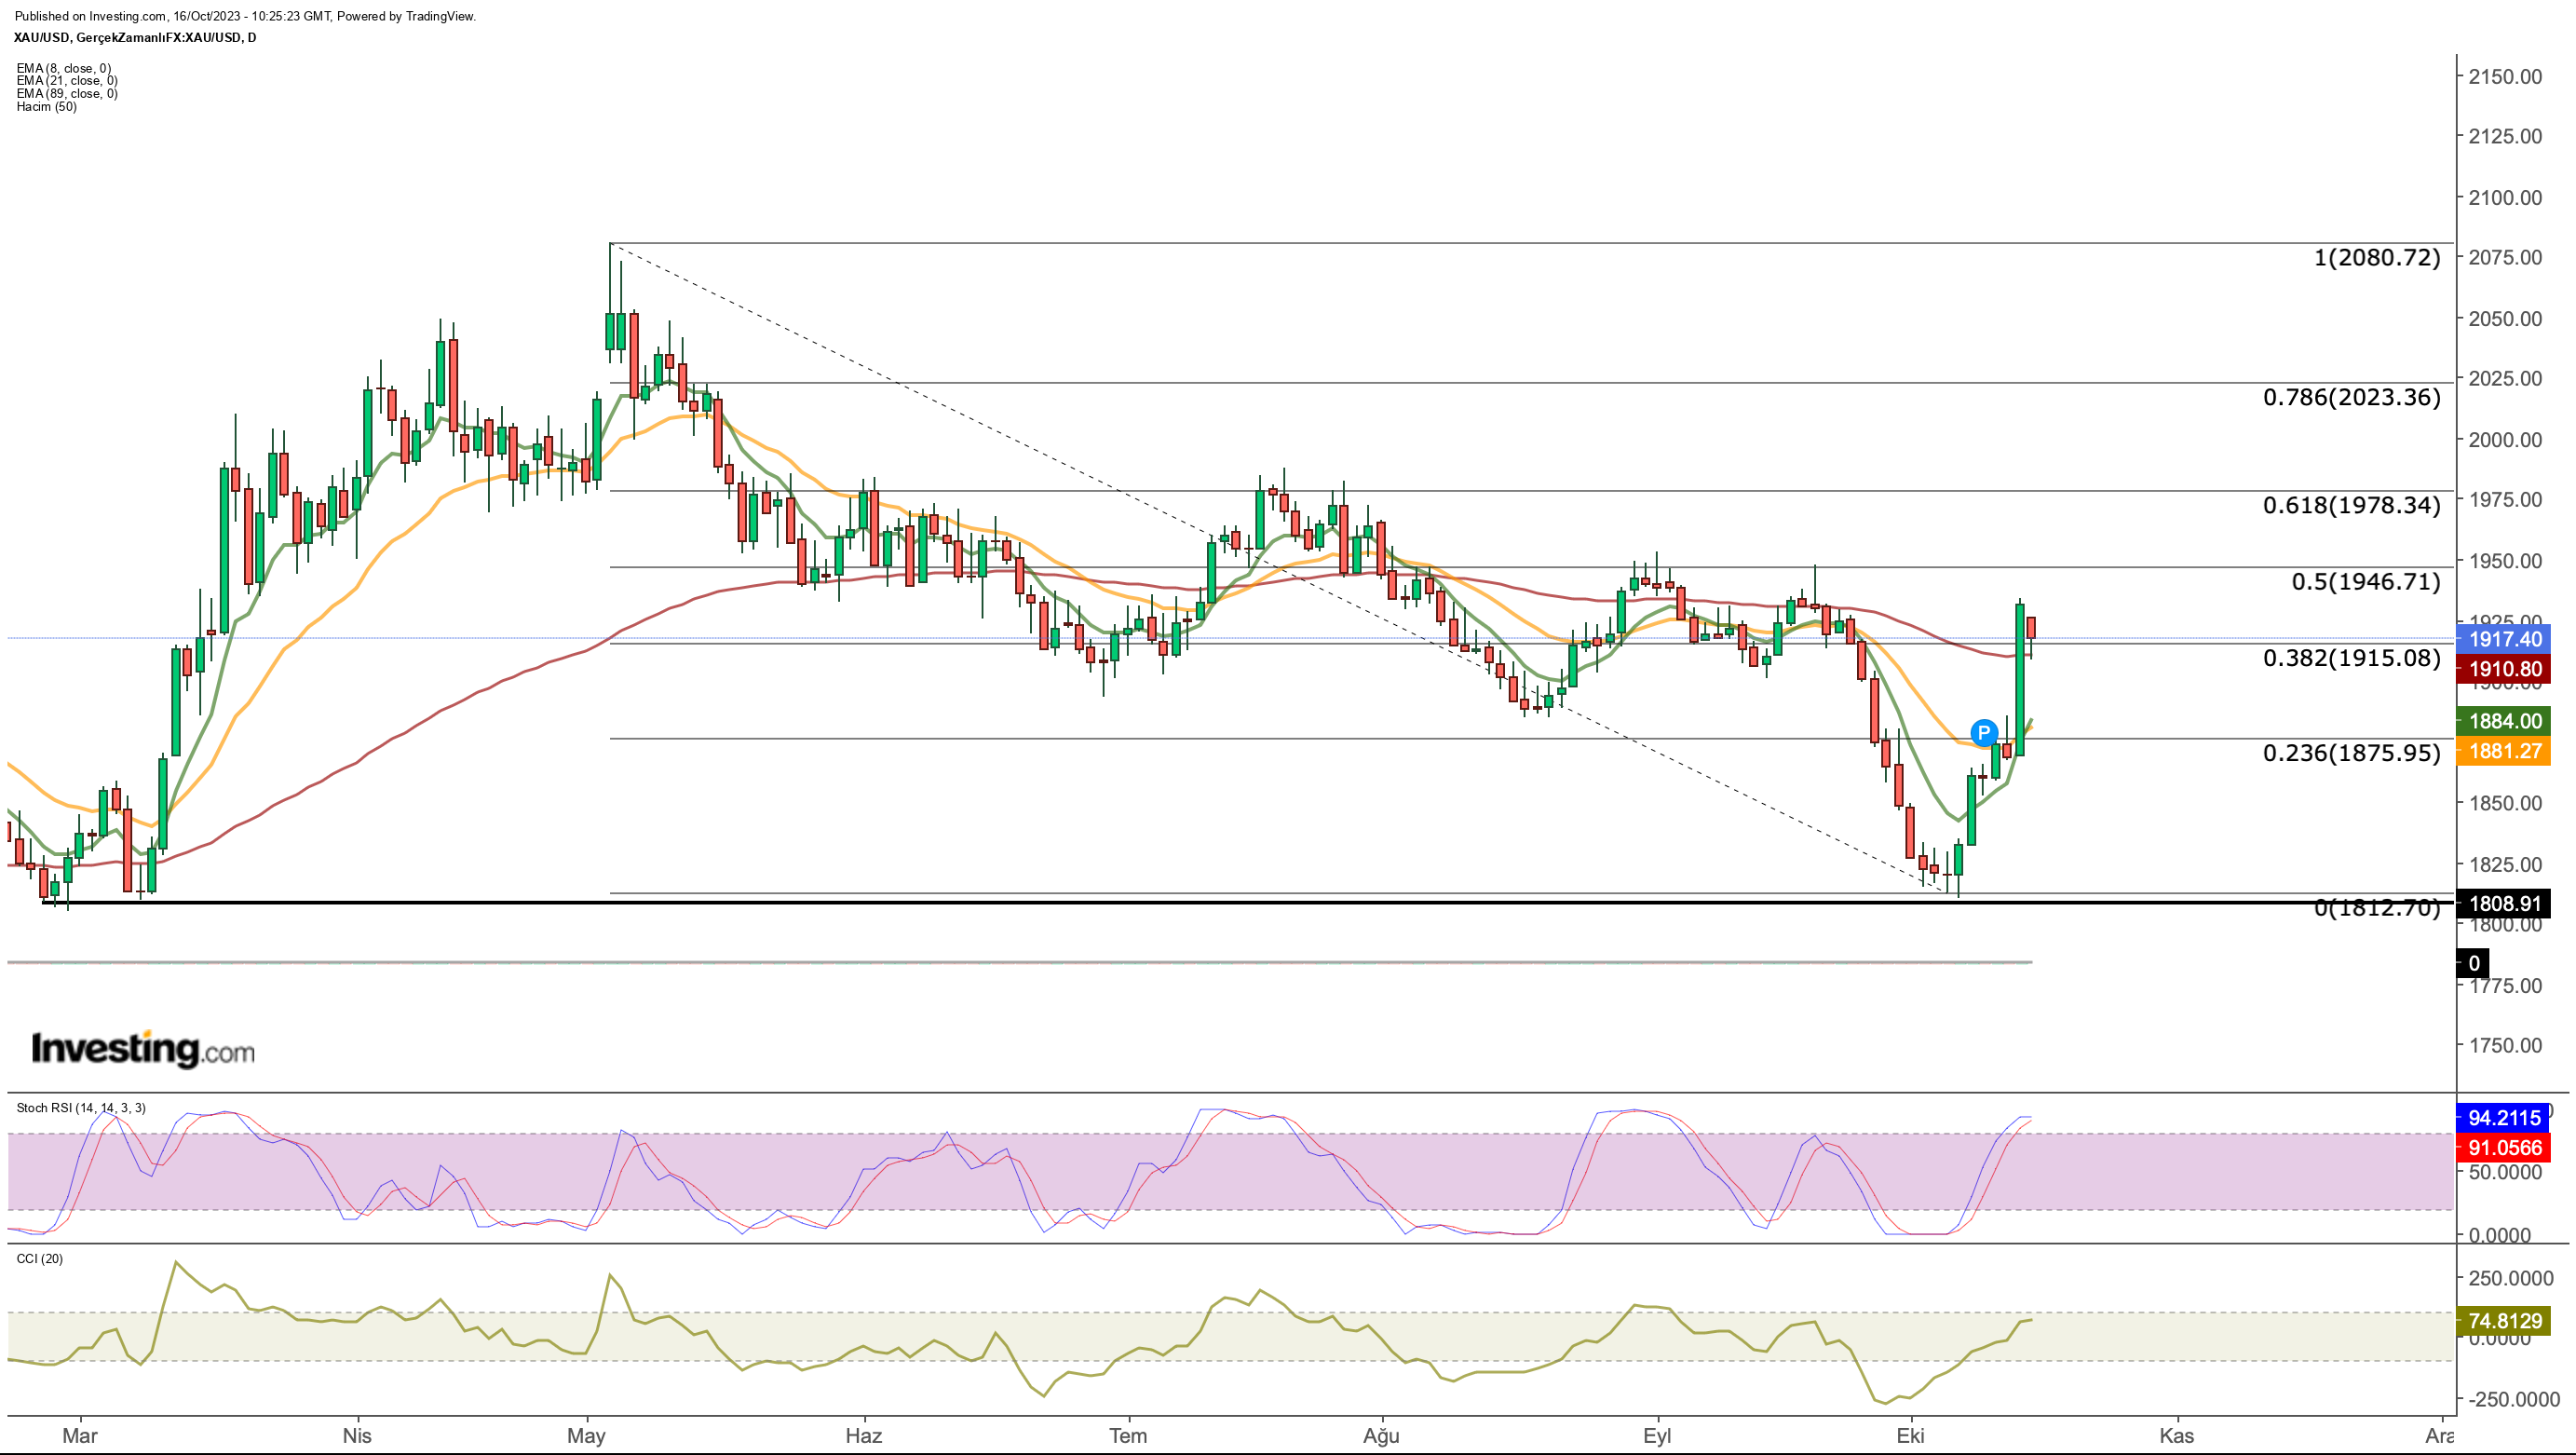
While gold took on the role of a safe haven again in an environment of increased risk in global markets, it started to be in demand quickly from the low of $1,810 at the beginning of the month.
Gold, which is at $1,910 today, thus recorded a 5% increase in value in 6 trading days.
Gold, which recorded an aggressive rise of close to 3.5% on Friday, thus compensated for the decline that started on September 20.
The gold market, which started the week with a slight decline after the last daily value increase, was influenced by the fact that the operation did not start at the weekend and the tension eased to some extent.
However, as the news flow from the region continues in a negative direction, it can be said that the retreat seen in gold today remains limited.
Gold, which started to move largely according to geopolitical developments, started to be priced above a critical resistance level corresponding to $1,915 (Fib 0.382) as of last week, according to the last downward momentum that started in May. Today, this price level has been retested.
Short-term price movements, on the other hand, showed that the average of $ 1,950 constituted an intermediate resistance for gold. Accordingly, this week, we may see moves towards $ 1,950 in upward attacks, depending on gold turning the $1,915 level into support.
If this region is exceeded, the price of $1,980, which is a harder resistance point, may come to the agenda. If the upward trend continues, the range of $2,020 - $ 2,080 is likely to come to the agenda.
While the current developments and technical outlook signal that the trend may continue, a retreat to an average of $1,880 below $1,915 in the lower zone can be considered reasonable.
Oil Surges Once Again: Could the Price Climb Continue?
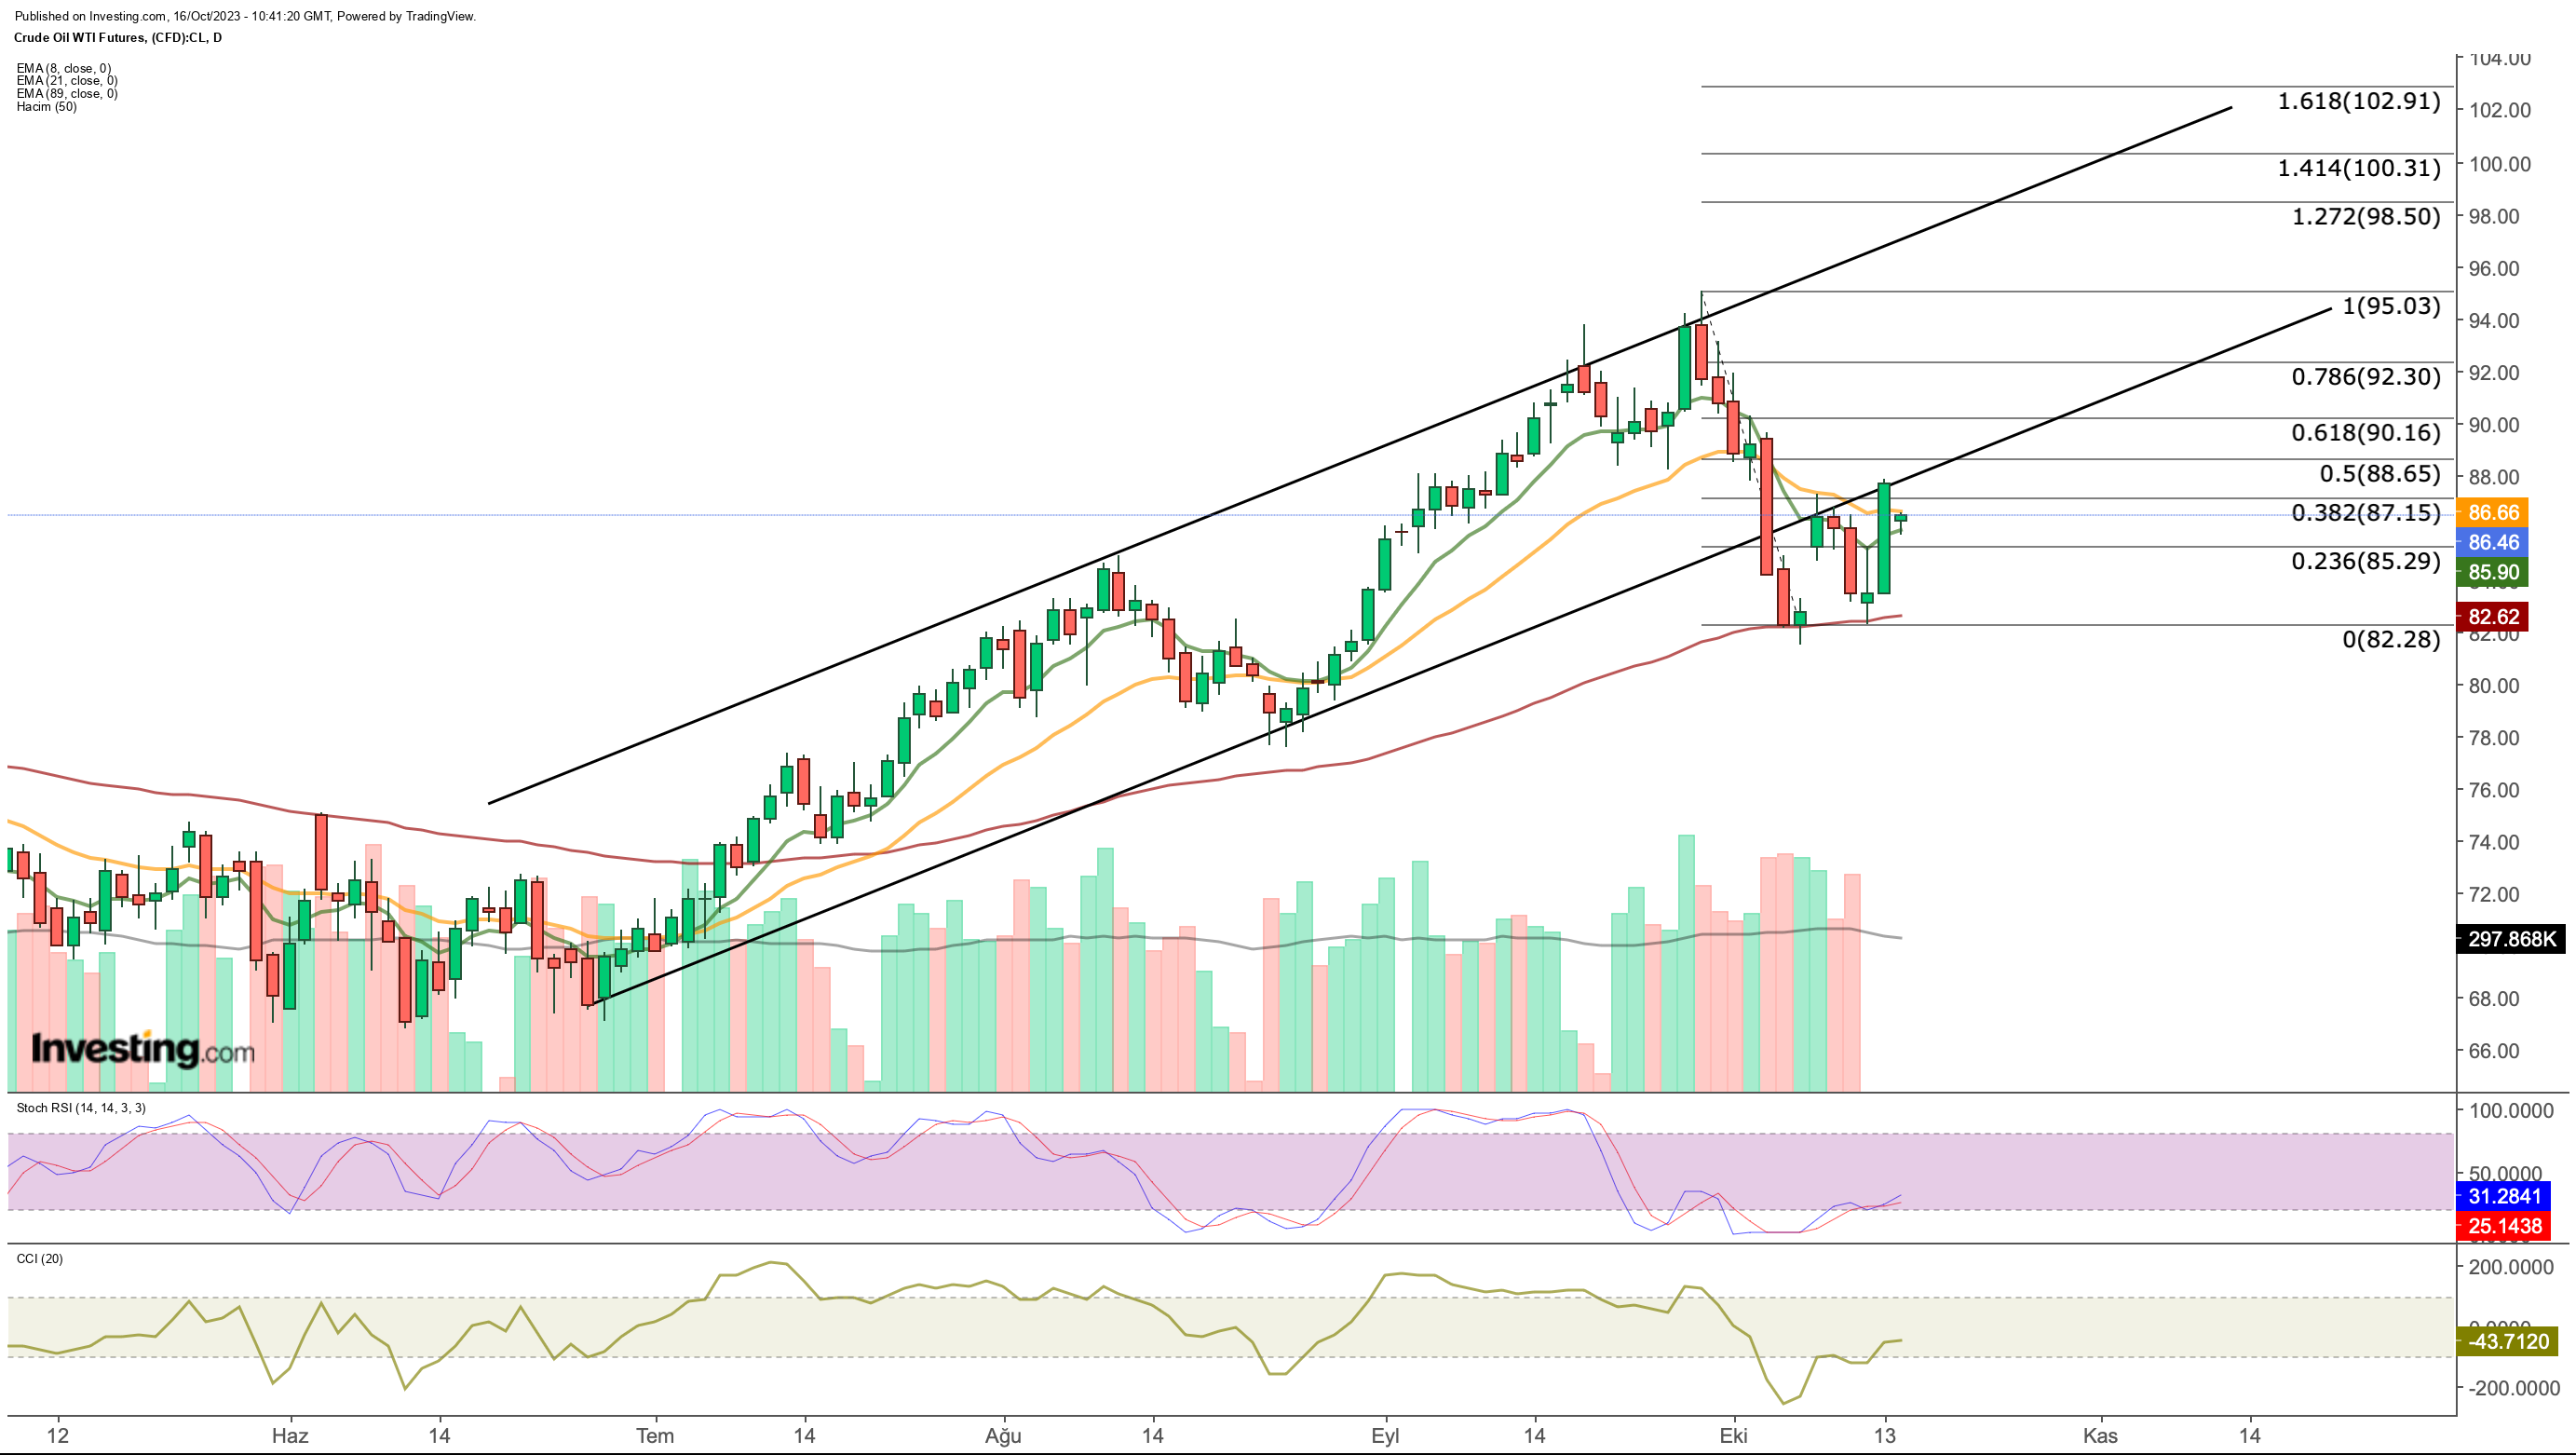
Oil, which increased its volatility with the start of conflicts in the Middle East, rose sharply by up to 5% on Friday, reaching the $87 band, amid expectations that tensions would peak at the weekend.
Oil, which opened with a gap after the start of the conflicts last week, moved mostly with sellers during the week and loosened up to $ 82.
On the other hand, oil, which rose up to 95 dollars with the decision of Russia and the UAE to cut oil demand, then entered a downward trend with the increase in discourses that demand would remain low. 
Over the past week, the oil market has displayed a mixed outlook, influenced by the ongoing war economy. Despite these factors, a prevailing upward trend is evident from a technical perspective.
Notably, oil futures are currently finding support near the $85.9 level after beginning the week with a slight retreat. If this support level holds, there's a possibility that oil prices may revisit the peak observed on the previous Friday, near $88.
Subsequently, the trend could extend toward the $92 to $95 range in the short term. In the event of a downturn, $82 serves as the primary support level for oil.
However, it's important to consider that the initiation of new conflict fronts in the region could lead to a rapid increase in oil prices, potentially pushing them to establish a new annual peak within the range of $98 to $102.
***
Disclaimer: The author does not own any of these shares. This content, which is prepared for purely educational purposes, cannot be considered investment advice.

