- Odds are firmly against the bulls, as US dollar keeps heading lower.
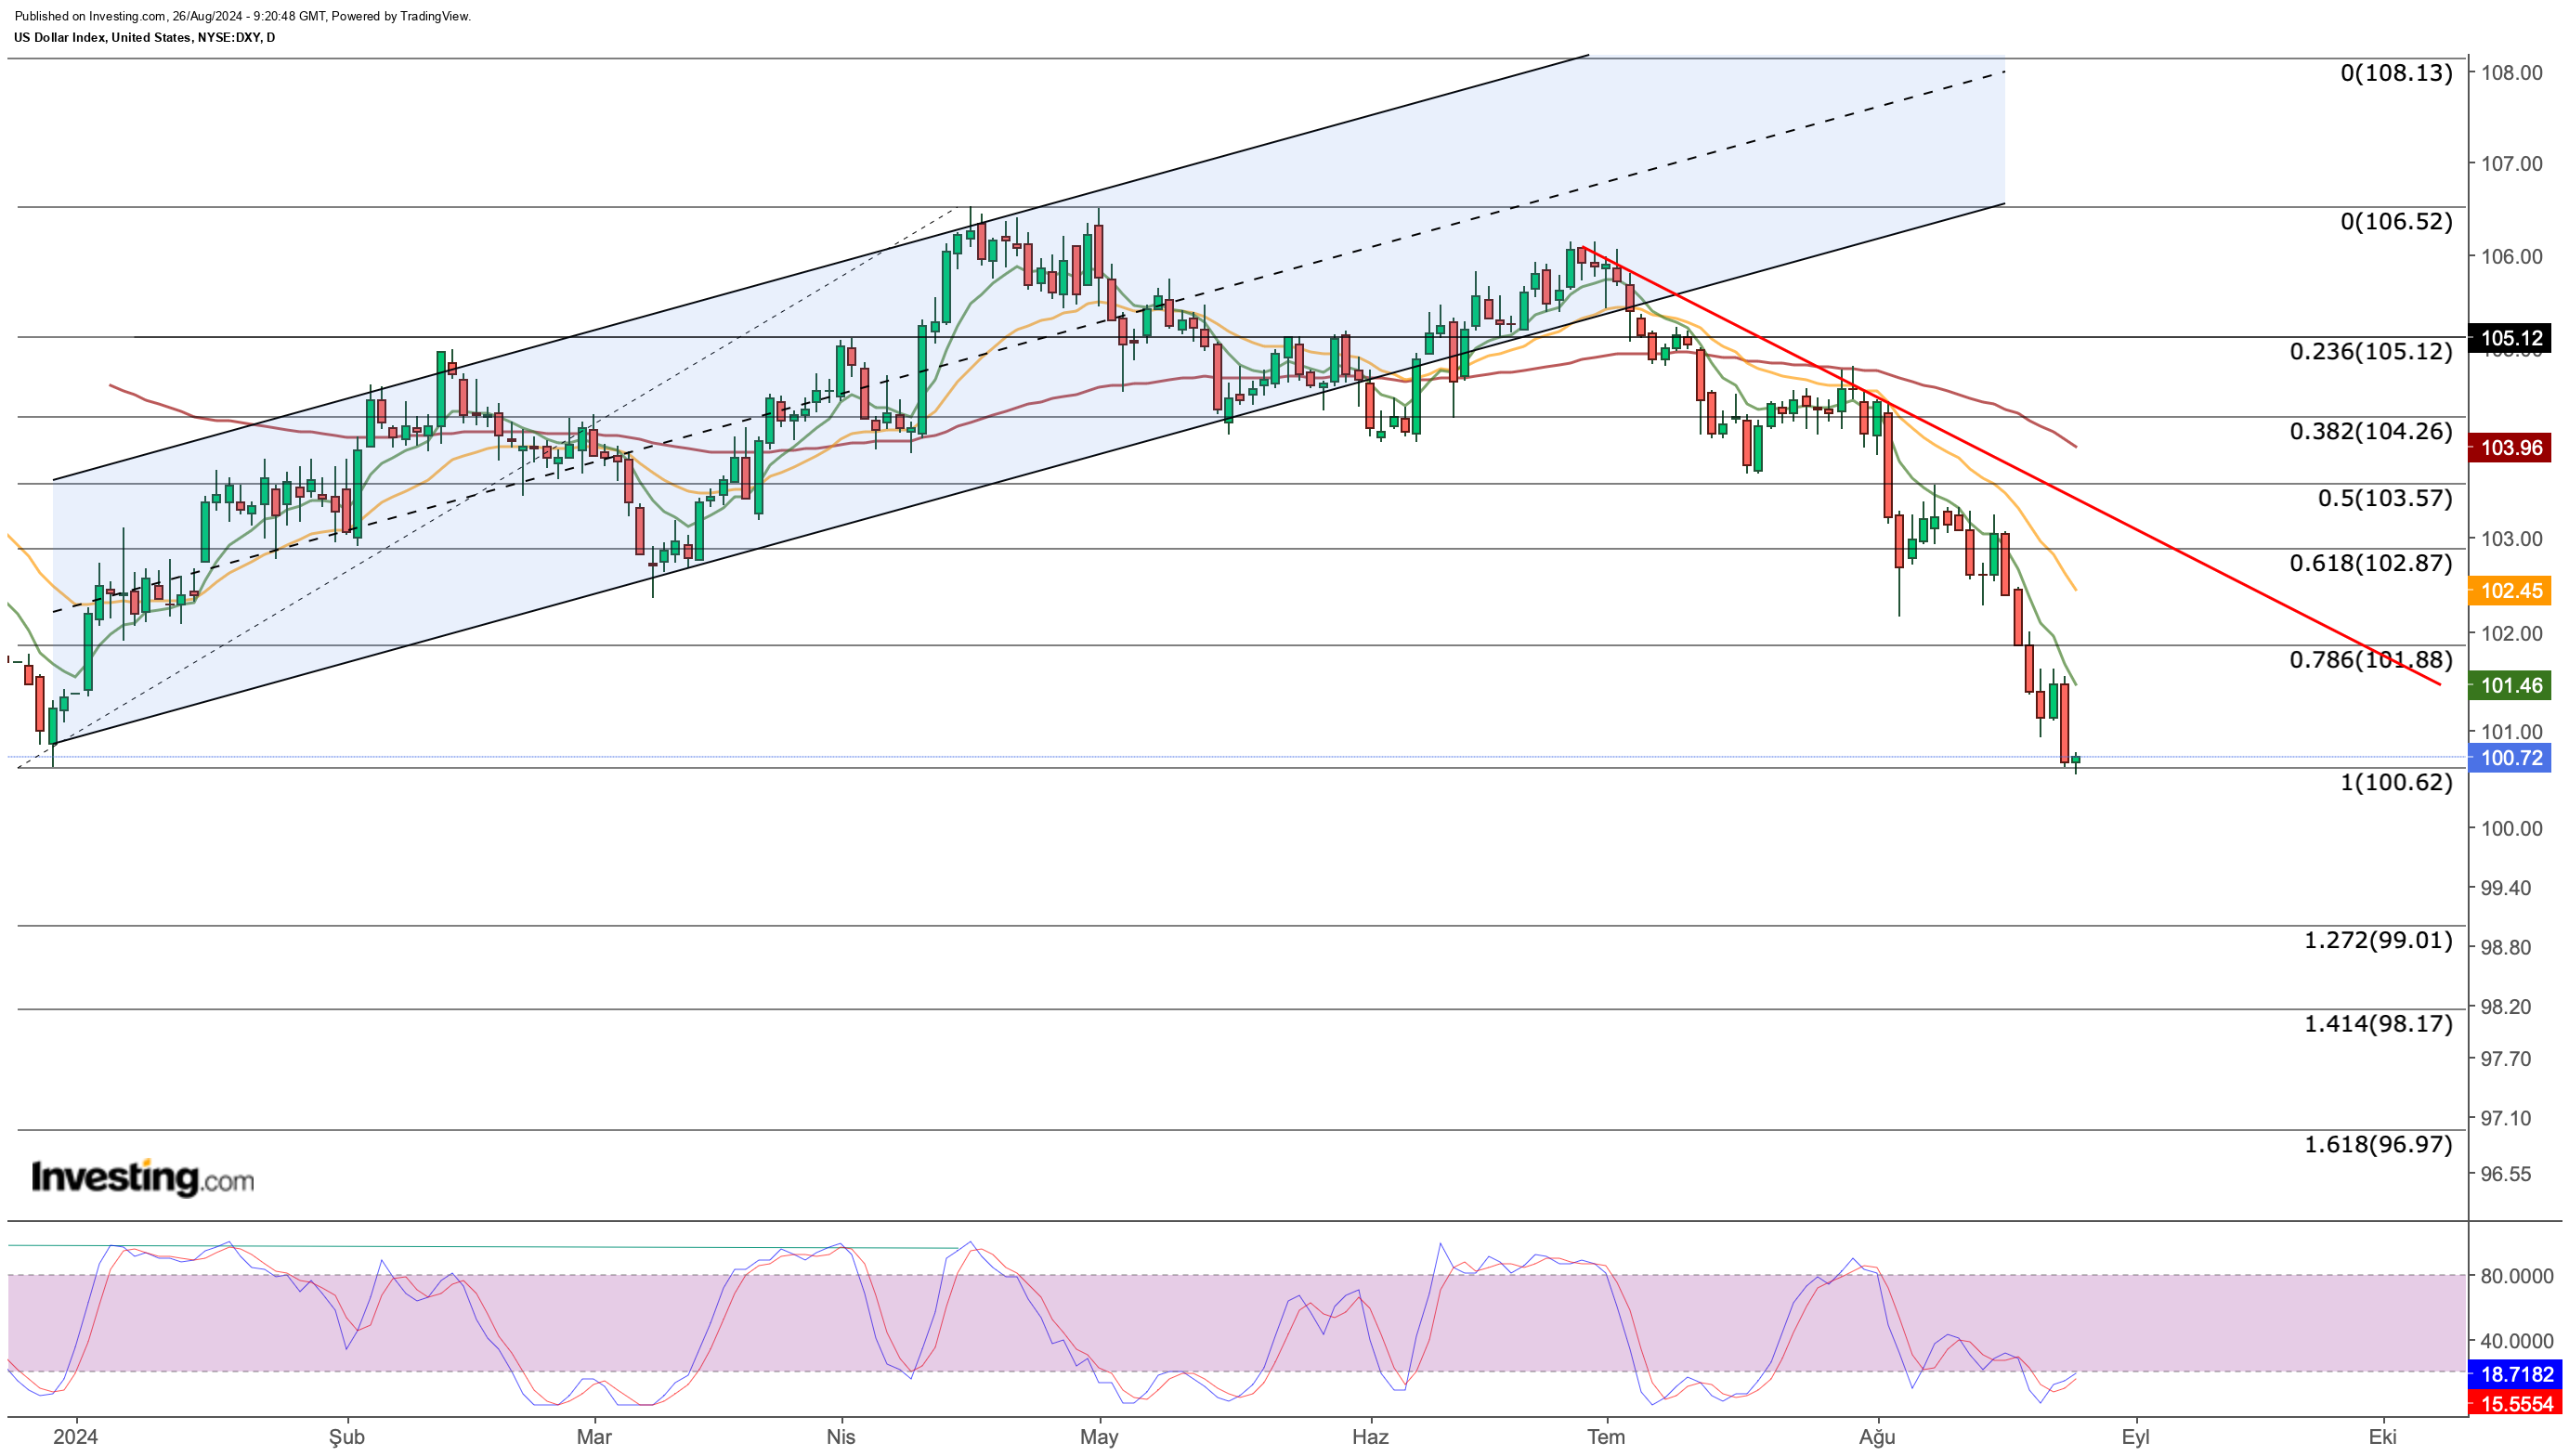
- As of now, the greenback is approaching a critical support at 100.
- Break below this level could lead to a bigger decline.
- For less than $8 a month, InvestingPro's Fair Value tool helps you find which stocks to hold and which to dump at the click of a button.
Fed Chairman Jerome Powell delivered exactly what the markets wanted in his Jackson Hole speech last week, signaling it’s time to adjust monetary policy.
This confirmation that the Fed will start cutting interest rates, combined with growing confidence in a soft landing for the U.S. economy, drove the dollar to its lowest levels of the year against five major currencies.
Earlier this year, the dollar climbed as U.S. economic data remained strong, and the Fed maintained a cautious stance on rate cuts.
However, as summer data increasingly supported a rate cut, the Fed shifted away from its tight monetary policy. Concerns about a potential U.S. recession and fears that the Fed might be slow to act briefly triggered a global market sell-off.
Now, with inflation appearing to be under control, Powell’s statement marks a shift toward a more permanent easing of policy.
Markets are currently pricing in a 100 basis point cut by year-end, though some analysts see the potential for up to 150 basis points. The magnitude of the September cut will likely influence this outlook.
Since July, the DXY has steadily declined and plunged to the 100 level after Powell’s speech, reaching lows not seen since December 2023.
Can the greenback stage some sort of a recovery or are there more declines ahead?
Can US Dollar Find Support at Current Levels?
After last week’s pullback, the DXY has returned to the levels that marked the beginning of its upward trend in the first half of the year.
The current downtrend suggests that investors may have already priced in a 100 basis point rate cut from the Fed.
However, Powell emphasized that future rate cuts will depend on incoming data, which might prompt investors to remain cautious about further dollar demand.
Additionally, with the ECB likely to continue cutting rates alongside the Fed, the dollar could face more headwinds.

On the other hand, if Japan’s transition to a tighter monetary policy in Asia is delayed, we might see sustained demand for the dollar at certain levels.
While a weaker dollar outlook is generally accepted at the moment, data from the last quarter could manage the rate-cut process and potentially prevent further dollar weakness.
As the DXY seeks support in a critical zone, we could see a partial recovery toward the 101.5-101.9 range if demand increases.
Technically, the 100.6 level serves as a crucial support point. If the index closes below this level on a weekly basis, it could signal continued weakness.
In that case, the downward cycle might extend toward the 96-99 region, where Fibonacci expansion levels are located.
EUR/USD Crosses a Critical Threshold
In his Jackson Hole speech, Powell expressed increased confidence in reaching the Fed’s inflation target, signaling a future focus on the labor market.
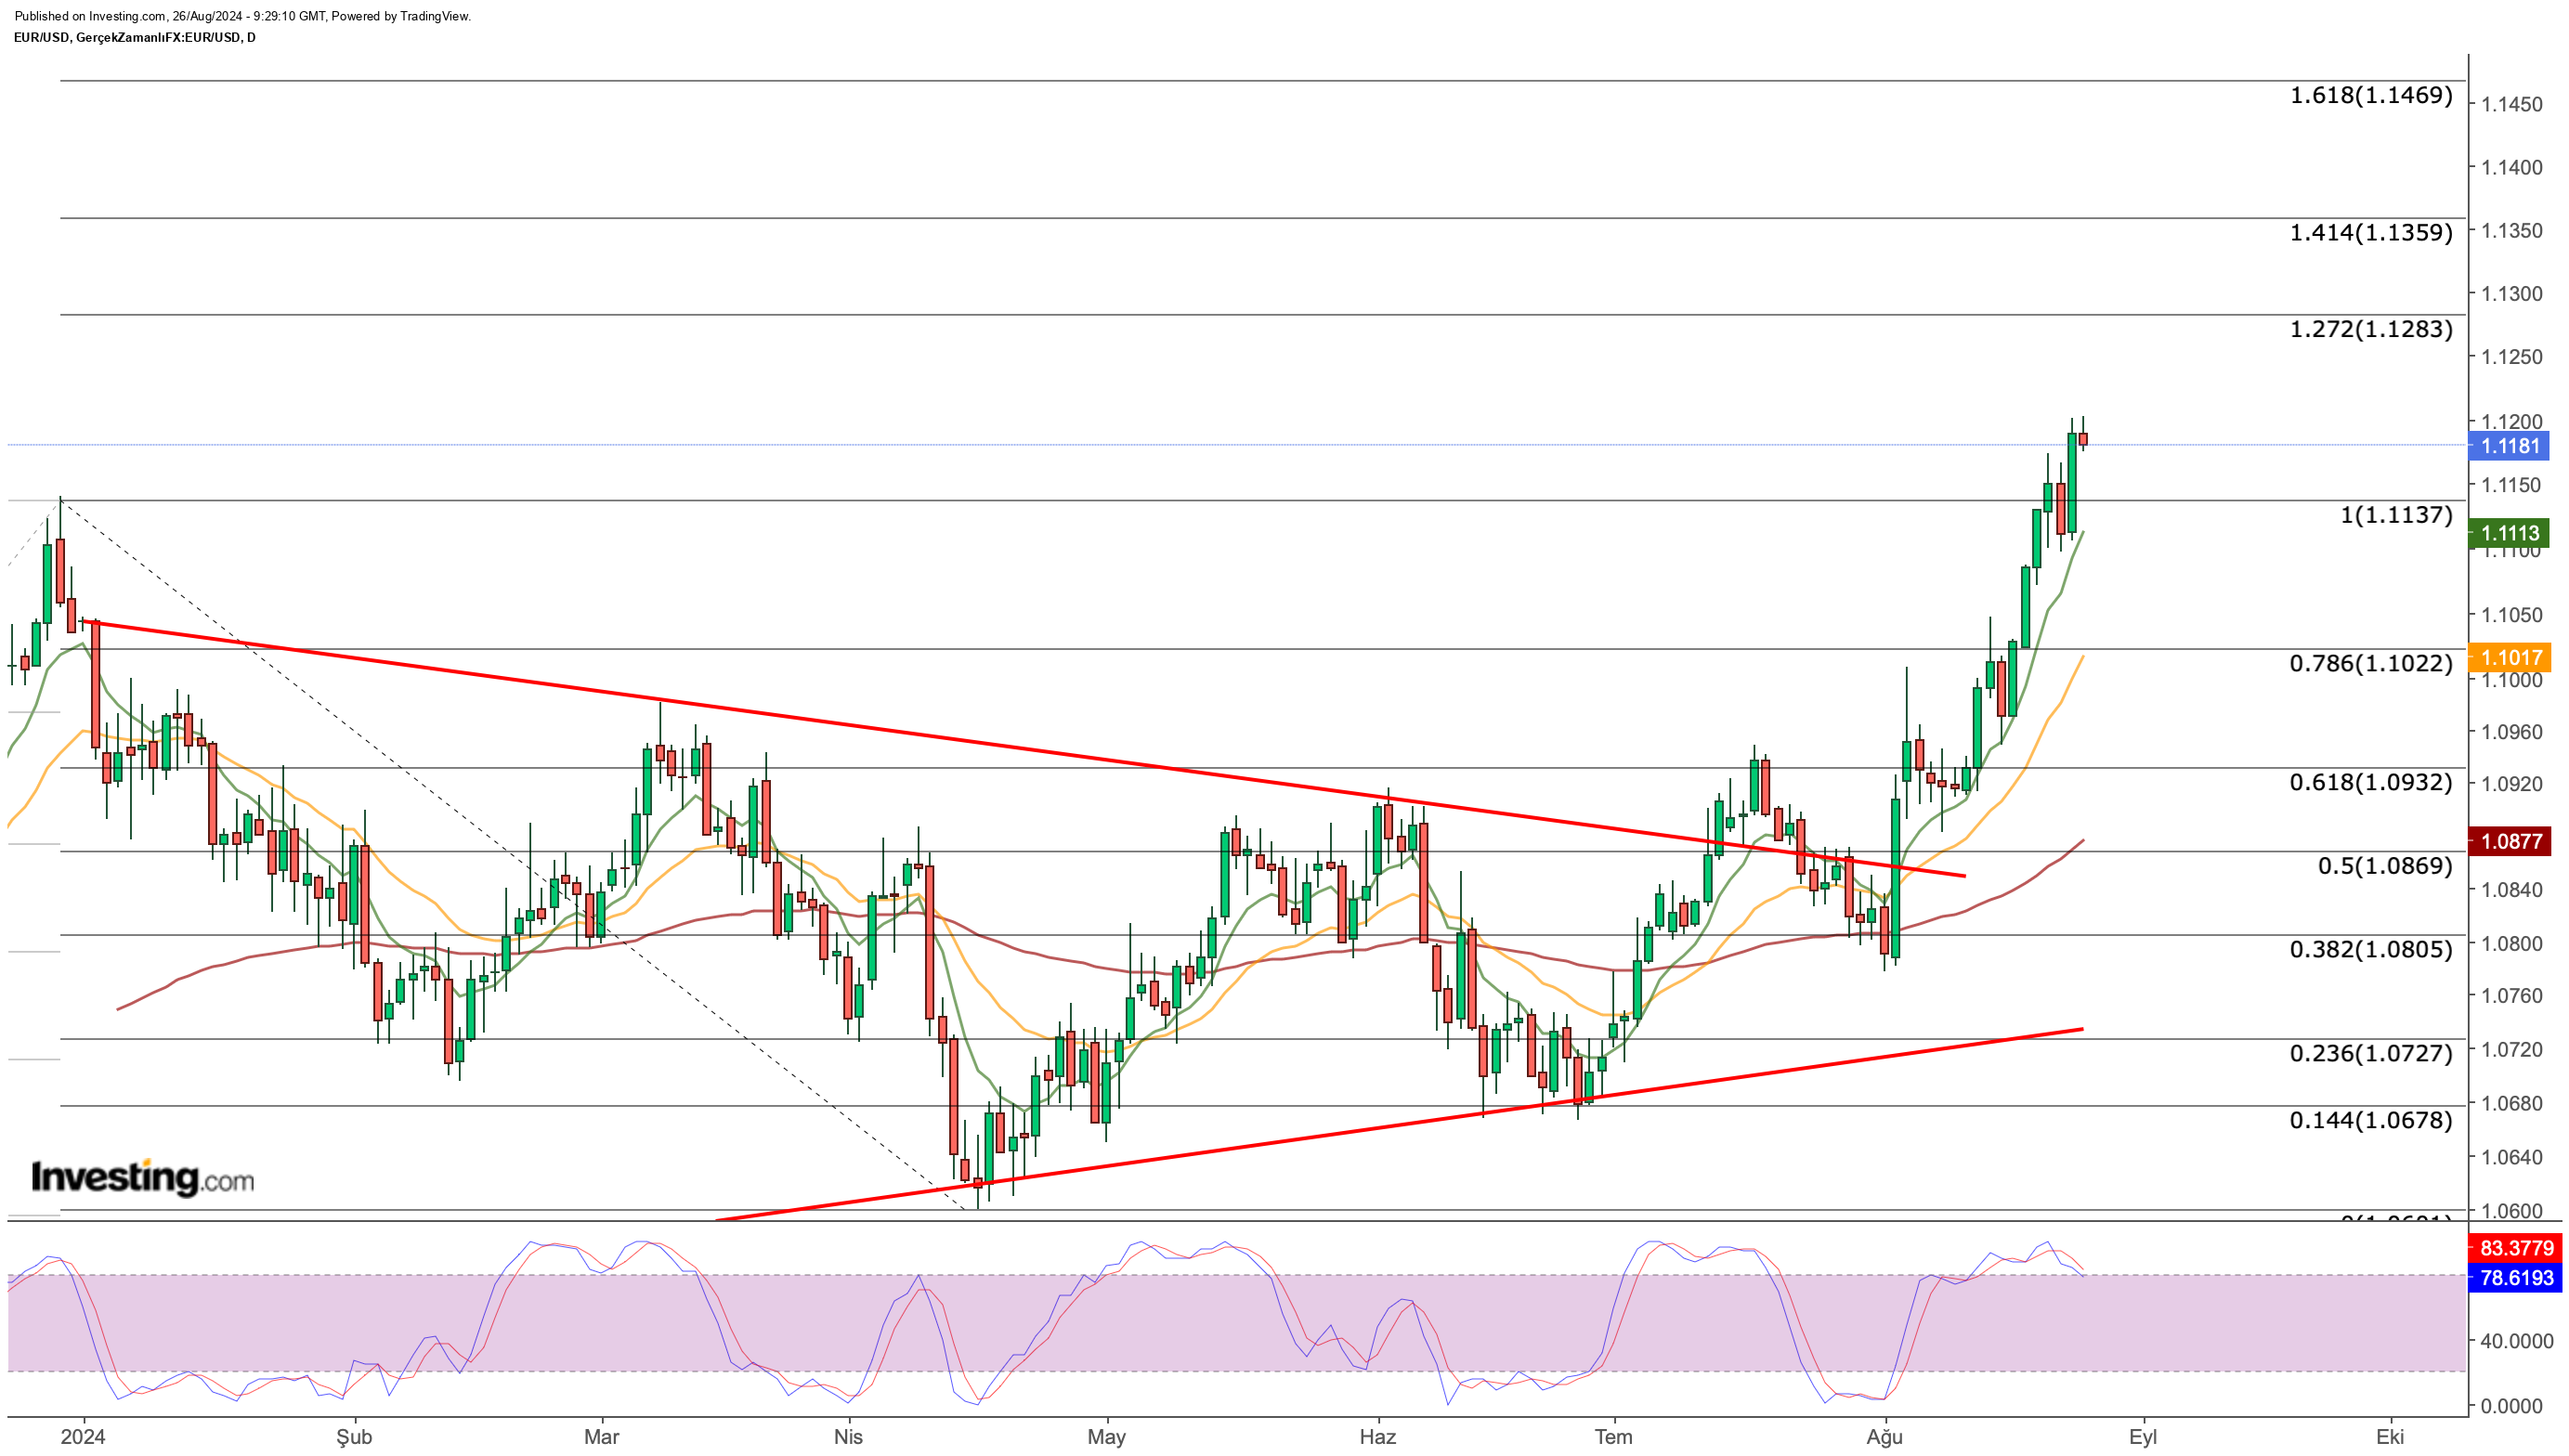
This optimism contributed to a sharp rise in EUR/USD, pushing the pair past the 1.1140 resistance level with strong volume. Despite a slight decline at the start of the week, the pair has effectively maintained Friday’s gains.

As the uptrend in EUR/USD solidifies, the 1.11-1.1140 range now serves as a key support area for potential pullbacks. With the positive momentum intact, the pair may continue its advance toward the 1.1280 region.
If this resistance is breached, the next targets could be 1.136 and 1.147, aligning with the DXY’s potential retracement below the 100 level toward 96.
Gold Continues to Rise
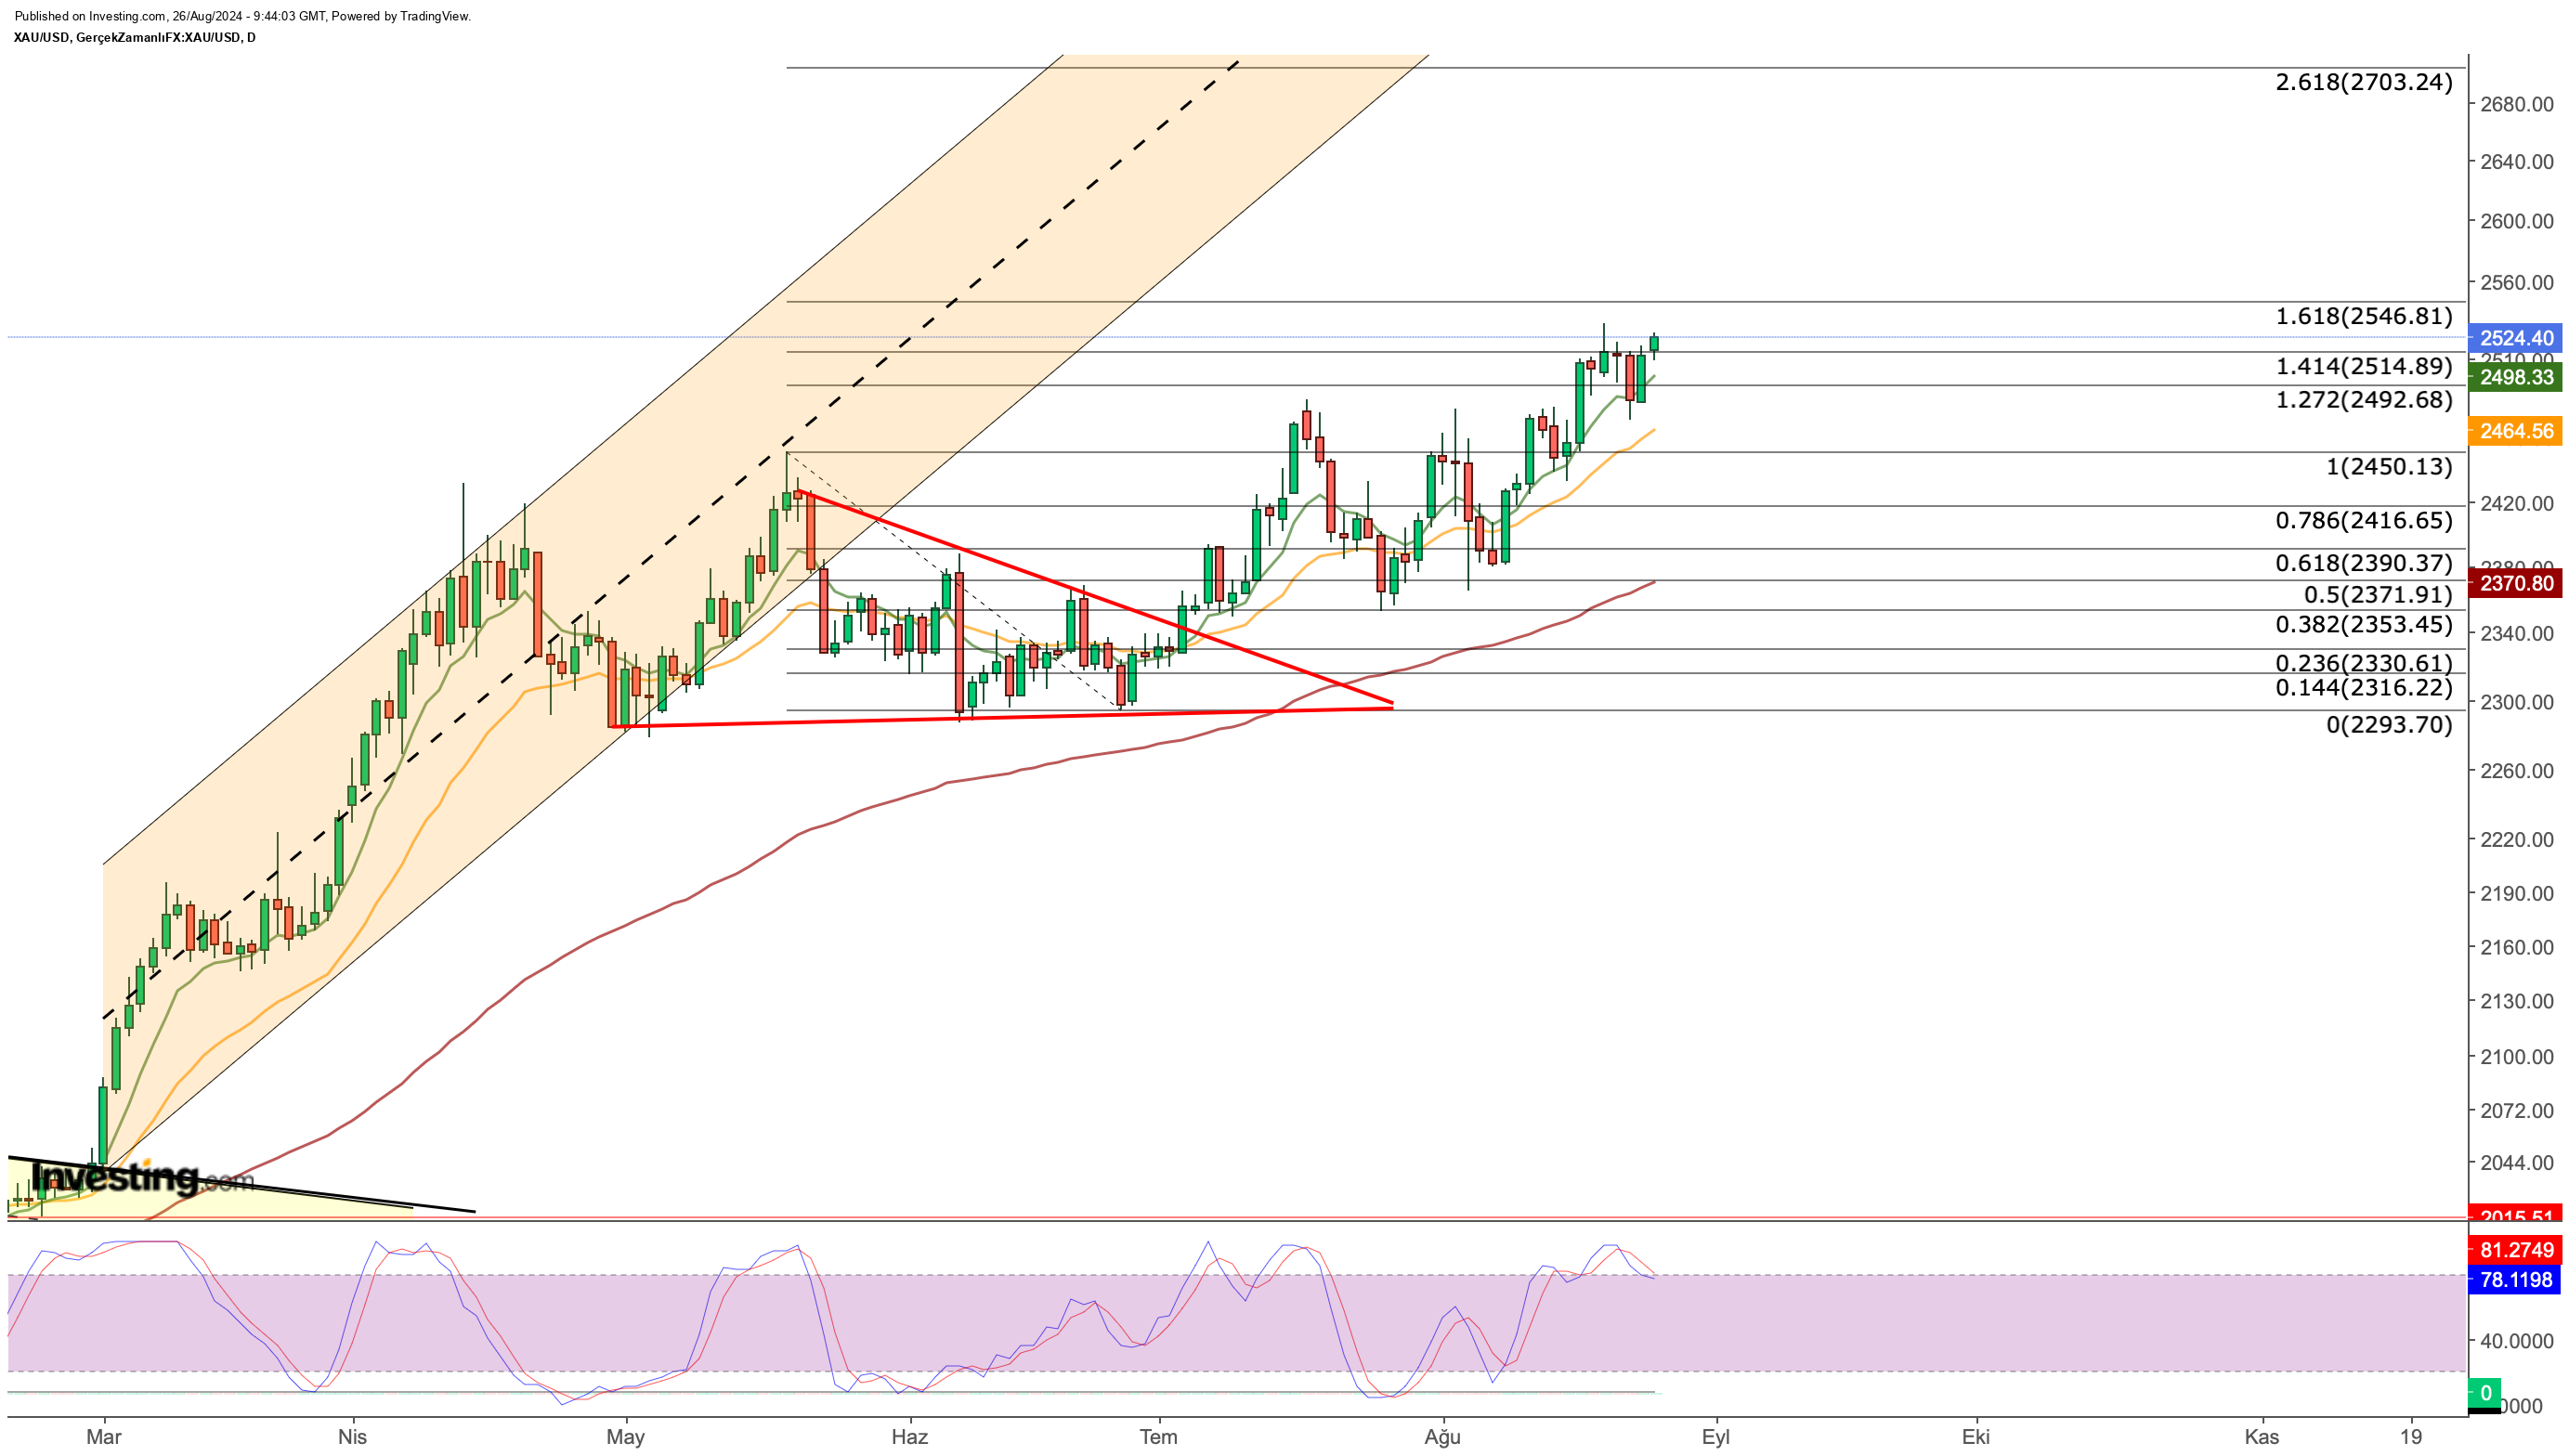
After finding support at $2,290 in early June, gold has been steadily climbing, with only limited corrections along the way.
The dollar’s continued weakness, fueled by Powell’s shift in policy, alongside heightened geopolitical risks from the Middle East, has driven increased demand for gold.
As other central banks move away from tight monetary policies, the expected decline in currency yields could further boost gold demand. Additionally, gold remains a preferred safe haven due to ongoing geopolitical tensions.

Despite briefly pulling back after hitting a record high of $2,532 this week, gold quickly recovered following Powell’s remarks and started the week on a strong note.
Currently trading near the peak at $2,525, gold faces technical resistance around the $2,550 level. On the downside, potential profit-taking could see prices dip to $2,515, with further declines to the $2,460-2,490 range offering possible buying opportunities at the current average.
***
Disclaimer: This article is written for informational purposes only. It is not intended to encourage the purchase of assets in any way, nor does it constitute a solicitation, offer, recommendation or suggestion to invest. I would like to remind you that all assets are evaluated from multiple perspectives and are highly risky, so any investment decision and the associated risk is at the investor's own risk. We also do not provide any investment advisory services. We will never contact you to offer investment or advisory services.
