Dwindling stockpiles have already sent corn, soybeans and wheat prices skyrocketing. Now, China’s ravenous demand, which is almost pandemic-proof, is making the industry worry there may be too little supply versus the glut which has been typical for years.

On a warm Friday morning in Washington two years ago, Robert Johansson, chief economist at the U.S. Department of Agriculture, delivered a message to some 1,500 attendees at the USDA Agriculture Outlook that could hardly be regarded as sunny.
The third week of February 2019 had just begun and the stocks-to-use ratio of U.S. soybeans was about 23%, much higher than a more normal level of 10%. Johansson said, ruefully:
“To get back to 10% stocks to use, we would expect to take a number of years.”
Fast forward 11 months as we begin the third week of January 2021, the soybean stocks-to-use ratio was at 3.1%—the lowest since 2.6% in 2013. In 2020, the ratio was at 13%.
Corn’s stocks-to-use ratio was at 11.5%, below the 30-year average of 13.8% and the lowest since the December 2012 ratio of 5.8%, which marked a historic tightness.
China Buying Like There’s No Tomorrow
Part of the scarcity in U.S. grains now has to do with China, which, analysts say, has been buying grains like there’s no tomorrow.
Jack Scoville, who heads agricultural research at Chicago’s Price Futures Group, said China’s hand was clear in USDA export sales numbers for the first week of January, where it bought 758,300 metric tonnes of soybeans, 88,500 metric tonnes of corn and 58,400 metric tonnes of wheat.

He added:
“The export sales report featured almost all buying by China. China continues to buy each day and has appeared in the daily reporting system of USDA in the past week.”
Two years ago, Chinese buying of U.S. grains was highly restrained due to the Trump administration’s tariffs that eventually led to the 2020 trade deal between the two countries.
Yet, early Sino compliance to the agreement was average, with exports accelerating after November’s presidential election victory for Democrat Joseph Biden over Republican Trump. In November alone, China bought 6.04 million tonnes of U.S. soybeans, up 136% from 2.56 million tonnes a year ago.
The Wall Street Journal, the conservative business daily that leaned towards Trump during his four years in office, said China’s ramping up of U.S. grain buying ahead of Biden’s term coincided with market optimism that relations between the two countries will improve hereon.
To underscore the assertion, Sal Gilbertie, president at grains trader Teucrium, told the WSJ in a report published last week:
“There’s a general perception that a Biden administration will be friendlier than a Trump administration.”
The paper added that U.S. grains prices could also benefit longer-term under a better bilateral relationship:
“The Biden administration’s dealings with China could also shift the outlook for commodities, after the country’s tensions with the Trump administration sparked price swings in recent years.”
U.S. Grain Prices Rocking
So, what’s the near-term outlook at least for U.S. grain prices, assuming that stockpiles stay tight and China keeps up its buying blitz?
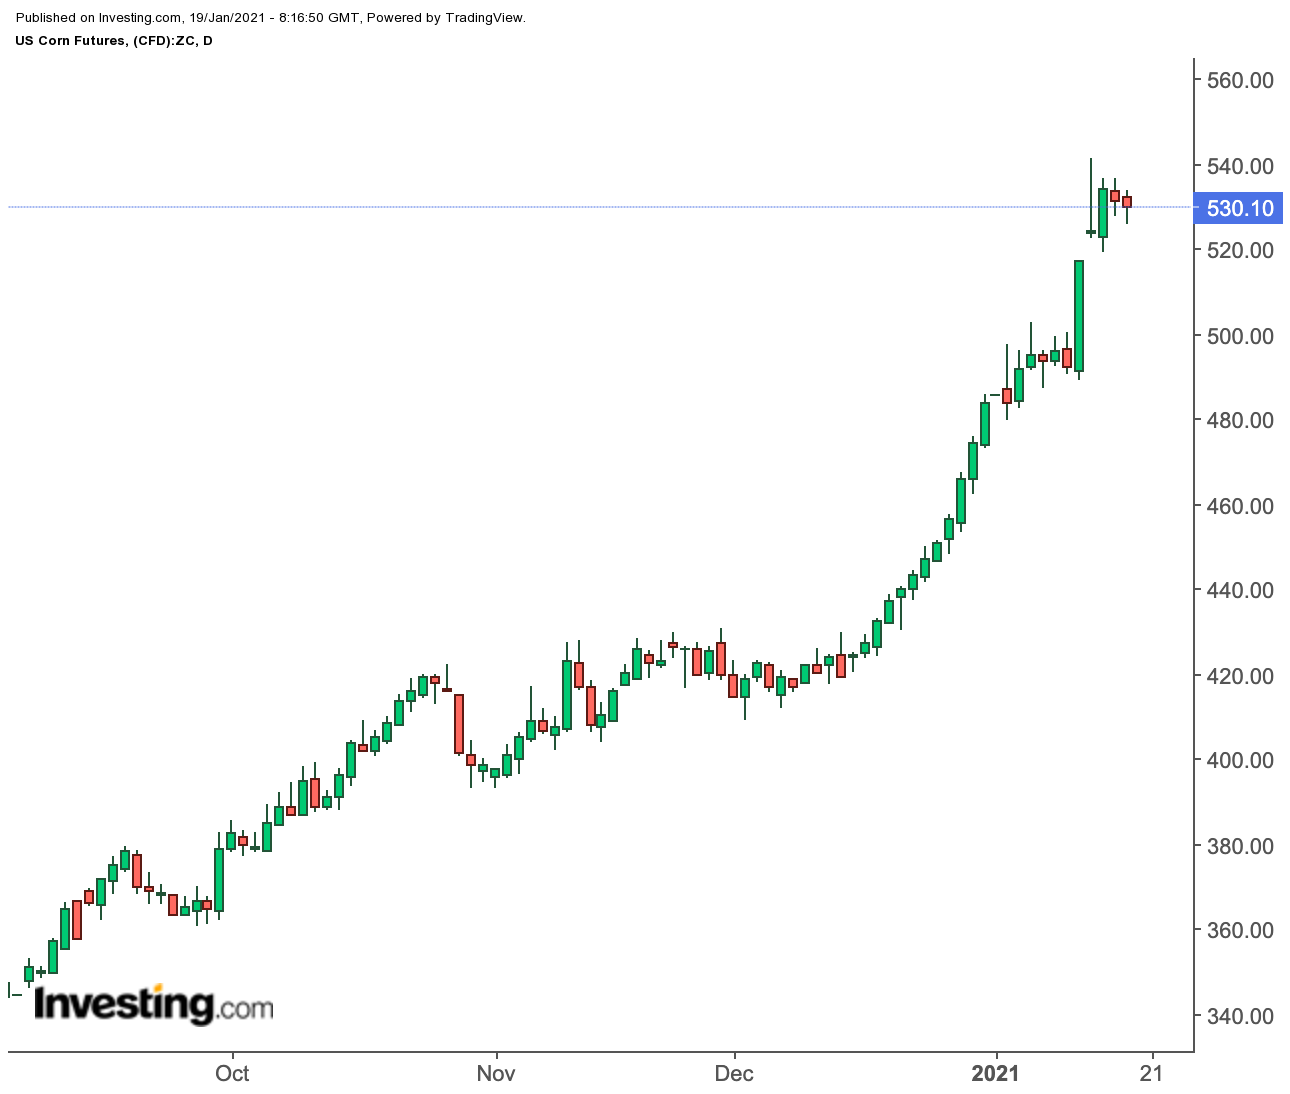
At Friday’s last trade, corn futures for March delivery on the Chicago Board of Trade last traded at $5.31 per bushel, up more than 9% on the year.
Investing.com’s Daily Technical Outlook for corn is a “Strong Buy” based on its current momentum. Our three-tier Fibonnaci resistance put corn’s first test at $5.35, then $5.37 and, finally, $5.41.
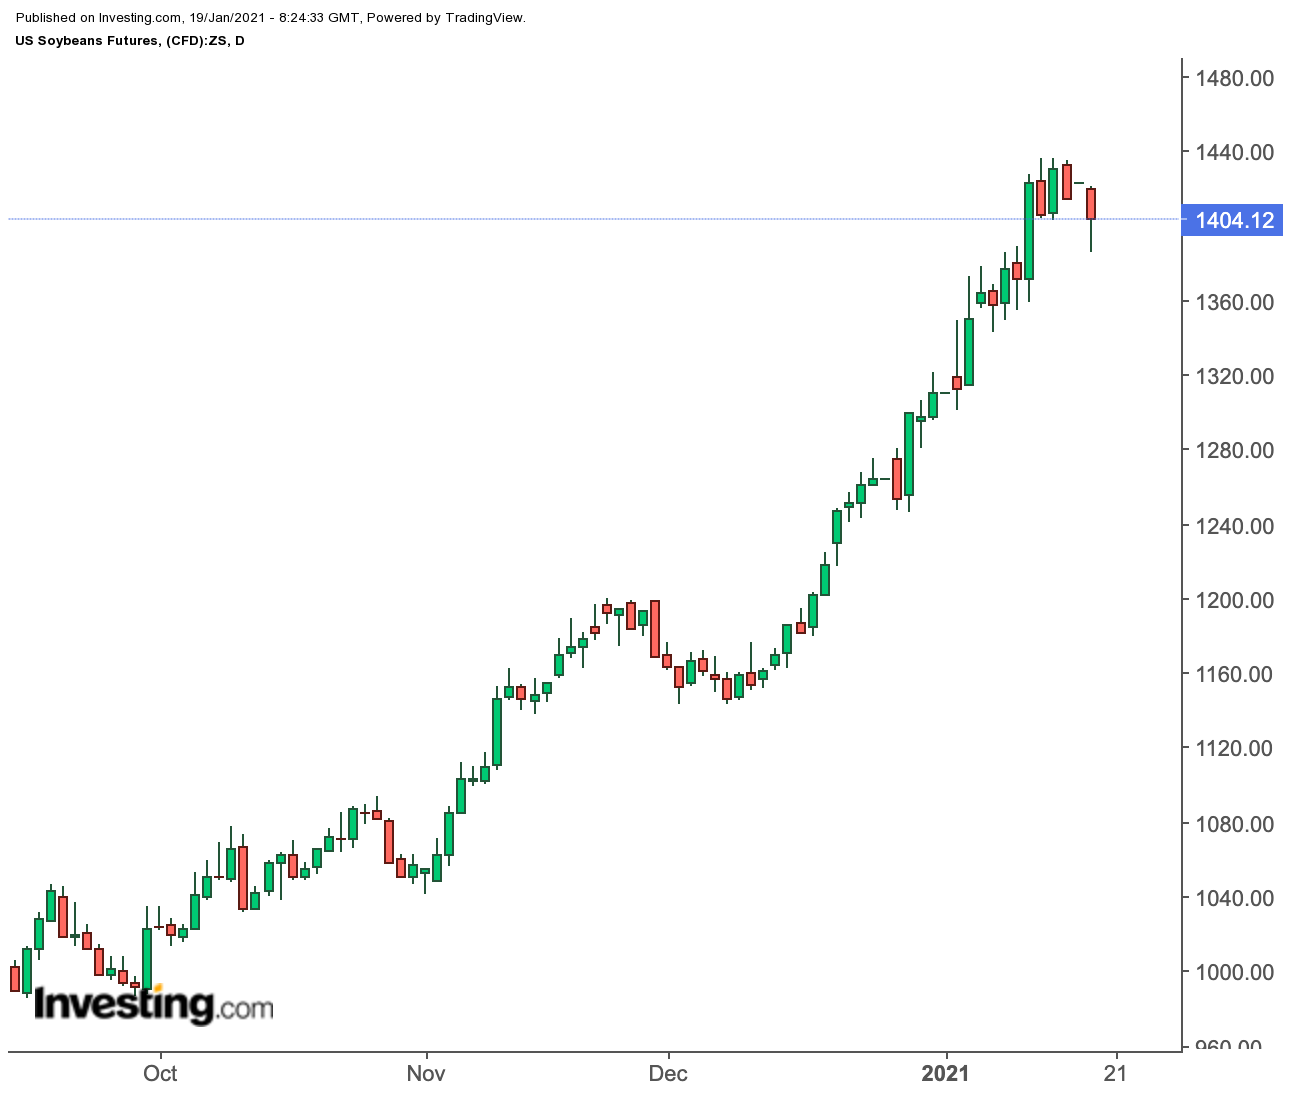
For soybeans, the March contact on the CBOT settled Friday at nearly $11.415 per bushel, up 8% on the year.
Investing.com’s Daily Technical Outlook for soybeans is a “Strong Buy” as well, with first Fibonnaci resistance at $14.360, second at $14.480 and third at $14.600.
In wheat, CBOT’s March delivery contract closed Friday’s trade at $6.75 a bushel, up 5% on the year.
Investing.com’s Daily Technical Outlook has another “Strong Buy” for wheat, with the first Fibonacci test at $6.885, second at $6.952 and third at $7.062.
Disclaimer: Barani Krishnan uses a range of views outside his own to bring diversity to his analysis of any market. He does not own or hold a position in the commodities or securities he writes about.
