Gold and yen pairs have long been considered a flight to safety. When traders get nervous, they tend to sell risky assets and move their money into “safe havens,” such as gold and yen.
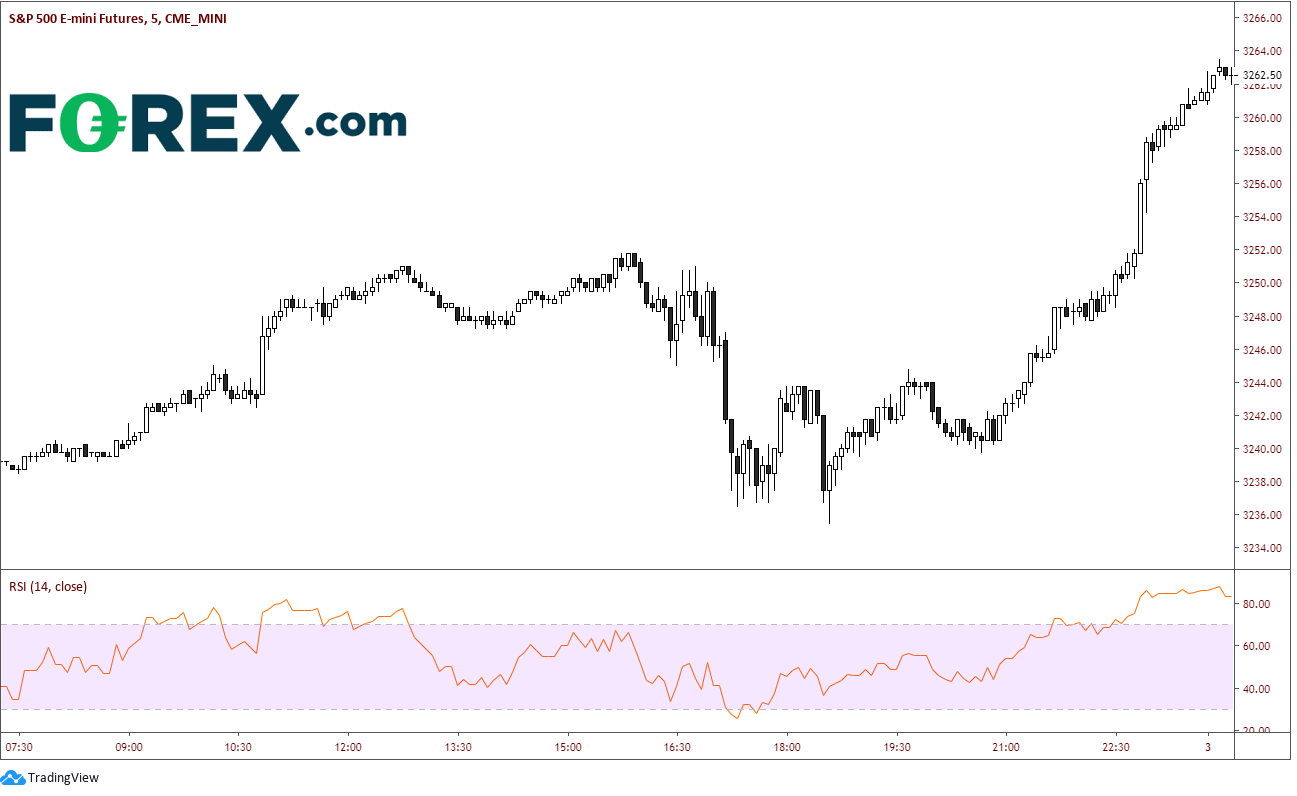
Given yesterday’s risk-on move in stocks, one may have considered that things to be great and that the economy is on the path of growth and continued support by the Fed. This can be seen in a 5-minute chart of yesterday’s price action in S&Ps.

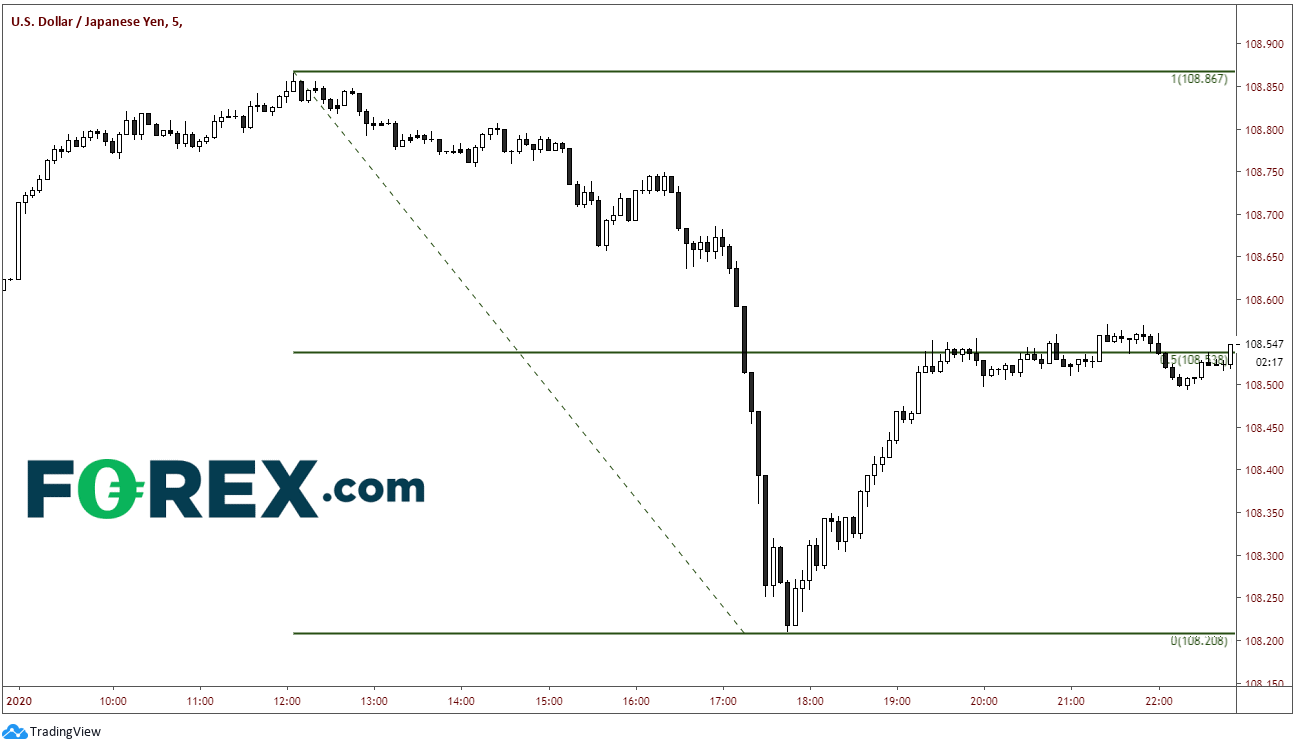
That may still be the case, however, gold and the yen didn’t seem to believe the narrative. Take a look at the 5-minute chart of USD/JPY from yesterday. As S&Ps were making new highs into the close, USD/JPY could only retrace 50% of the day’s move.

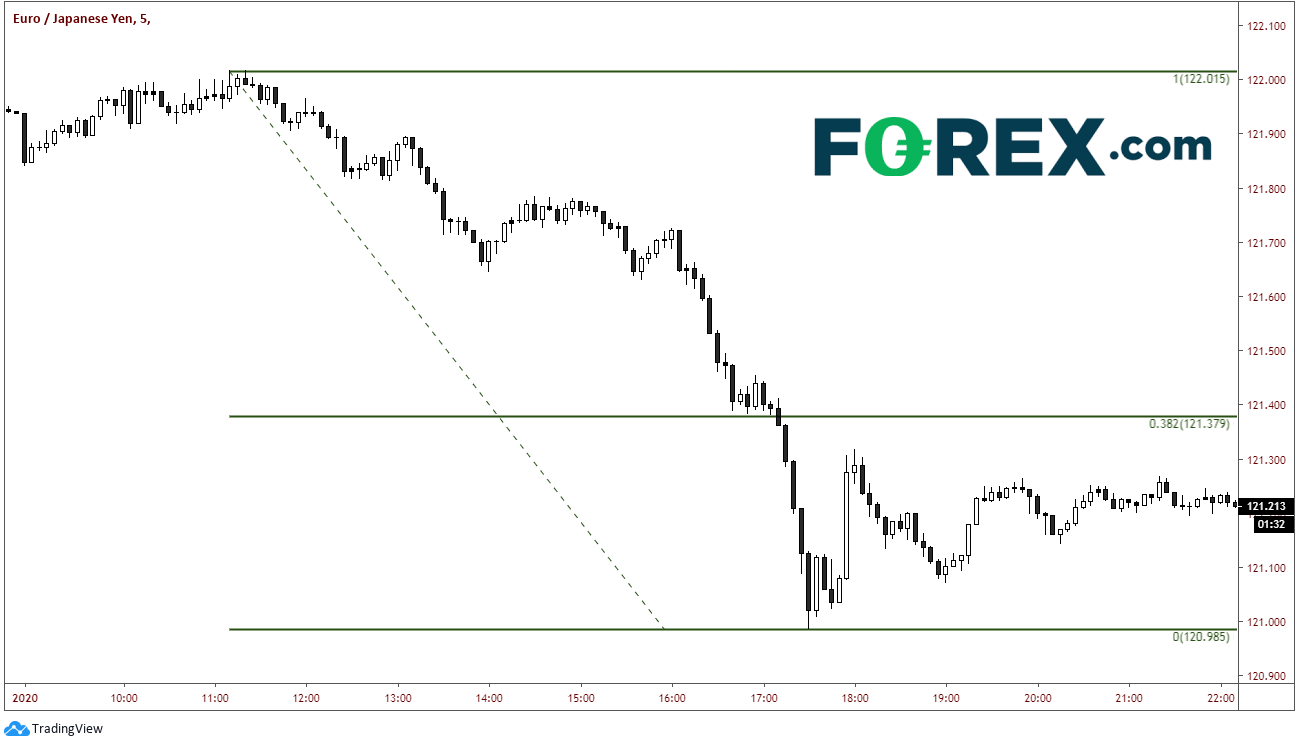
The same can be said for EUR/JPY. From high to low, the yen pair was down over 200 pips, and could not even retrace to the 38.2% Fibonacci retracement level for the day.

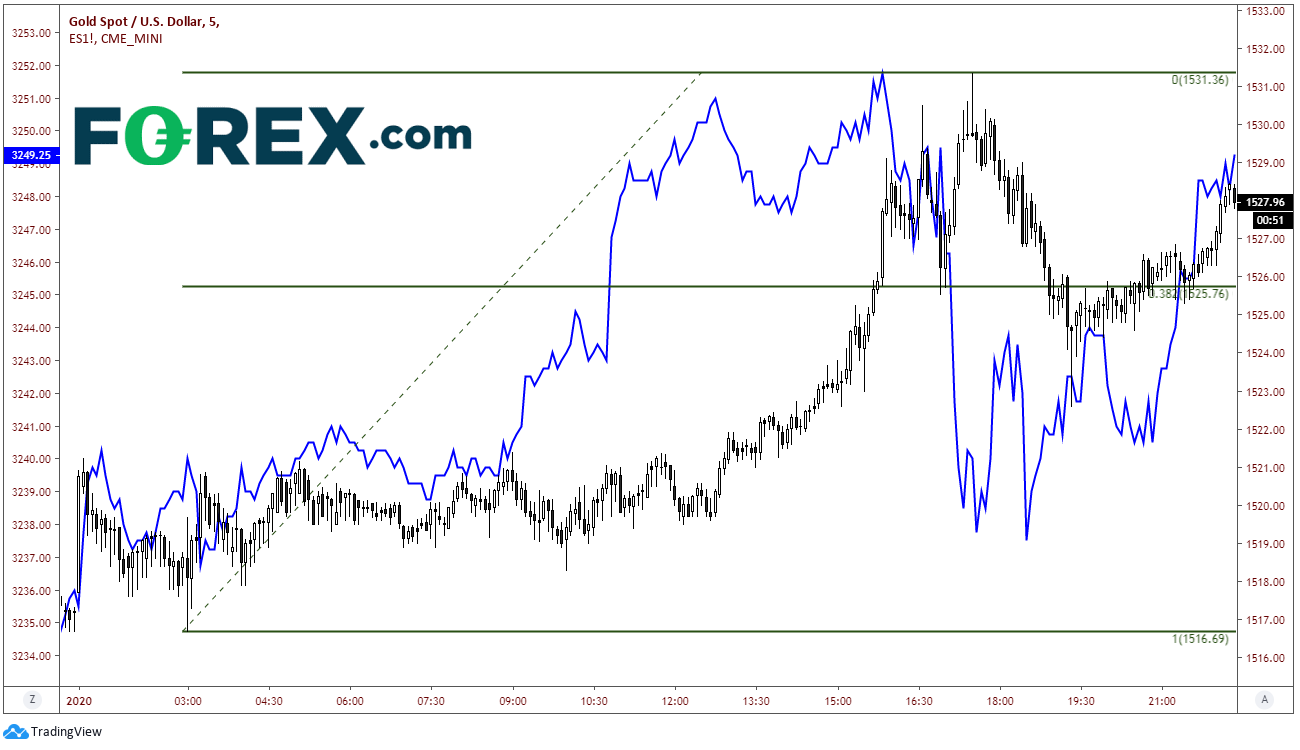
Below is a 5-minute chart of S&Ps overlaid on gold. Gold and S&P’s typically have an inverse relationship, i.e. when stocks move higher, gold will usually move lower. Notice at the end of the day how the two assets were moving together.

Perhaps this just may have just been positioning on the first trading day of the new year. Markets will still be thin until many traders return from a long break on Monday. However, after seeing the price action of yen pairs and gold begs us to ask the question: Did someone know that the U.S. attack, which killed Iran Gen. Qassem Soleimani, was imminent? This is something we will never know the answer to. Obviously, as we know now, after the attacks S&Ps dropped roughly 55 handles from high to low. Proper risk management would have stopped out anyone who had gotten long in S&Ps into the end of day yesterday. But when we see asset correlations break down, we need to ask ourselves why that is and take note of it. If one had questioned this yesterday, it may have resulted in hesitation to buy S&Ps into the end of the day and may have saved someone from a losing trade.
