When crafting an investment portfolio, it's tempting to look at the stellar performance of U.S. equities over the past decade and consider a 100% allocation to U.S. markets. However, a broader historical perspective suggests a different strategy could be effective.
Consider the period from 1999 to 2009, often referred to as the "lost decade" for U.S. equities. In this era, the dot-com bubble burst and the 2008 financial crisis hit, leading to a virtually flat performance of the U.S. market on a real return basis.
In contrast, global developed markets, represented by the MSCI EAFE Index—an index of equities in Europe, Australasia, and the Far East—performed notably better during the same period¹.
Given the abundance of cost-efficient ETFs today that offer exposure to nearly all investable markets worldwide, there's no compelling reason to forego the benefits of international diversification².
Let's explore why splitting your ETF allocations between U.S. and global equities not only provides more targeted exposure but also enhances diversification³.
A tale of two indexes
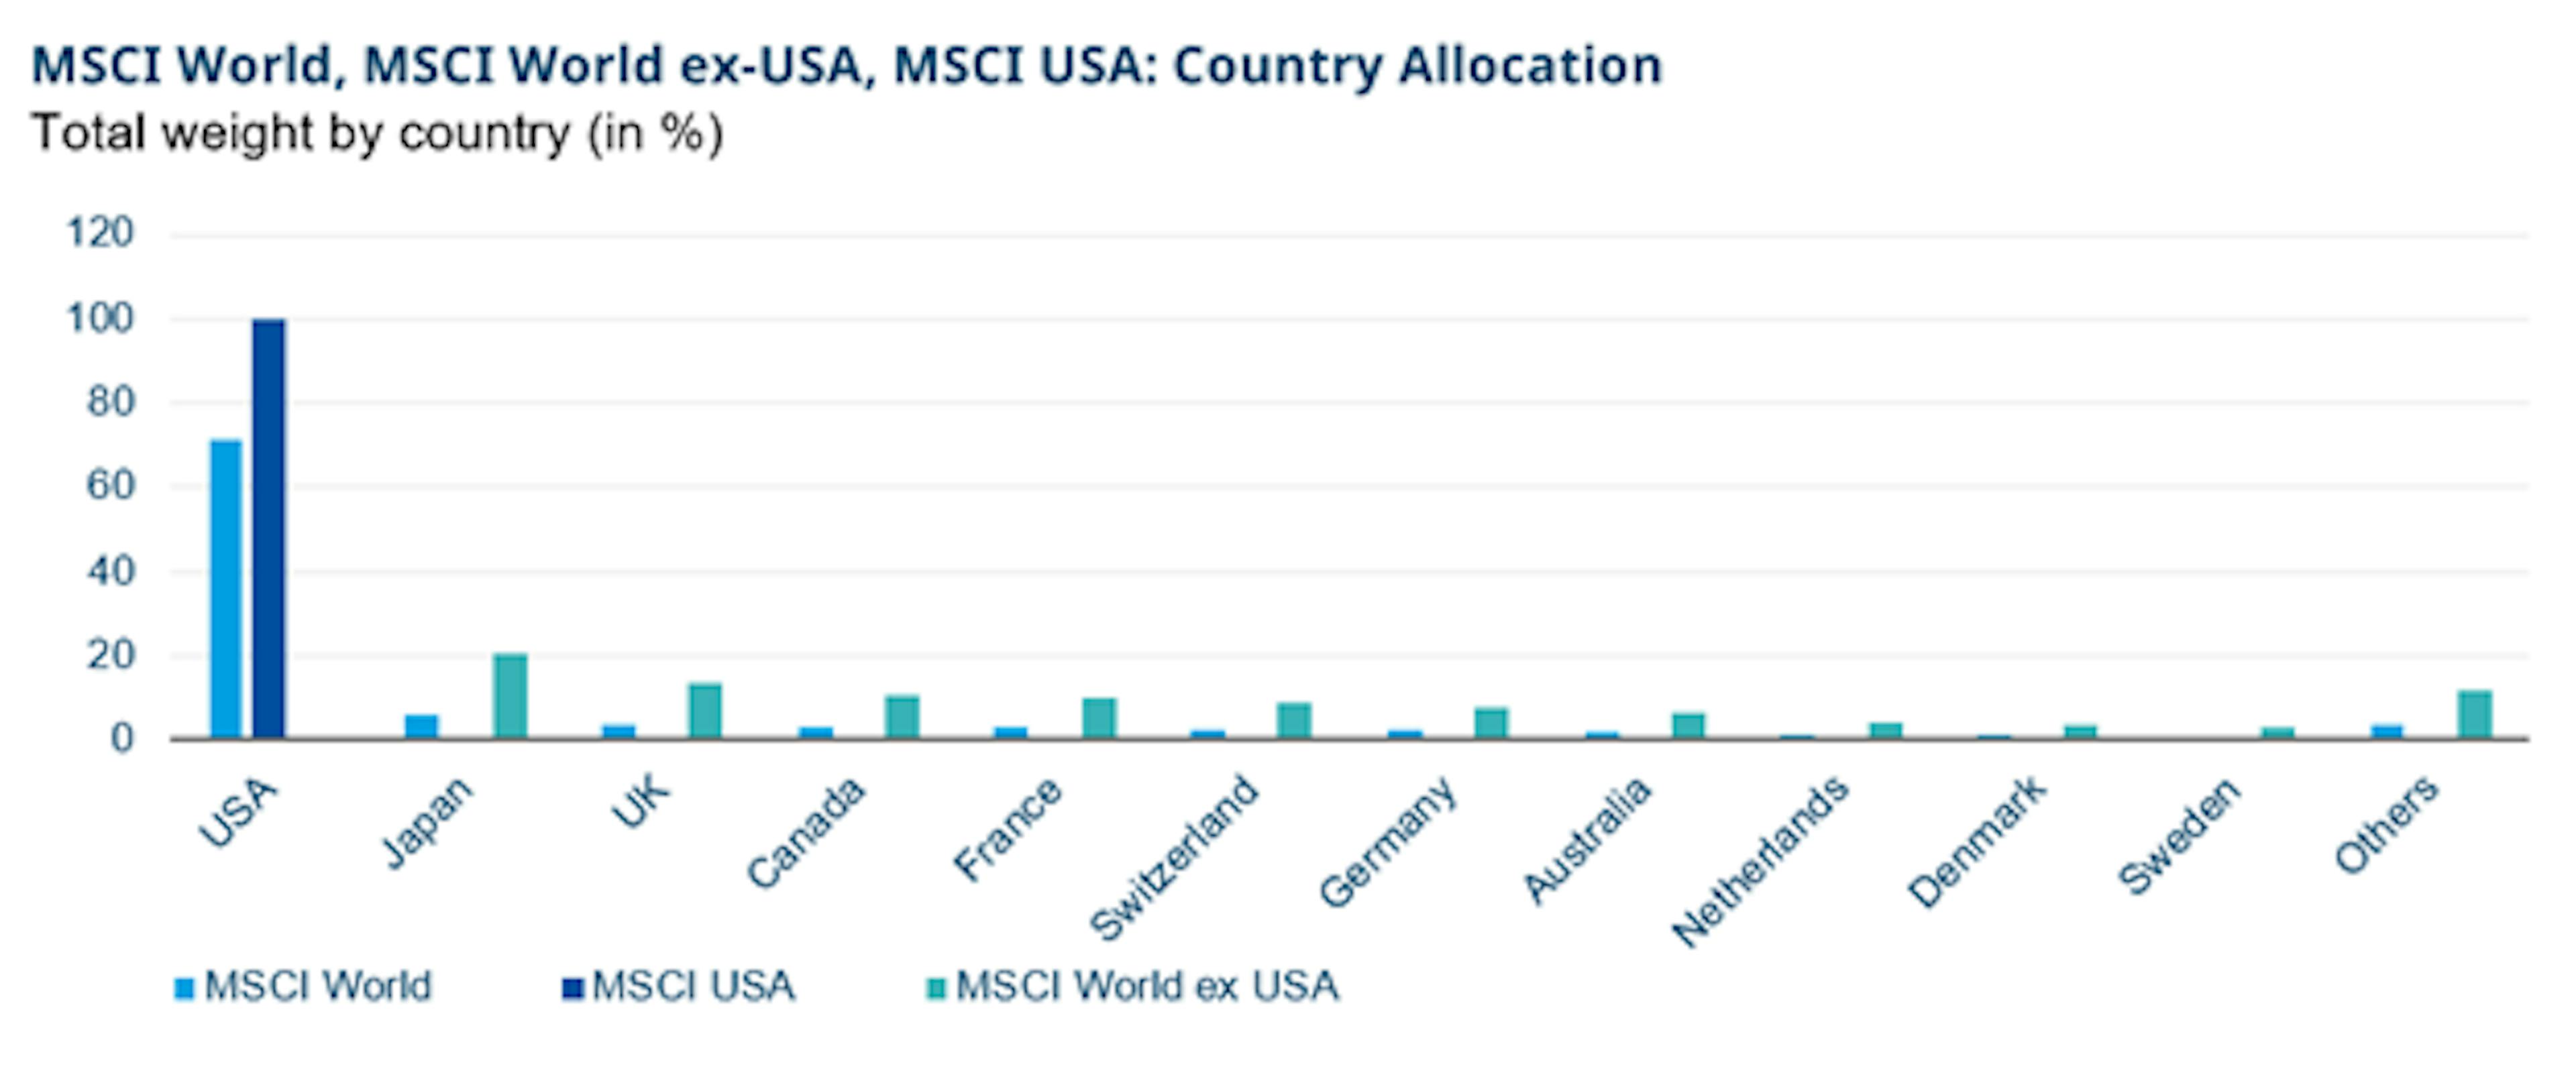
The MSCI World Index is often seen as the go-to benchmark for global equity exposure, but it may not be as diversified as one might assume. A closer look reveals that the US accounts for 71% of the index's weight⁴.
This heavy concentration is due to the index being market cap-weighted, meaning the largest companies, predominantly found in the U.S., heavily influence it. As a result, significant markets like Japan, the UK, France, and Canada are comparatively underrepresented.
For investors aiming to achieve a more balanced global exposure, particularly enhancing their stake in non-U.S. markets, relying on the MSCI World Index alone might not suffice. A more effective solution could be to split your approach.
One potential way to do so could be to consider the MSCI World ex-USA Index, which, as the name suggests, excludes U.S. equities. In this index, European equities take the forefront, constituting about 51% of its weight⁵. This approach allows for a more pronounced exposure to international markets, addressing the imbalance created by the dominant U.S. presence in the global index.
Source: Bloomberg, MSCI, Amundi. Data as at 30/08/2024. Past performance is not a reliable indicator of future performance.
Free float, full float, and GDP
One important aspect of many global indices, including MSCI World, is that they are weighted by free float market capitalization.
Free float market cap refers to the total value of the publicly available shares of a company. This method excludes shares held by insiders, governments, or other restricted holdings that are not available for public trading.
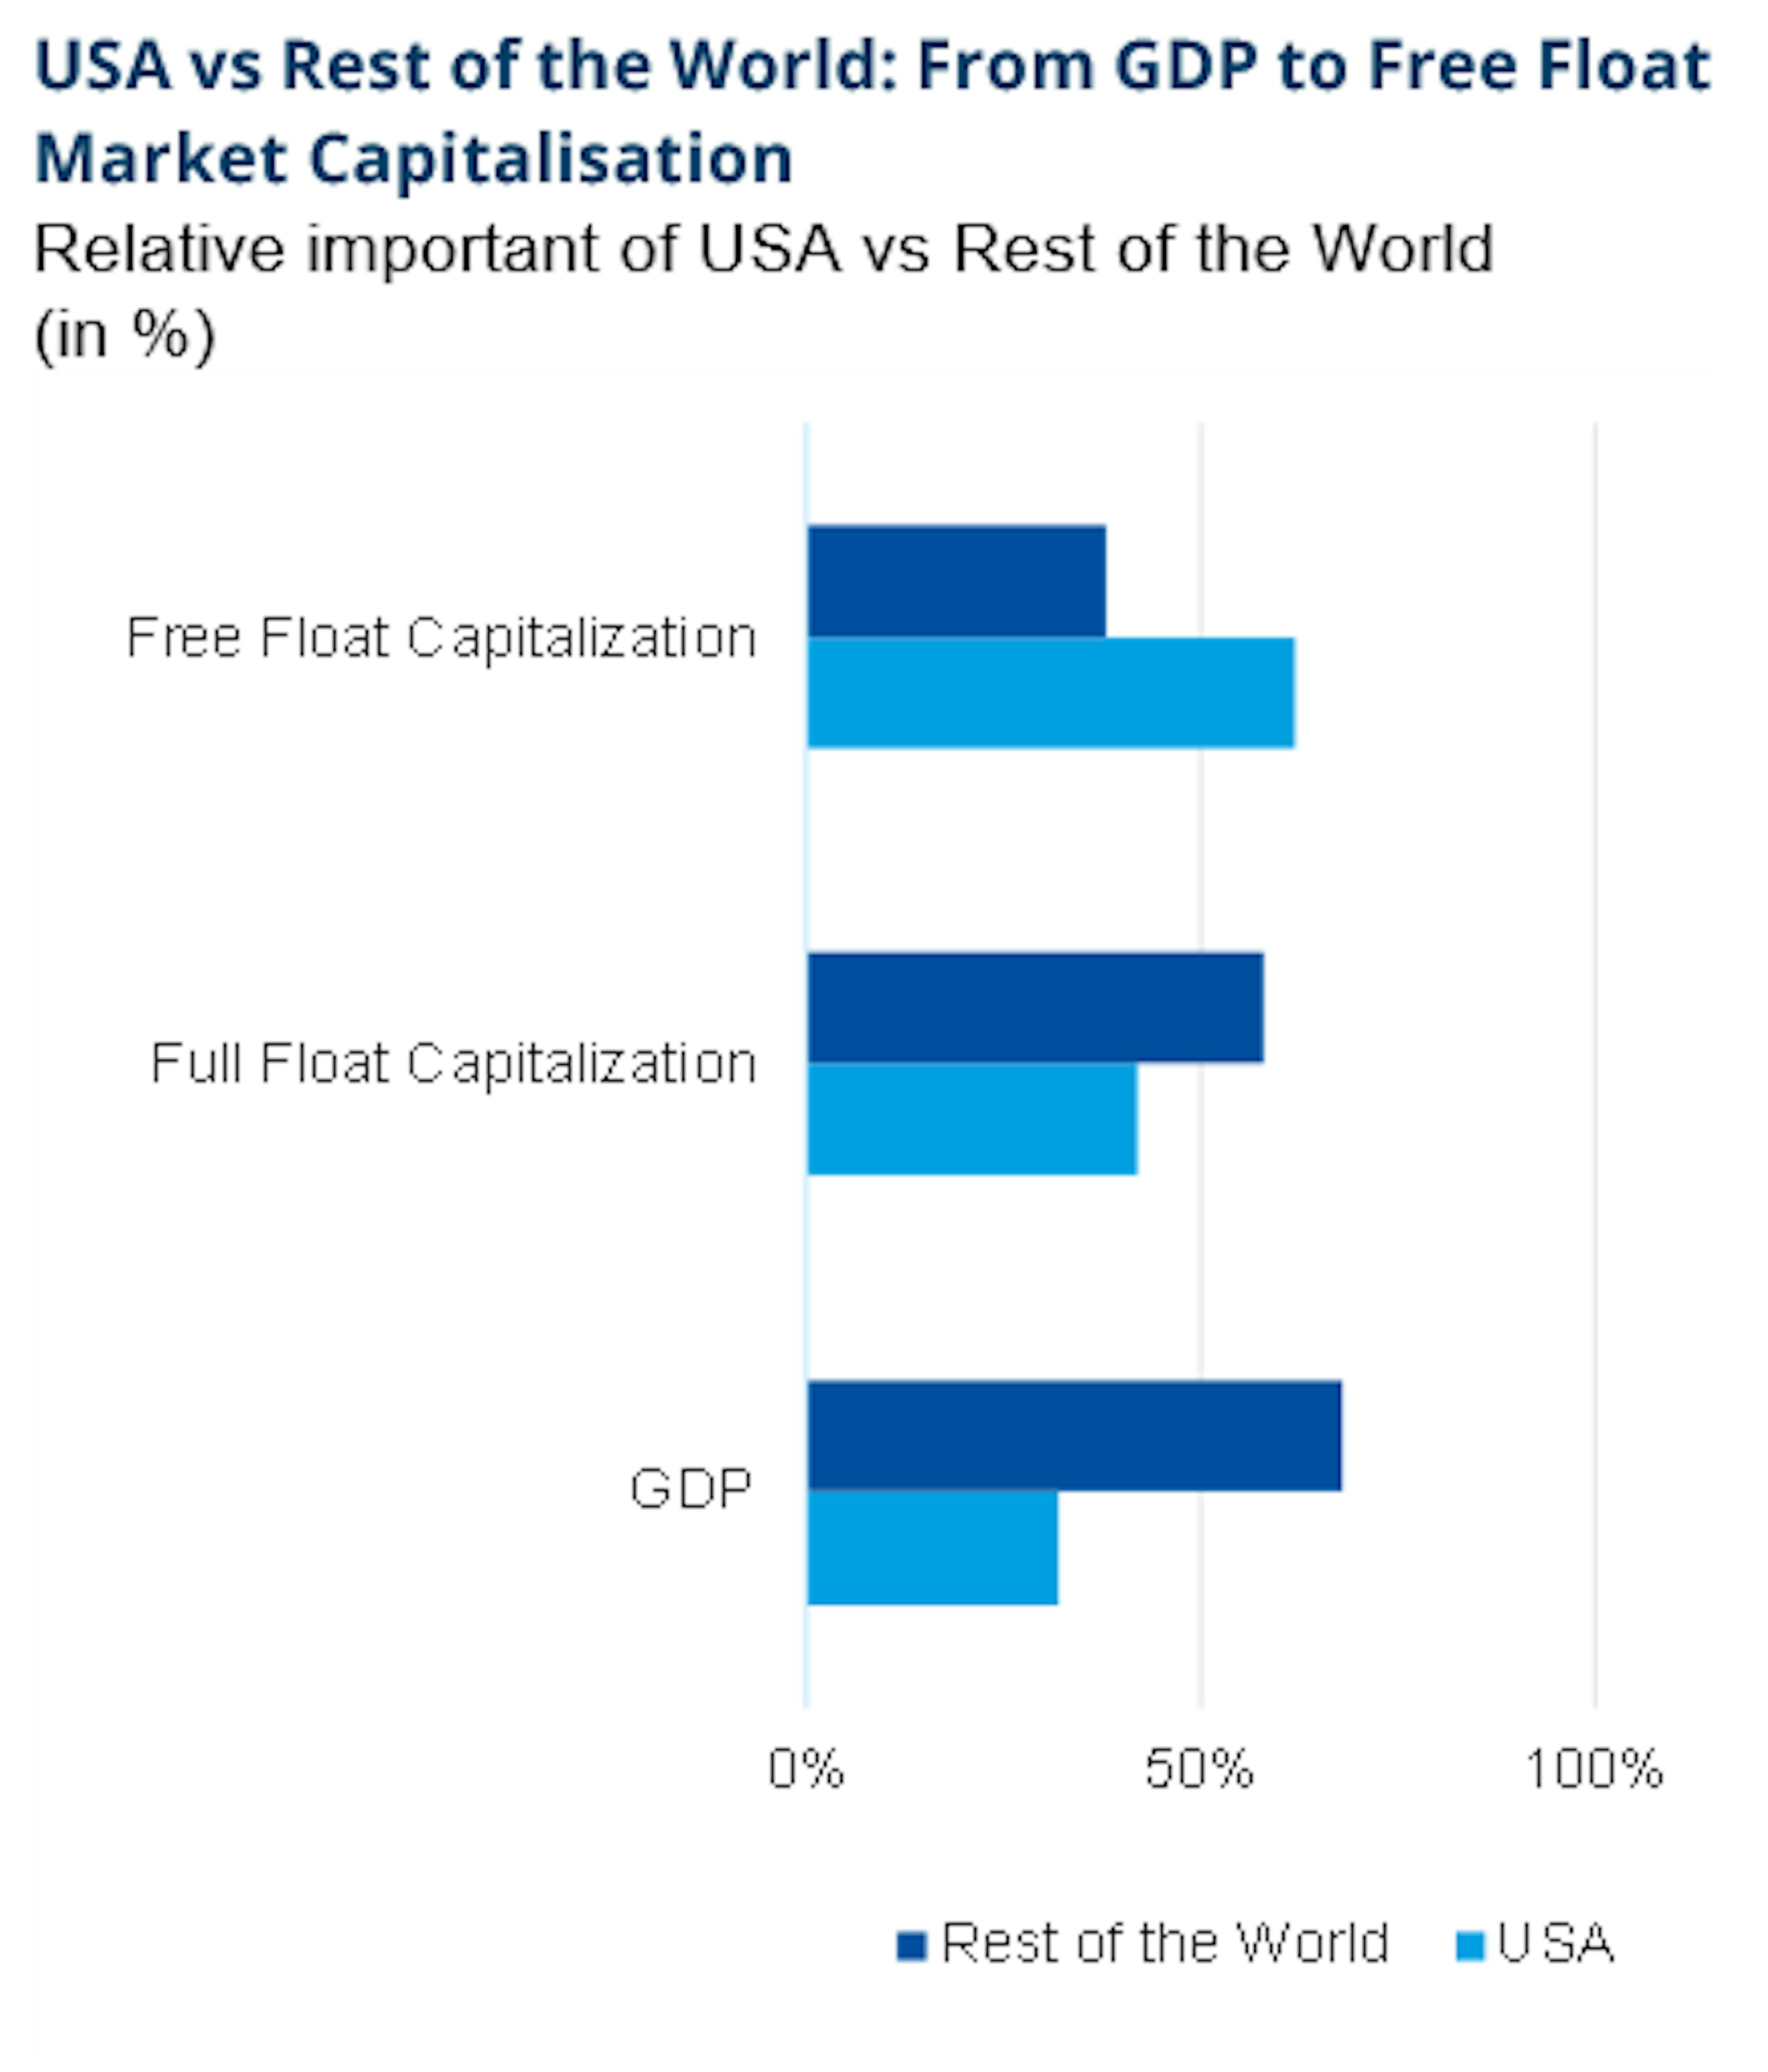
However, if we shift the perspective to weighting countries in an index based on their share of the global Gross Domestic Product (GDP)—the total value of goods and services produced by a country—the picture changes significantly.
For instance, while the U.S. dominates the MSCI World Index due to its large free float market cap, it only accounts for about 32% of global GDP⁶.
Source: MSCI, Amundi, “Rest of the World” stands for MSCI ACWI IMI (LON:IMI) (including Large, Mid and Small Caps). Data as at 30/08/2024. Past performance is not a reliable indicator of future performance.
This discrepancy raises a critical question: Is it logical to allocate to a stock merely based on its share price multiplied by the number of shares available for trading? This approach could result in investors being underweight on the non-US 68% of the global economy as measured by GDP.
This method might ignore potentially valuable investment opportunities in markets that are significant contributors to global economic output but are underrepresented in market cap-weighted indices due to smaller free float or less market liquidity.
Sector concentration
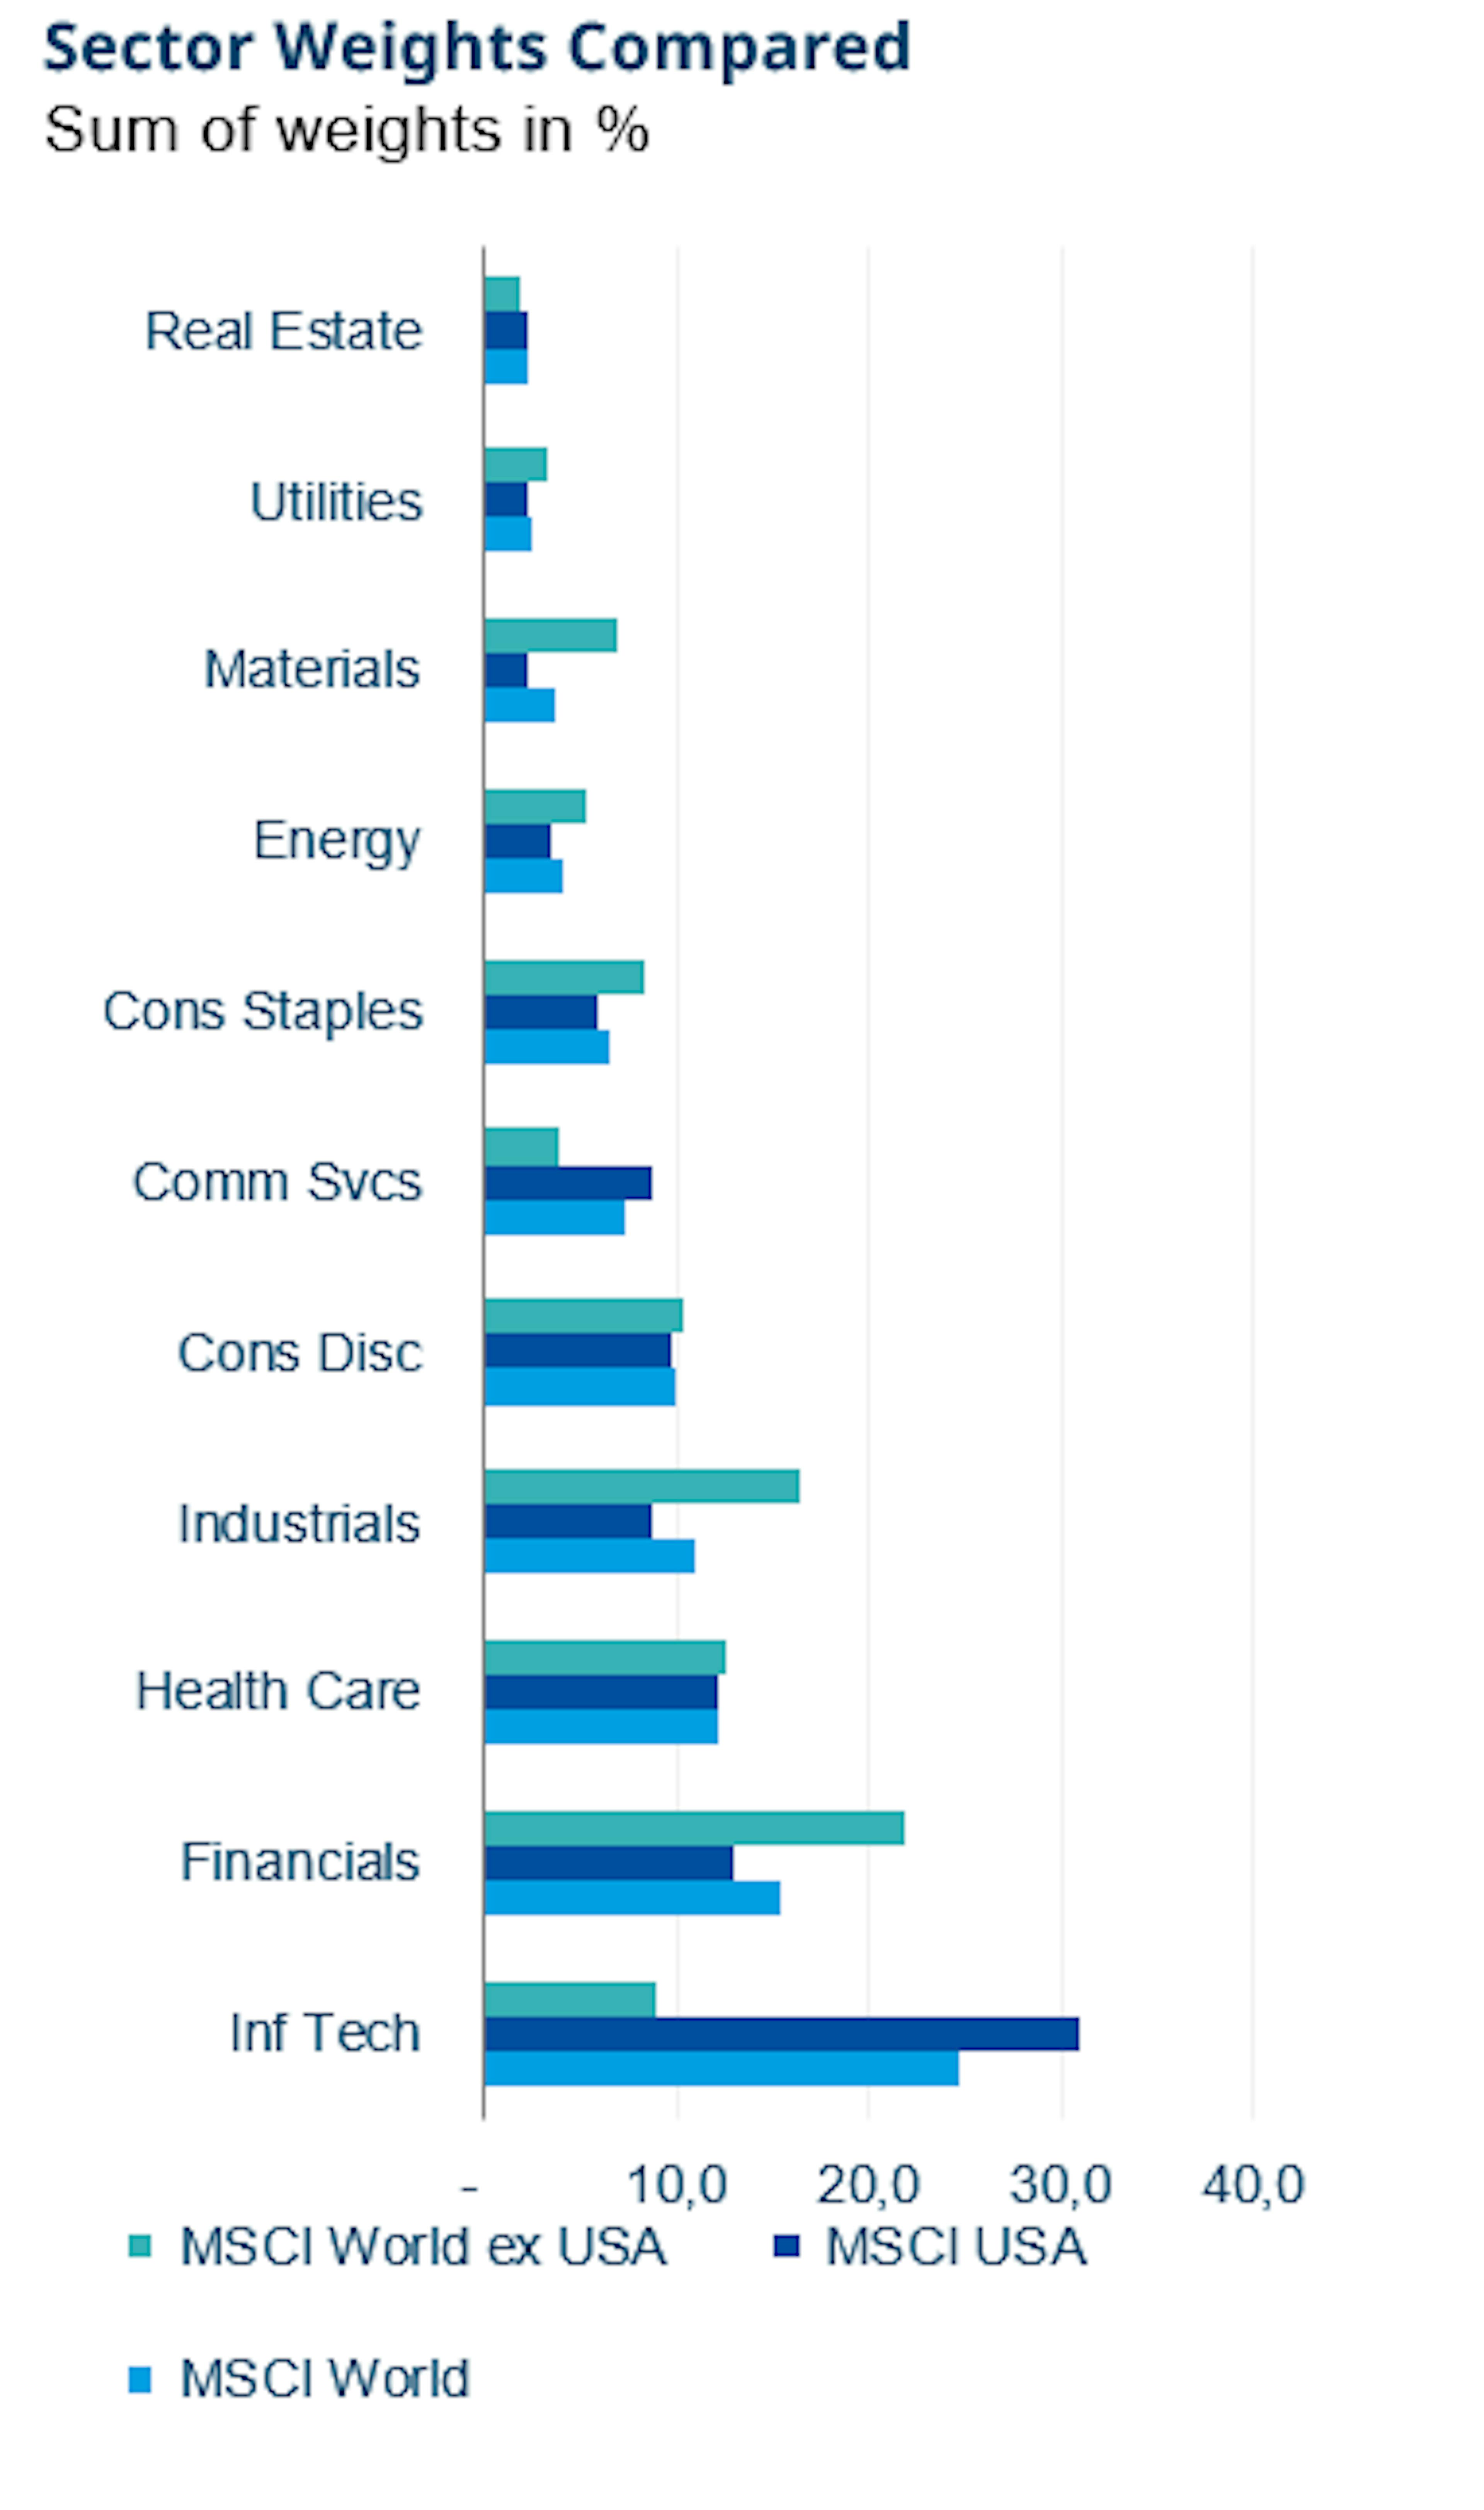
Finally, the overweight to U.S. equities within the MSCI World Index leads to significant sector concentration, with Information Technology accounting for about 25%⁷ due to the dominance of heavyweight stocks like Apple (NASDAQ:AAPL), Nvidia (NASDAQ:NVDA), and Microsoft (NASDAQ:MSFT). This sector bias reflects the tech-driven growth narrative prevalent in the U.S. market.
In contrast, the MSCI World ex-USA Index offers a more diversified sectoral breakdown. Financials emerge as the largest sector, followed by industrials, consumer discretionary, and consumer staples, with technology representing only 8.93%.
Source: Bloomberg, MSCI, Amundi. Data as at 30/08/2024. Past performance is not a reliable indicator of future performance.
This variation highlights different economic focuses and strengths across global markets, where other sectors besides technology play more significant roles.
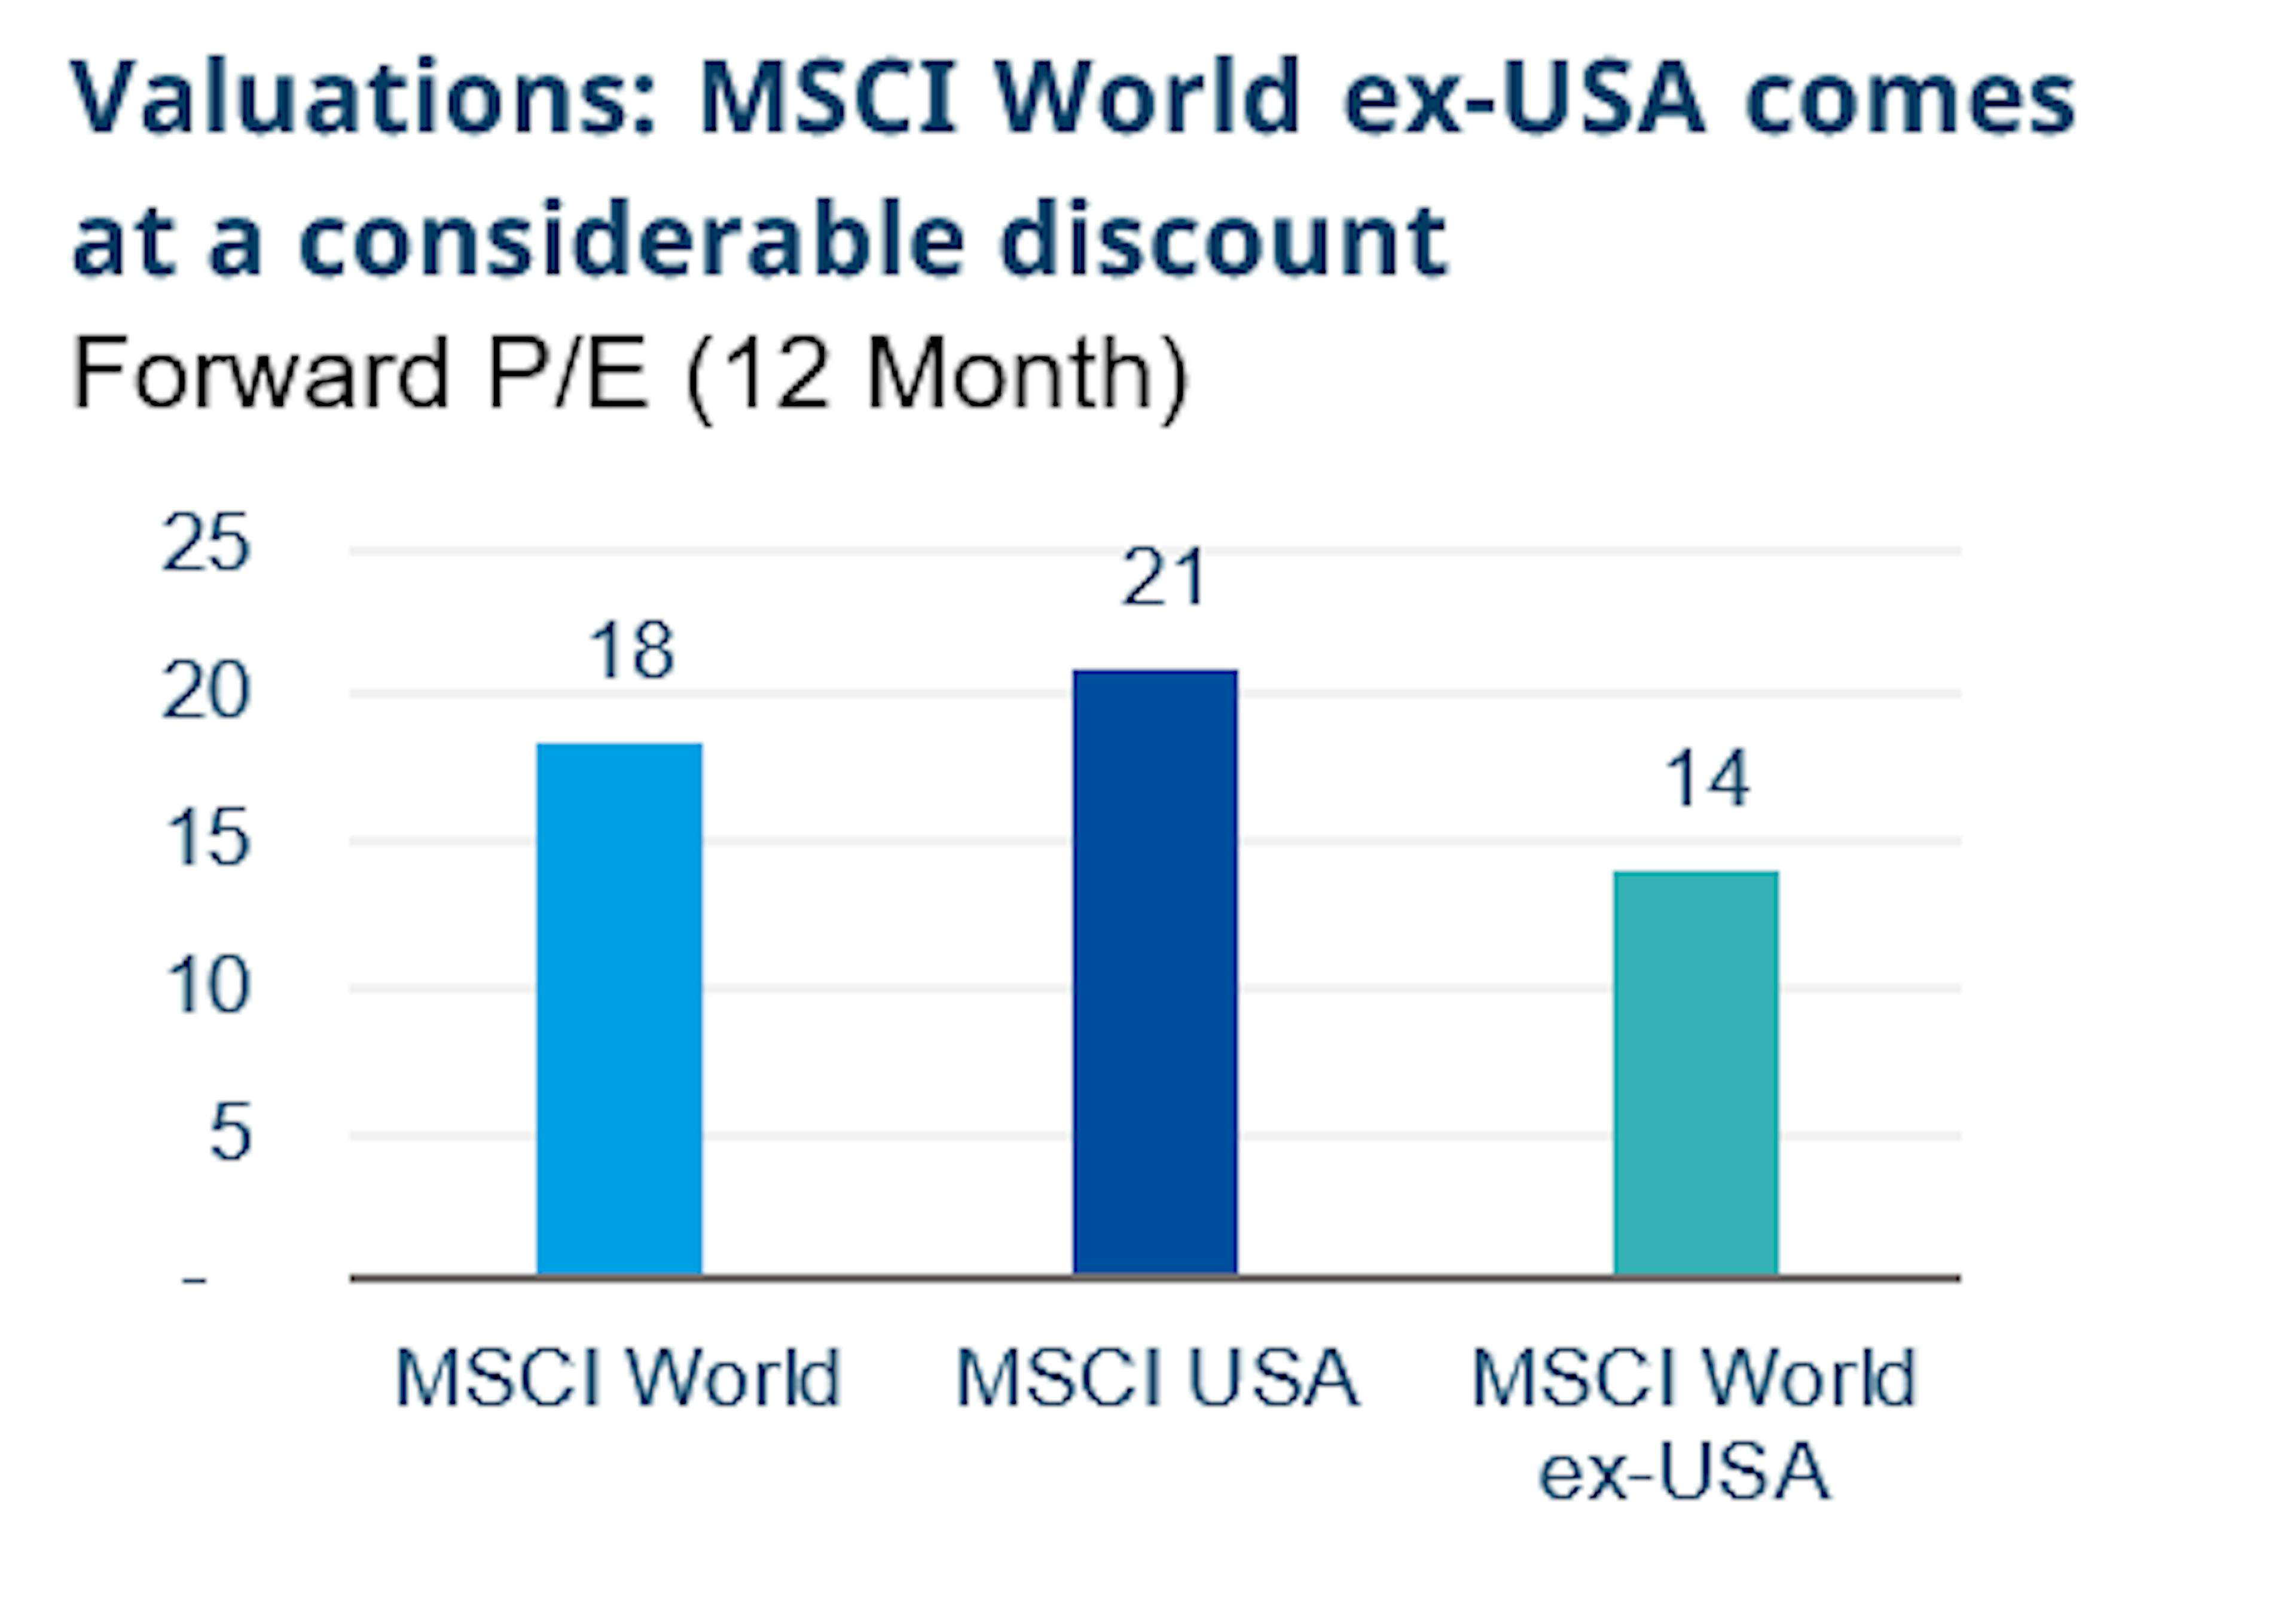
The complementary nature of U.S. and ex-U.S. market exposures in terms of sectors and cyclicality could also be crucial. The heavy tech exposure in the U.S. often results in higher market valuations due to growth expectations in the tech sector.
Source: Bloomberg, Amundi. Past performance is not a reliable indicator of future performance. Best consensus estimates as at 05/09/2024.
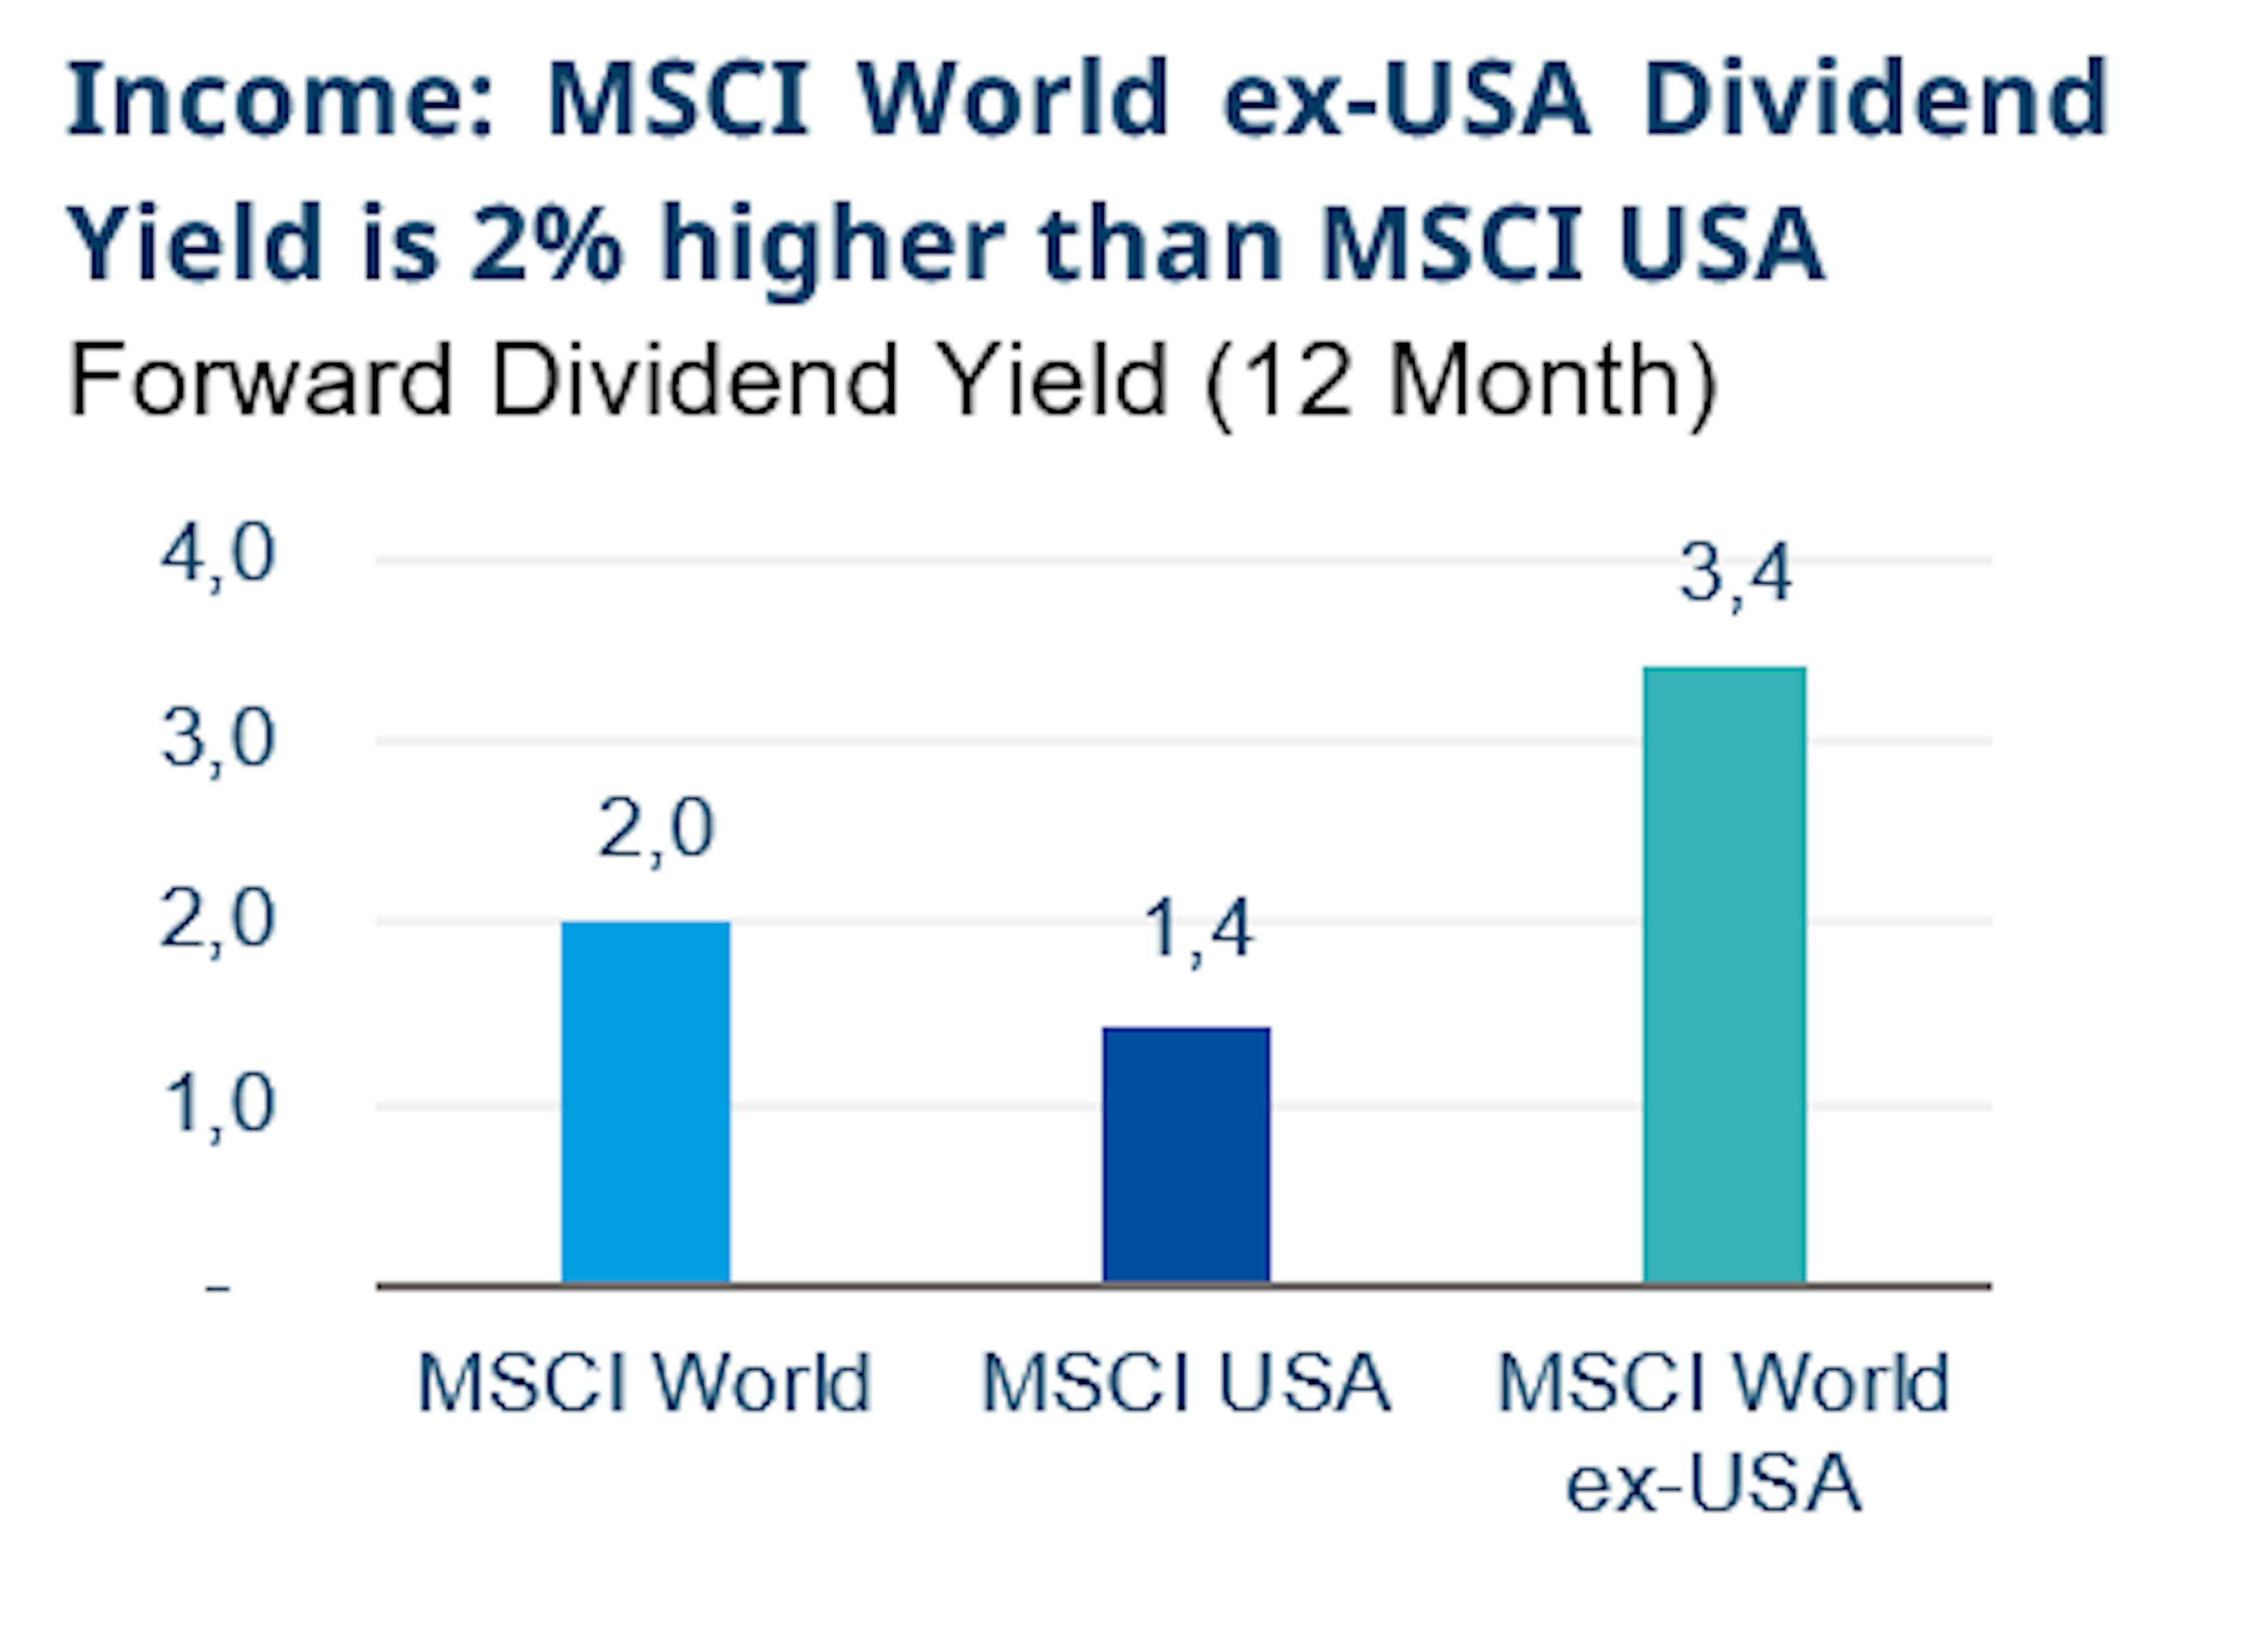
In comparison, the MSCI World ex-USA Index tends to have more reasonable valuations and a higher dividend yield, making it an attractive option for investors seeking cheaper developed market stocks and a way to offset the higher valuations and lower yields often found in U.S. markets.
Source: Bloomberg, Amundi. Past performance is not a reliable indicator of future performance. Best consensus estimates as at 05/09/2024.
Putting it into play
Regardless of your views on U.S. versus ex-U.S. markets, the flexibility of ETFs allows you to tailor your portfolio precisely to your preferences.
For those aiming for a balanced approach, one effective strategy is to maintain a 50/50 split between U.S. and international equities, rebalancing annually. This method capitalizes on the principle of buying low and selling high, potentially smoothing out volatility and enhancing returns over the long term.
For the U.S. side, the Amundi MSCI USA UCITS ETF (EPA:CU2U) offers exposure to the large and mid-cap segments of the U.S. market. It encompasses 601 constituents, representing about 85% of the free float-adjusted market capitalization in the U.S.⁸, with a low management fee* of 0.03%.
For a global exposure, the Amundi MSCI World Ex USA ETF (ETR:WEXE) covers equity markets in 22 developed countries outside the U.S.⁹, with a management fee* of 0.15%.
Combining these two ETFs not only ensures exposure to nearly the entire global equity market (excluding emerging countries) but also achieves this at a cost-effective rate. The weighted average management fee for these ETFs at a 50/50 allocation sits at just 0.09%.
Which stock to consider in your next trade?
AI computing powers are changing the Canadian stock market. Investing.com’s ProPicks AI are winning stock portfolios chosen by our advanced AI for Canada, the US, and other exciting markets around the globe. Our top strategy, Tech Titans, nearly doubled the S&P 500 in 2024 - one of the most bullish years in history. And Beat the TSX, designed for broad market exposure, is showing +878% gains with 10 years’ back-tested performance. Which Canadian stock will be the next to soar?
Unlock ProPicks AI
