- Various narratives aim to explain the tech rout
- Gold and dollar retest crucial supply-demand strongholds
- Oil falls below $40
Though US equities rebounded somewhat on Friday, after a sharp, tech sector-led mega cap selloff on Thursday, the S&P 500, NASDAQ, Dow Jones and Russell 2000 still all finished in the red for a second day, ending trade at a two-week low. As well—and not surprising—volatility returned to Wall Street as the week came to a close.
It was the wildest ride for investors since June, across a broad variety of asset classes, but technology shares provided the most brutal roller coaster drop.
Tech Sector Plunge With No Obvious Trigger
While the S&P 500 Index trimmed a 3% drop to an 0.8% loss on Friday, the NASDAQ indices fell more than 5% after just the first two hours of trade. Both the Composite and the NASDAQ 100 each pared the drop to -1.27%.
Holders of the biggest technology companies required the strongest nerves. Apple (NASDAQ:AAPL) plunged as much as 8.1%, yet managed to finish in the green, up 0.07%. Those trading other big names weren’t as lucky. Alphabet (NASDAQ:GOOGL) closed 3.1% in the red, followed closely by Facebook (NASDAQ:FB), which lost 2.9% of value.
Financials continued to outperform, even amid the tech rout, offsetting losses on the broader index. The sector climbed 0.75%, providing a boost to the benchmark along with Industrials, (+0.25%) and Materials, (+0.06%). However, the remaining sectors all closed lower, with Communication Services the laggard, (-1.8%), followed by Technology (-1.4%).
Narratives vary regarding what triggered the selloff. There's no obvious catalyst, but suspected culprits range from algos, to options, to simply good old-fashioned profit-taking for stocks that have been stretched out.
This makes sense to us since prior to last week, the SPX climbed for four weeks in a row, buoyed by tech equities to new records.
A possibile explanation: sector rotation, where investors shift out of an overbought segment, in order to take their profits and bet on an oversold segment of the market. Should that prove true, it could be the best thing for the equity market—by driving a healthy, sustainable uptrend as participants adapt to cyclical trends. Otherwise, the market will simply form a bubble, which will eventually burst.
That's not to say that after weak hands have been shaken out technology stocks can’t keep advancing. After all, we're living in a work-from-home environment which should be highly positive for tech. In fact, even when the pandemic is eradicated, it's likely the world we once considered normal will have changed forever, with jobs restructured to allow employees to work from home more frequently, or even regularly.
As readers know, we have been stubbornly bearish, notwithstanding the exuberant rally. We continue to believe it was disconnected from economic fundamentals. After all, during the same quarter when the best returns in decades were posted, US GDP came in at an abysmal -32%, the largest quarterly decline on record, more than triple the previous worst US quarter, post World War II, (Q1 1958) and four times larger than the worst quarter seen during the 2008/2009 financial crisis.
We continue to argue that investors have been reading too much into future growth after the wildly better-than-expected data. And we keep reminding everyone that just recently we also saw the fastest bear market drop and rebound and the worst recession since the Great Depression.
Coronavirus worries—which remain ongoing, at least until a vaccine or cure has been found—may have fueled the descent, but what drove the seeming recovery is equally clear, aggressive fiscal and monetary stimulus by governments and central banks. And since it's unprecedented, no one can know how far we can rely on factors for a continued uptrend.
Still, technicals signal the S&P 500's rally may not be over just yet.
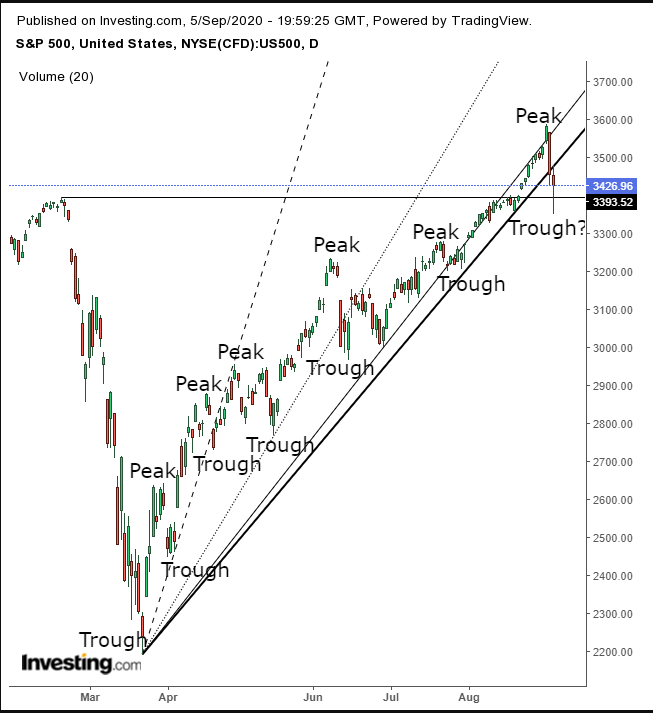
After besting the level hit on Feb. 19, the uptrend was officially extended when a new high was established on Aug. 18. Note though, that despite the sharp selloff, the index found support by the previous record-high. On the other hand, it fell below its uptrend line since the March bottom and the MACD flashed a sell signal, but to be fair two previous signals from the MACD proved incorrect.
So, though the price fell below its uptrend on Friday, we're not excited by the move. This isn’t the first time the index has slipped below the line that connects the lows from the bottom of the trend. The benchmark has already dipped below three previous uptrend lines.
What's key is the direction of the peaks and troughs. And so far, not one has failed. So we're placing our faith in that for now.
This doesn’t mean that we're no longer anxious about what we’ve expressed above about the market's optimistic divergence from other, more pessimistic fundamentals. And we're also concerned by a long-term Broadening Pattern, visible via the SPX's monthly chart, which connotes a big move upcoming. Plus, classic literature puts this pattern at market tops.
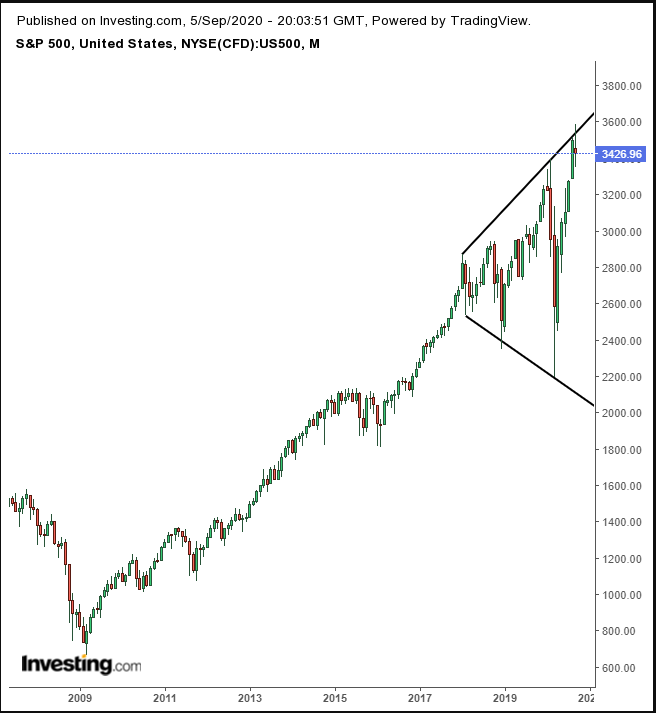
However, such patterns tend to develop over months, while this one has been in the making for years, since January 2018. It’s noteworthy that last week's selloff came after the price attempted to penetrate the top of the pattern, demonstrating the importance of that trend line.
Only after the price will penetrate the top boundary of this pattern and find support above it—specifically after forming an ascending peak-trough formation above it—would we stop caring about this pattern. Still, there will always be reasons to second-guess the market, but as long as the trend remains higher, we'll stick with that.
That doesn't mean, however, that we won't continue monitoring for red flags. Indeed, we've been focusing on the following three: the VIX, yields, including for the 10-year note and gold.
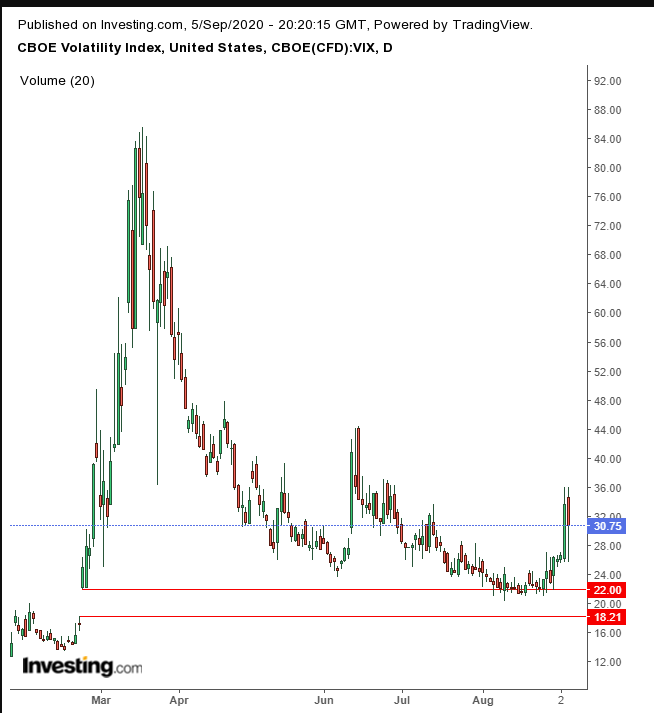
The VIX has yet to fall below the rising gap, corresponding to the Feb. 24 falling gap for equities. This means investors remain scared. As such, the index has managed to only close within the gap on a single day since.
Despite the best quarter for stocks in decades and a string of records, yields remain depressed, hovering near record lows, demonstrating that Treasuries continue to be in demand.
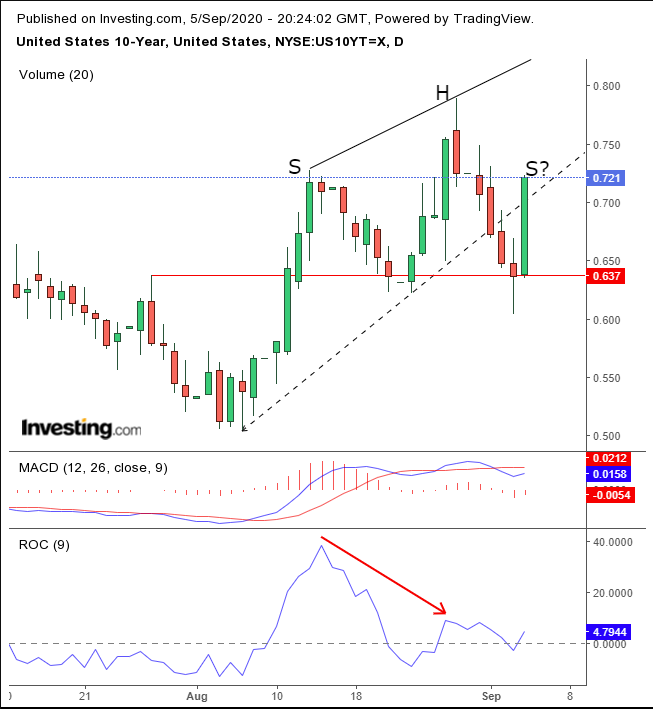
Are yields forming a H&S top? The MACD stubbornly returned to a sell signal and the ROC registered a blatant negative divergence, when momentum didn’t follow yields higher, showing a weak rally, which may turn out to be the head of the reversal pattern.
On Aug. 7, gold hit its first record high since Aug. 22, 2011, just 15 days shy of a full nine years at lower prices.
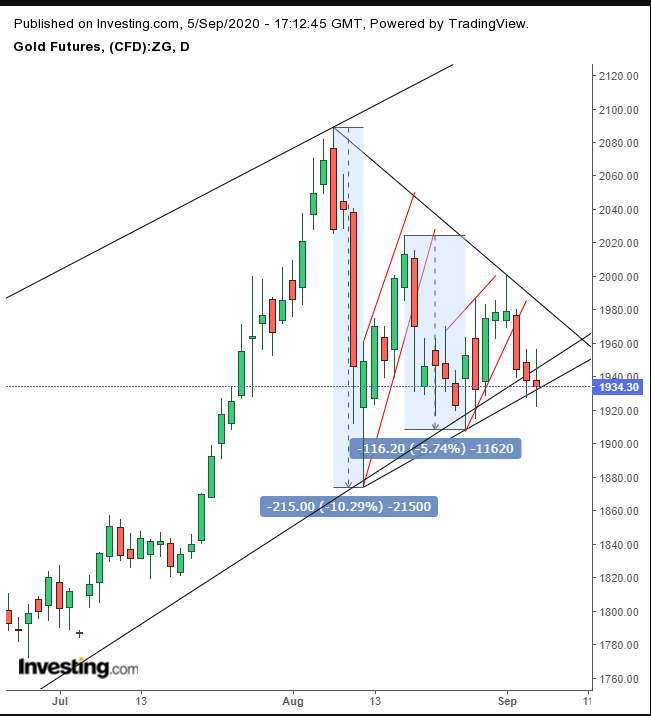
The yellow metal is severely testing the bottom of its rising channel since the March bottom, together with equities and potentially completing back-to-back rising flags (blue) whose downward pressure is testing the bullish pennant (red).
So, while these three markets are raising significant red flags, the development isn't new...they have been doing for a while now. Our current philosophy, keep an eye on the flags but trust the trend.
In other news, on Friday, the Dollar Index ended a three day rally.
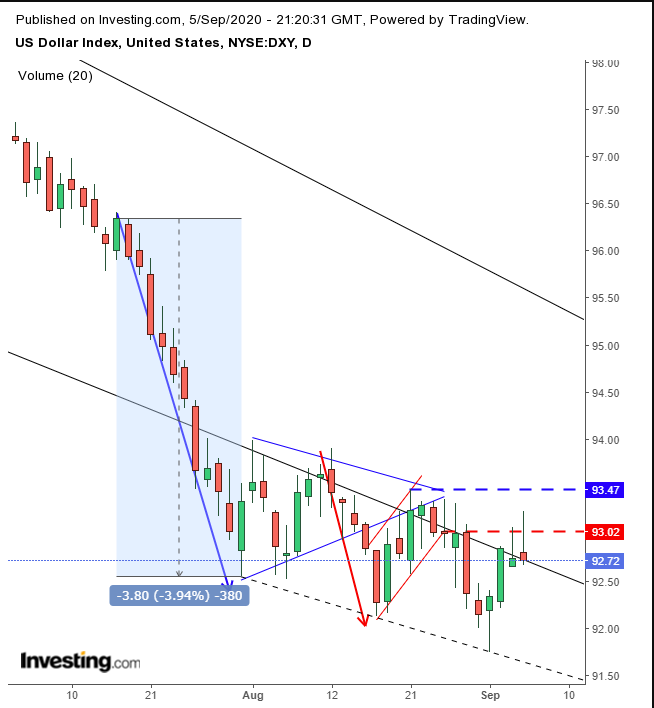
This was confirmed with back-to-back shooting stars hitting the resistance of a rising flag (red), following a bearish pennant (blue) below the falling channel since the March top, which appears to be cementing the top of a lower falling channel. However, the near -4% plunge before the pennant demands a much sharper downturn.
Oil sold off for the third day as the trading week came to a close, falling below $40, for the first time since July 9, as the pandemic keeps drivers off the streets, exacerbating weak demand.
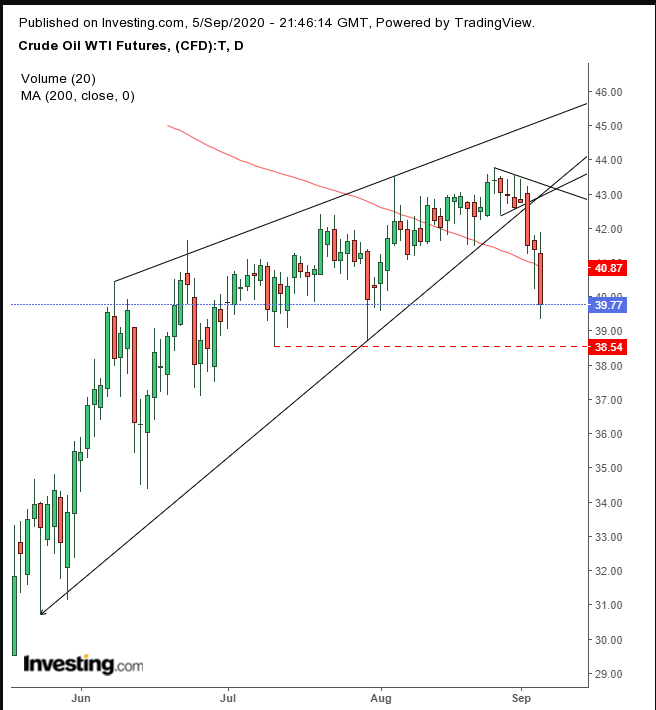
Technically, on Wednesday, what could have been a bullish pennant blew out. Price crossed below an uptrend line since May 22 as well as the 200 DMA on Friday. The $38 level seems to be a crucial support.
Week Ahead
All times listed are EDT
Monday
US, Canada markets closed for the Labor Day holiday
19:50: Japan – GDP: expected to plunge to -8.1% from -0.6%.
Tuesday
21:30: China – CPI: anticipated to drop to 0.4% from 0.6% previously.
Wednesday
8:00: US – EIA Short-Term Energy Outlook
10:00: US – JOLTs Job Openings: seen to edge higher to 6.000M from 5.889M.
10:00: Canada – BoC Interest Rate Decision: forecast to remain steady at 0.25%.
Thursday
7:45: Eurozone – ECB Interest Rate Decision: predicted to remain at 0.00%.
8:30: US – Initial Jobless Claims: previously printed at 881K.
8:30: US – PPI: forecast to fall to 0.2% from 0.6%.
8:30: Eurozone – ECB Press Conference
11:00: US – Crude Oil Inventories: likely jumped to -1.887M from -9.362M.
Friday
2:00: UK – GDP: consensus calls for -21.7% from -1.7% YoY.
2:00: UK – Manufacturing Production: expected to plummet to 5.0% from 11.0%.
8:30: US – Core CPI: to decline to 0.2% from 0.6%.
Which stock should you buy in your very next trade?
With valuations skyrocketing in 2024, many investors are uneasy putting more money into stocks. Unsure where to invest next? Get access to our proven portfolios and discover high-potential opportunities.
In 2024 alone, ProPicks AI identified 2 stocks that surged over 150%, 4 additional stocks that leaped over 30%, and 3 more that climbed over 25%. That's an impressive track record.
With portfolios tailored for Dow stocks, S&P stocks, Tech stocks, and Mid Cap stocks, you can explore various wealth-building strategies.
