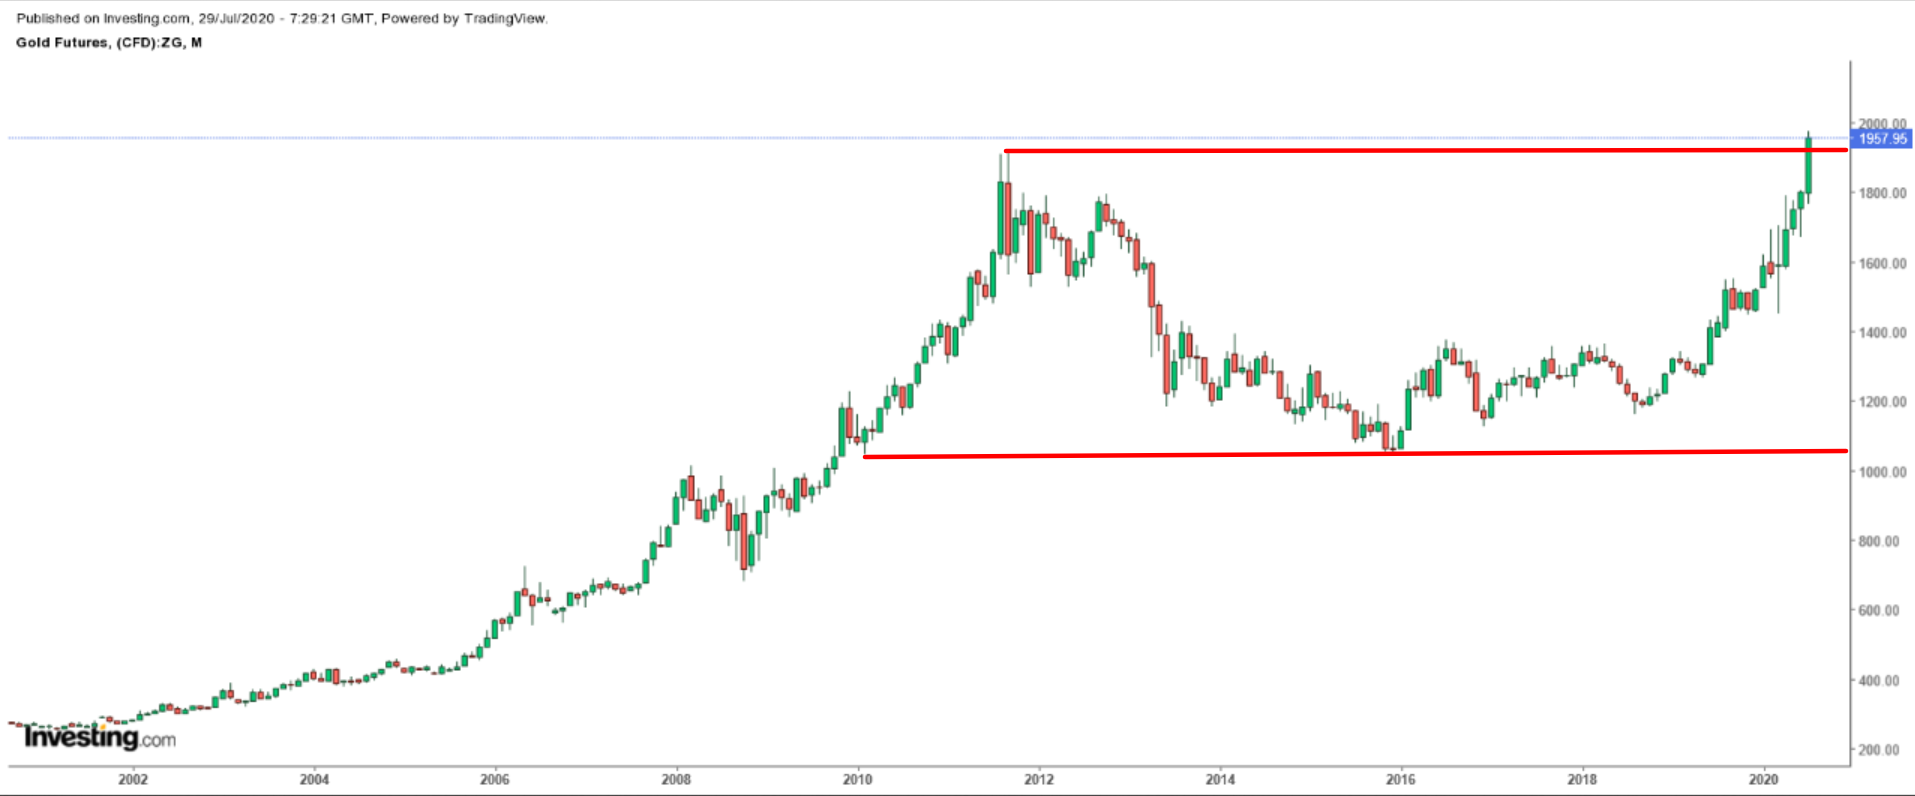
Gold bulls are back in control as prices of the precious metal rallied to their highest level on record earlier this week, $1,974.70, surpassing its previous record peak from September 2011.
Comex gold futures, which are up almost 25% this year, are trading at $1,955.50 at the time of writing, boosted by the increasingly uncertain economic outlook, low interest rates and a flood of stimulus from the Federal Reserve and US government. As a result, the yellow metal is closing in on the never-before-seen $2,000-mark.
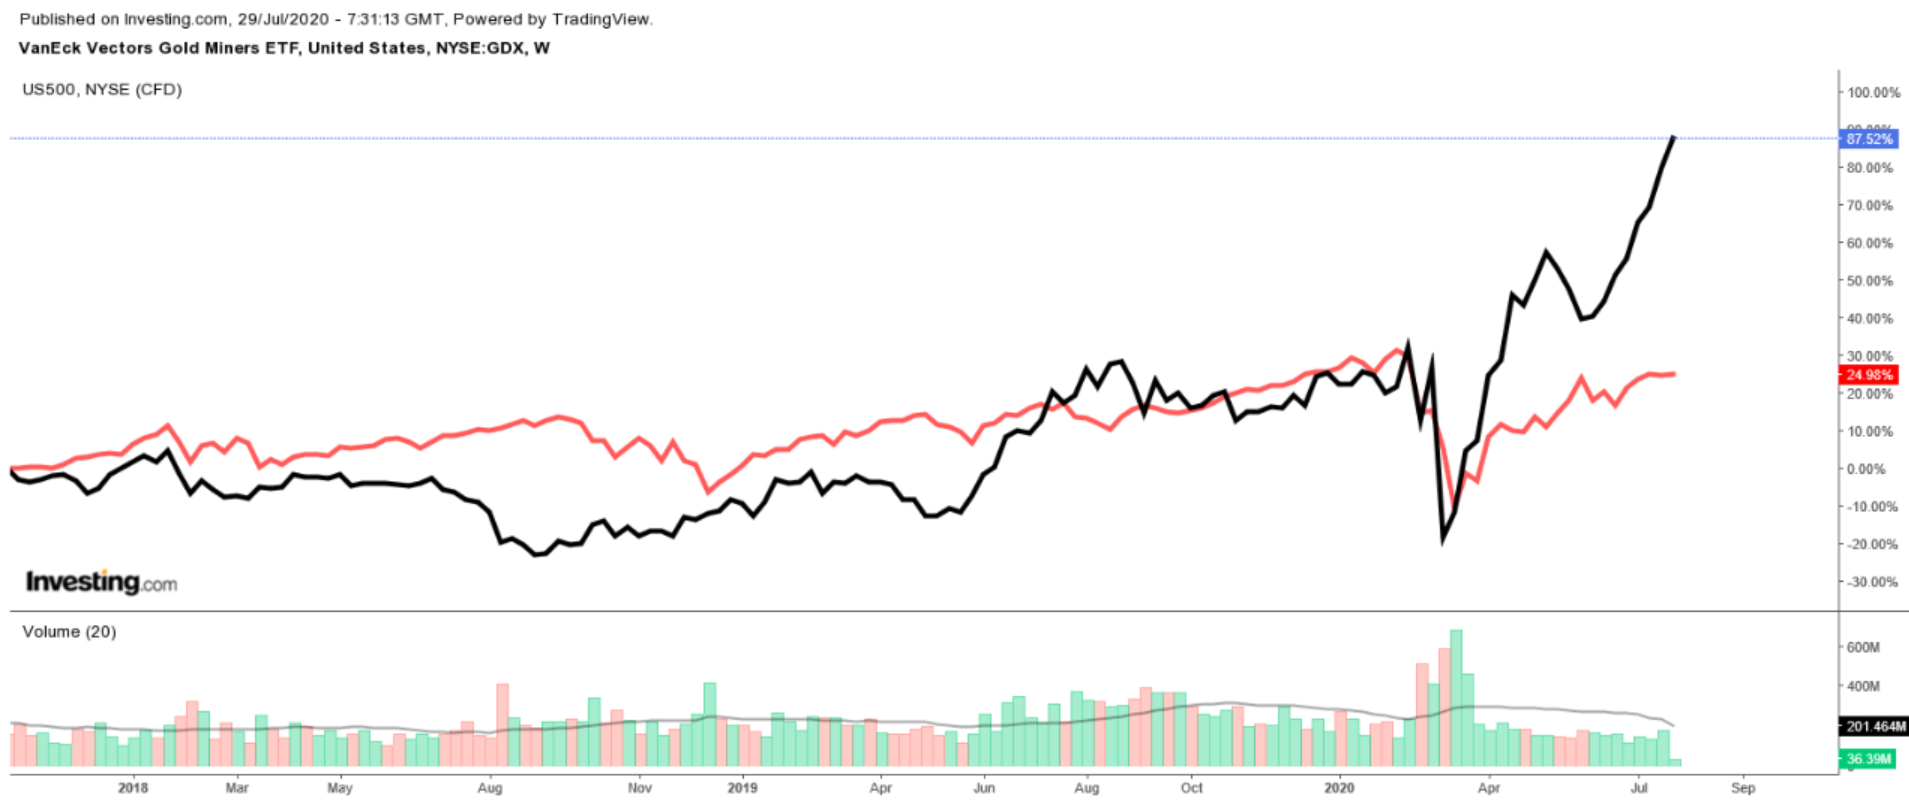
Not surprisingly, gold miners have significantly outperformed the broader market this year. Gold-related ETFs have been soaring in tandem with the precious metal itself, with the VanEck Vectors Gold Miners ETF (NYSE:GDX) up around 169% since its March low, compared to the S&P 500’s roughly 47% gain over the same period.
Below we take a look at three gold miners that are set to report explosive earnings growth in the coming weeks thanks to the surge in gold prices.
1. Newmont Goldcorp Reports July 30 Before Markets Open
- Q2 EPS Growth Estimate: +158% YoY
- Q2 Revenue Growth Estimate: +5% YoY
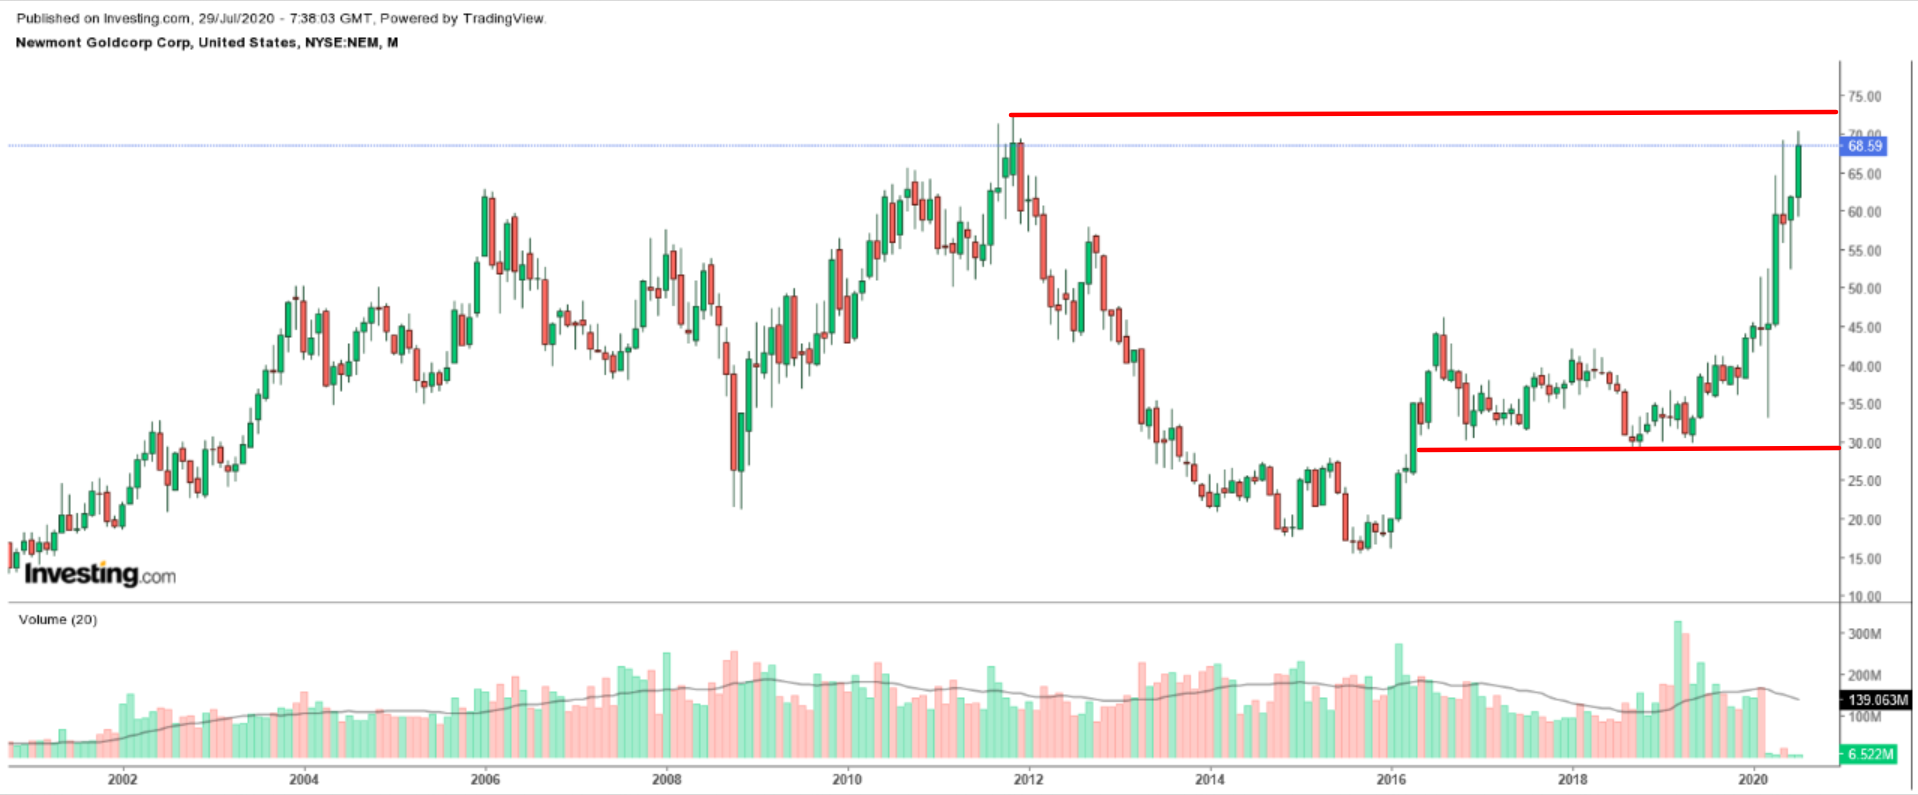
Newmont Goldcorp (NYSE:NEM)—the world’s largest gold producer by market value, output and reserves—has seen its stock outperform the broader market in recent months. Shares sky-rocketed around 108% since its bear market low in March, more than doubling the S&P 500’s gain during the same time frame.
The stock, which reached its highest level since November 2011 at $70.30 at the start of the week, ended at $68.59 on Tuesday, giving the Greenwood Village, Colorado-based corporation a valuation of $55 billion.
Already last quarter, Newmont earnings rose more than ninefold compared to the previous year. The miner next reports results before the opening bell on Thursday, July 30.
Consensus calls for earnings per share of $0.31 for the second quarter, which would mark a year-on-year advance of 158% from earnings of $0.12 per share in the year-ago period. Revenue is forecast to climb 5% from the same period a year earlier to $2.38 billion, benefitting from both the sharp spike in gold prices as well as higher production volumes.
In addition to the top- and bottom-line numbers, investors will keep an eye on Newmont’s update regarding its outlook for gold output throughout the rest of the year and beyond. The company recently forecast between 6.2 million and 6.7 million ounces per year in production through 2024.
2. Kirkland Lake Gold Reports July 30 Before Markets Open
- Q2 EPS Growth Estimate: +44% YoY
- Q2 Revenue Growth Estimate: +105.5% YoY
Kirkland Lake Gold (NYSE:KL) shares have shot up 181% since falling to a recent low on March 16. The stock hit an all-time high of $51.30 on Monday, before settling at $50.64 yesterday, giving the Toronto-based company a market cap of around $10.6 billion.
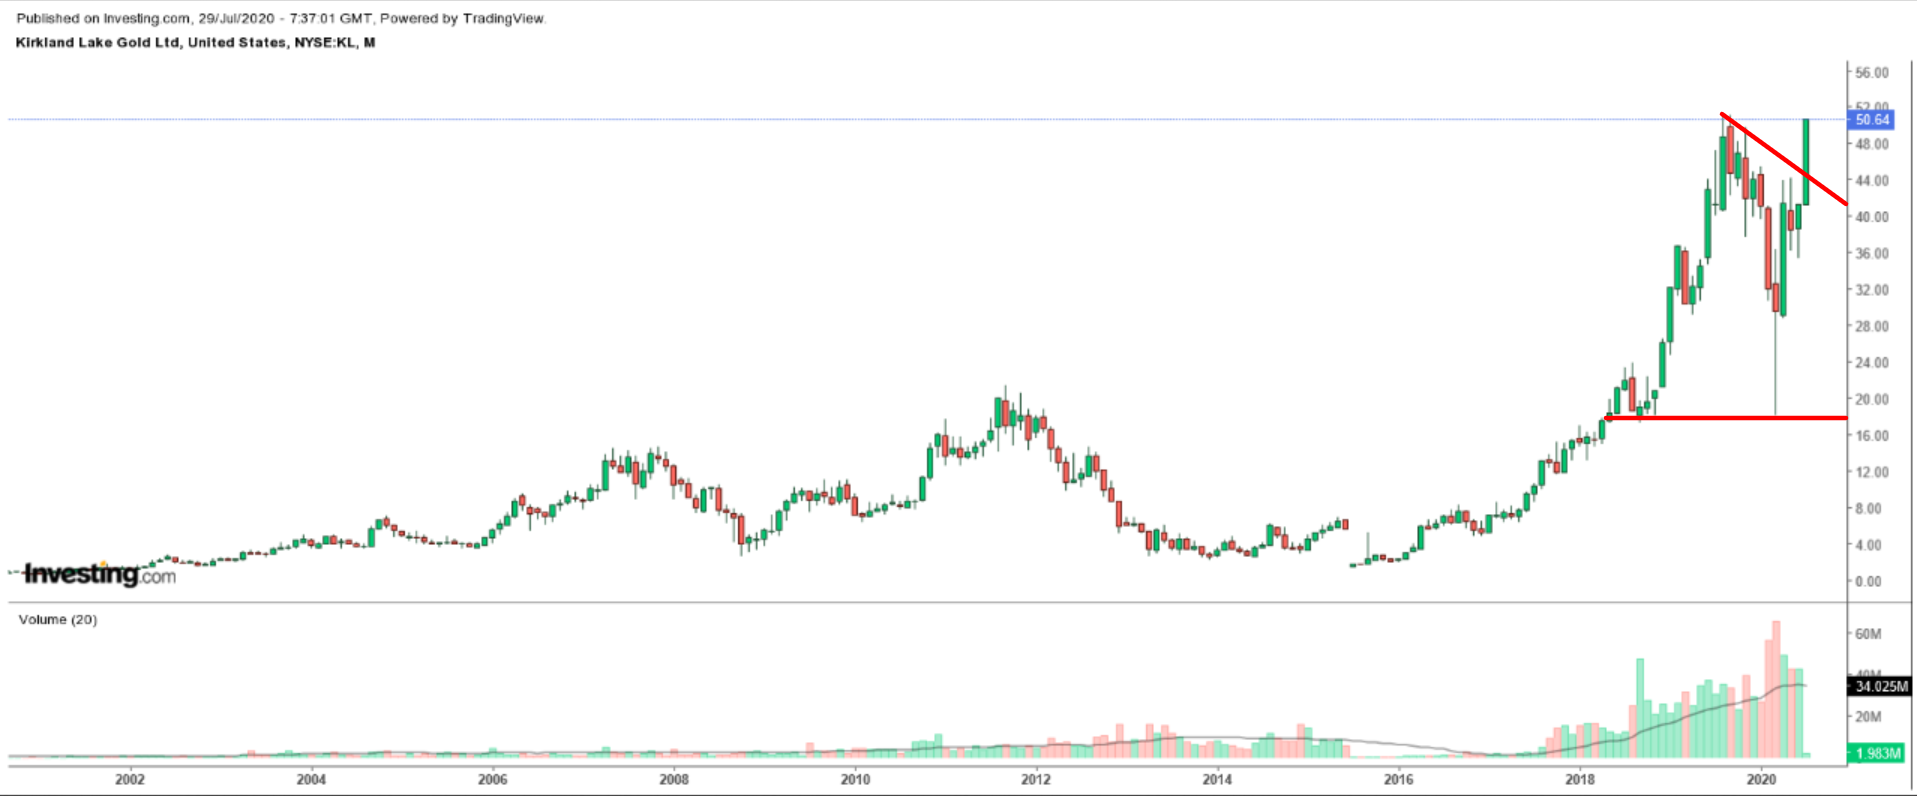
Kirkland Lake’s second quarter results, due Thursday, July 30 before the U.S. market opens, are expected to have benefited from the sharp spike in gold prices as well as soaring production volume.
Consensus calls for earnings per share of $0.72 for the second quarter, which would mark a year-on-year increase of 44%. Revenue is forecast to surge 105% from the same period a year earlier to $578.16 million.
In a promising sign, the Canadian miner announced production results for its second quarter on July 7, which showed output jumped 54% from the year-ago period to 329,770 ounces. For the first half of 2020, the company produced 660,634 ounces, up 48% from the first half of 2019.
Kirkland Lake reported that "gold sales reportedly totaled 341,390 ounces at an average realized price of $1,716 per ounce, compared to gold sales of 212,091 ounces at an average realized price of $1,320 per ounce in the same period a year earlier."
3. Barrick Gold Reports August 10 Before Markets Open
- Q2 EPS Growth Estimate: +100% YoY
- Q2 Revenue Growth Estimate: +43% YoY
Shares of Barrick Gold (NYSE:GOLD), the world's second-biggest gold miner, have been on a tear lately, jumping 133% since hitting a recent low in mid-March. The stock, which rallied to a seven-year high of $30.20 on Monday, closed at $29.59 last night, giving the Toronto-based miner a market cap of $52.6 billion.
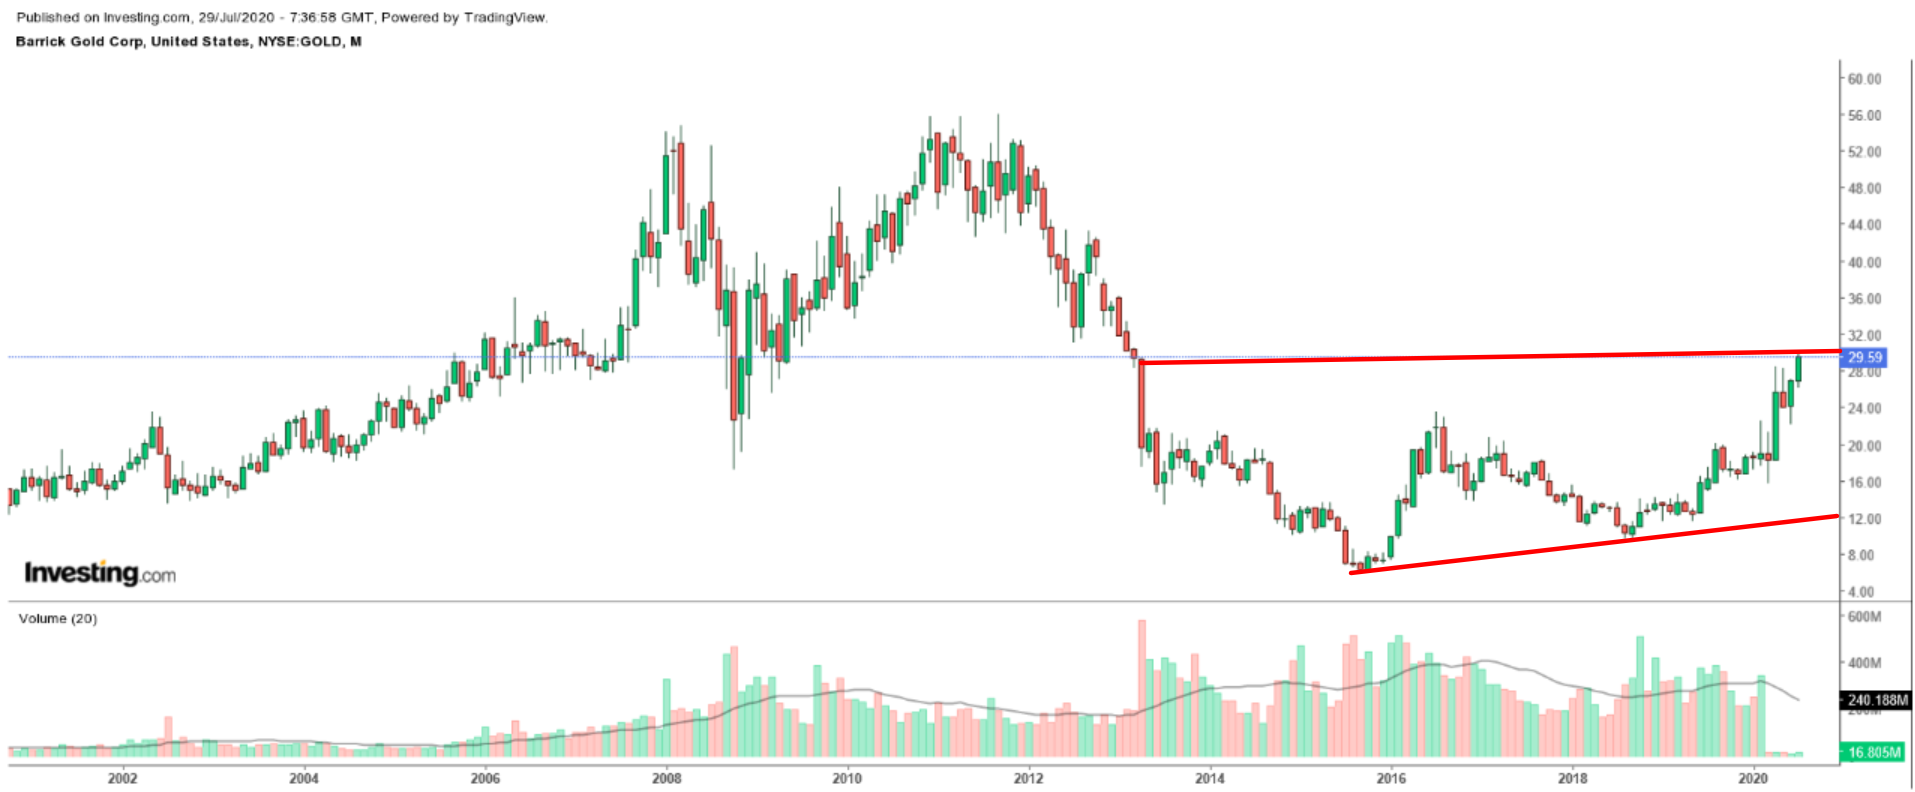
Barrick reported a nearly 55% rise in profit in the first quarter and is scheduled to release second quarter results on Monday, August 10 ahead of the open.
Consensus estimates call for earnings of $0.18 per share, which would indicate a YoY EPS growth rate of 100%. Revenue is expected to soar roughly 43% from the same period a year earlier to $2.94 billion, thanks to higher gold prices and increased production.
In addition to EPS and revenue, investors will also focus on Barrick’s production forecast for the quarters ahead. The Canadian company lowered its annual gold output guidance at the end of the first quarter to 4.6-5.0 million ounces versus 4.8-5.2 million previously due to a mine closure in Papua New Guinea.
Its net debt will be another key metric to watch as ongoing cost-cutting efforts are likely to boost the corporation's bottom line in the quarters ahead.
