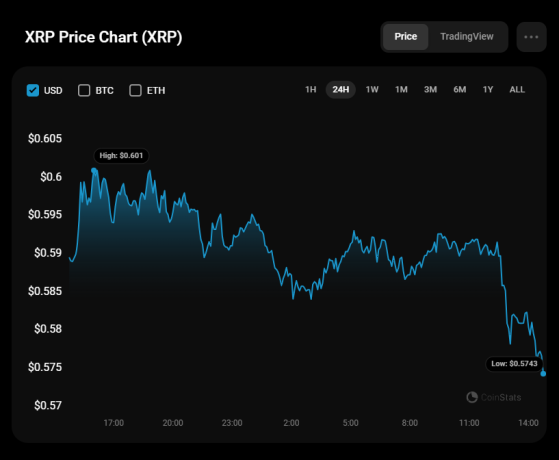
U.Today - The last day of the week started bullish for most coins, however, bears seized the initiative later, according to CoinStats.
XRP chart by CoinStats
XRP/USD
The rate of XRP has gone down by 3.71% since yesterday. Over the last week, the price has risen by 5.62%.
Image by TradingViewOn the hourly chart, the price of XRP is setting new local lows. If the bar closes below the support of $0.5760, the correction is likely to continue to the $0.56 range soon.
Image by TradingViewSellers are also powerful on the daily time frame. One should pay attention to the interim level of $0.5656. If a breakout happens, the accumulated energy might be enough for a continued downward move to the $0.55 area.
Image by TradingViewOn the weekly time frame, the rate of XRP is far from the support and resistance levels.
As neither side is dominating, ongoing sideways trading in the wide range of $0.56-$0.66 is the more likely scenario until the end of the month.
XRP is trading at $0.5756 at press time.
This content was originally published on U.Today

