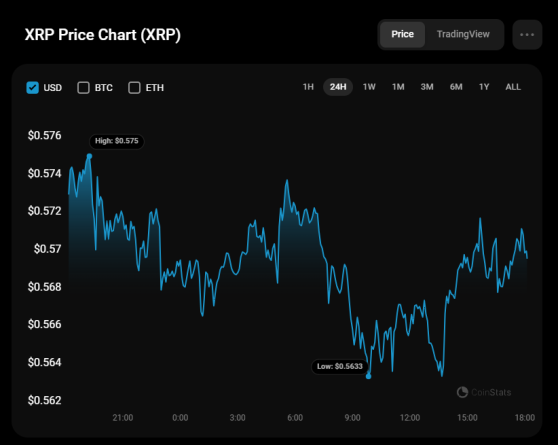
U.Today - The market remains under sellers' pressure, according to CoinStats.
XRP chart by CoinStats
XRP/USD
The price of XRP has declined by 0.58% over the past day.
Image by TradingViewOn the hourly chart, the rate of XRP is in the middle of the local channel, between the support of $0.5624 and the resistance of $0.5742.
As neither buyers nor sellers are dominating, ongoing sideways trading is the more likely scenario until the end of the day.
Image by TradingViewOn the bigger time frame, one should pay attention to the nearest support level of $0.5627. If the price comes back to it, that might be a prerequisite for a breakout, followed by a dump to the $0.55-$0.56 range.
Image by TradingViewFrom the midterm point of view, the situation has not changed much. Currently, traders should focus on the closest zone of $0.60. If it breaks out, growth can lead to the test of the $0.65 area soon.
XRP is trading at $0.5709 at press time.
This content was originally published on U.Today

