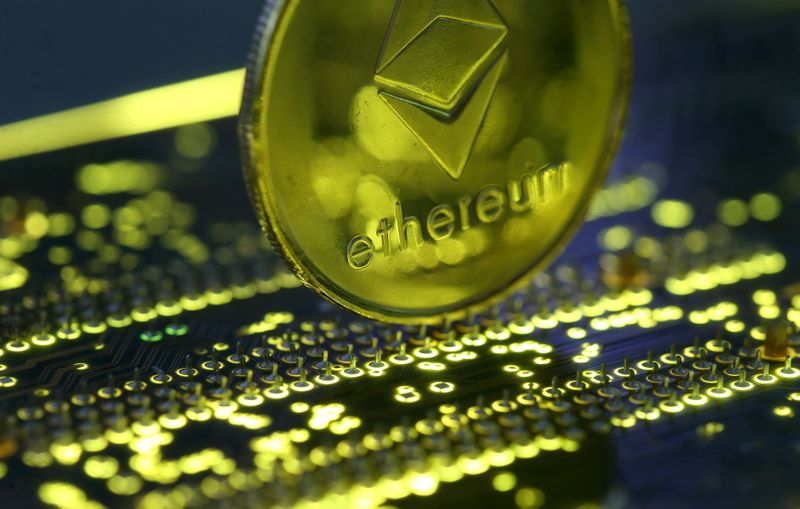
U.Today - Ethereum is currently on the edge of a significant price drop. As of the latest charts, Ethereum is trading close to the $3,000 mark, a critical psychological barrier. This precarious position signals a potential fall toward $2,950, an event watched closely by market observers.
The trading volume, while subsiding, hints that this potential dip could be temporary. However, the stability of Ethereum's price largely hinges on its ability to maintain support at $2,961. The fall below this level would cause a more pronounced drop to around $2,780. This scenario is not just a minor fluctuation; it points to larger issues at play within the Ethereum trading environment.
The overall situation on the Ethereum chart does not inspire much confidence at the moment. One of the more concerning signs is the possible convergence of moving averages. This event typically indicates upcoming volatility, suggesting that the market could be gearing up for significant price movements. Such volatility can sometimes lead to a bullish breakthrough, although in the current climate, such an outcome is not guaranteed.
XRP faced death
XRP is currently facing a "death cross." This occurs when the shorter-term 50-day Exponential Moving Average (EMA) crosses below the longer-term 200-day EMA, a classic bearish indicator in trading circles. For XRP, this pattern is not just a theoretical concern but a visible sign on the charts, indicating that the downtrend could intensify.The formation of the death cross on XRP's chart suggests that the current downtrend could worsen. There is a looming possibility that XRP could fall toward $0.50, or potentially even lower. This technical setup is crucial for traders as it often precedes further declines in price, reflecting bearish sentiment among investors.
However, it is not all doom and gloom. There is a notable trendline support around the $0.51 mark. If this support holds, it could prevent further immediate losses and offer some respite to holders. But with current trading volumes remaining low, the downward pressure on XRP's price remains a concern. Low volume often means less market activity, which can make the price more susceptible to sharp moves on relatively small trades.
Looking ahead, traders and investors will be keenly watching for a potential reversal of this trend. A "golden cross," which occurs when the 50-day EMA crosses above the 200-day EMA, would be a bullish signal and could indicate that the value of XRP is set to increase. Such a cross is renowned for signaling the start of a significant upward rally in asset values.
Solana's fakeout
SOL appeared poised for gains, but its failure to breach the 50-day Exponential Moving Average and subsequent reversal has raised suspicions of a false breakout.Typically, a genuine breakout is supported by strong trading volume and a decisive crossing of key technical levels such as moving averages. For Solana, however, the volume has been on the decline, contradicting the initial upward price movement. This lack of volume support is a red flag, suggesting that the breakout might not have the momentum to sustain itself.
Adding to the concerns is SOL's inability to hold above the $150 price level. It quickly reversed back toward lower prices, indicating that the market might not be ready for a sustained upward trend. This behavior is often indicative of a "fakeout," where the price briefly breaks out of a key resistance or support level only to revert back into its previous range.
The convergence of moving averages could potentially introduce some volatility, offering a glimmer of hope for an uptick. However, current market conditions do not favor a robust recovery. Solana has recently dipped below the trendline that previously acted as resistance, and it now faces a critical support level at $140, which aligns with the 100-day EMA.
For any significant recovery to appear on the chart, it would require a broader market rally, which seems unlikely at the moment. The overall crypto market is experiencing a correction, and without a positive shift in sentiment and market dynamics, Solana's chances of a strong rebound are close to nonexistent.
