By Lucia Mutikani
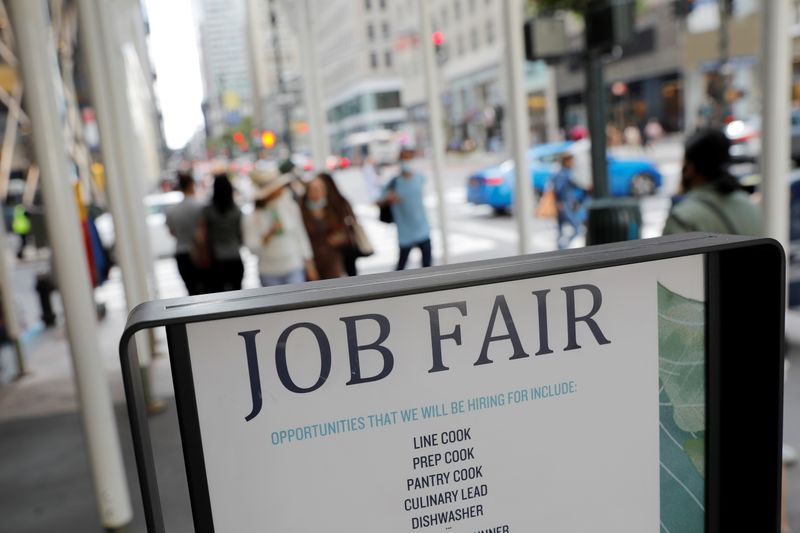
WASHINGTON (Reuters) - The number of Americans filing new claims for unemployment benefits dropped below 300,000 last week for the first time in 19 months, further evidence that a shortage of workers was behind slower job growth rather than weakening demand for labor.
With the second straight weekly decline reported by the Labor Department on Thursday, initial claims are now in the zone that is generally associated with healthy labor market conditions. But the labor market faces challenges from shortages of workers and raw materials, which are fueling inflation.
"The data support the narrative that businesses are increasingly reluctant to let go of workers amid a severe supply shortage," said Rubeela Farooqi, chief U.S. economist at High Frequency Economics in White Plains, New York. "But it is still not clear if the expected supply surge that failed to materialize in August and September will appear going forward."
Initial claims for state unemployment benefits dropped 36,000 to a seasonally adjusted 293,000 for the week ended Oct. 9. That was lowest level since mid-March 2020, when the nation was in the early stage of the COVID-19 pandemic.
There were decreases in unadjusted claims in Florida, Texas and Tennessee. Applications increased in California, Kentucky, Maryland, Missouri and Michigan. Part of the rise in Michigan was likely due to the idling of assembly lines by some motor vehicle manufacturers because of a global chip shortage.
Economists polled by Reuters had forecast 319,000 claims for the latest week. The drop last week was the biggest since late June. A 250,000-300,000 range for claims is seen as consistent with a healthy labor market. Claims have declined from a record high of 6.149 million in early April 2020.
The government reported last Friday that nonfarm payrolls increased by only 194,000 jobs in September, the fewest in nine months. The cooling in employment growth is mostly due to a dearth of workers as well as a skills mismatch, with government data on Tuesday showing there were 10.4 million job openings at the end of August.
Stocks on Wall Street were trading higher. The dollar fell against a basket of currencies. U.S. Treasury prices were mixed.
Graphic: Jobless claims: https://graphics.reuters.com/USA-STOCKS/xmvjolrqmpr/joblessclaims.png
SHRINKING UNEMPLOYMENT ROLLS
More people are coming off the state unemployment rolls, indicating strong demand for labor. The number of people continuing to receive benefits after an initial week of aid plunged 134,000 to 2.593 million in the week ended Oct. 2, also the lowest level since mid-March 2020.
The total number of people collecting unemployment checks under all programs dropped 523,426 to 3.649 million during the week ended Sept. 25. That reflected the lapse of federal government-funded unemployment benefits last month.
Labor shortages, caused by the COVID-19 pandemic, are also prevalent in other advanced economies, clogging the supply chains. There is hope that more Americans will rejoin the labor force, with coronavirus infections driven by the Delta variant declining, schools fully reopened for in-person learning and expanded benefits expired.
But amid increased self employment and massive savings as well as early retirements, thanks to a strong stock market and record house price gains, the labor pool could remain shallow for a while. Labor shortages are snarling the supply chain because there are fewer workers to produce raw materials and goods as well as shipping them to markets, fanning inflation.
In another report on Thursday, the Labor Department said its producer price index for final demand rose 0.5% in September, the smallest gain in nine months, after increasing 0.7% in August. Economists had forecast the PPI gaining 0.6%.
Graphic: Inflation: https://graphics.reuters.com/USA-STOCKS/zjvqkewdzvx/inflation.png
A 1.3% jump in prices of goods accounted for nearly 80% of the increase in the PPI. Goods prices, which advanced 1.0% in August, were boosted by energy products like gasoline, residential electricity and gas fuels.
The price of Brent crude has shot above $80 a barrel. Electric and natural gas prices have also risen, indicating that energy costs could remain elevated.
Wholesale food prices rose 2.0%, lifted by beef. Services gained 0.2% as an 11.6% jump in margins for fuels and lubricants retailing was partially offset by a 16.9% plunge in airline tickets. There were also increases in the wholesale prices of machinery and equipment, motor vehicles and parts as well as truck transportation of freight.
In the 12 months through September, the PPI accelerated 8.6%, the largest year-on-year advance since November 2010 when the series was revamped, after surging 8.3% in August.
The report followed on the heels of news on Wednesday of a solid increase in consumer prices in September, driven by strong gains in food and rents as well as a range of other goods.
Minutes of the Federal Reserve's Sept. 21-22 policy meeting published on Wednesday showed some U.S. central bank officials "expressed concerns that elevated rates of inflation could feed through into longer-term inflation expectations of households and businesses."
But producer inflation could be nearing its peak. Excluding the volatile food, energy and trade services components, producer prices nudged up 0.1% last month after gaining 0.3% in August. In the 12 months through September, the core PPI increased 5.9% after accelerating 6.3% in August.

Healthcare costs rose 0.2% and portfolio management fees jumped 1.2%. Airfares, healthcare and portfolio fees feed into the core personal consumption expenditures price index, the Fed's preferred inflation measure for its flexible 2% target. With the CPI and PPI data in hand, economists are estimating that the core PCE price index rose 0.1% in September, which would keep the year-on-year increase at 3.6%.
"There's no question producers are struggling with supply chain issues and labor shortages, so it's way too early to call the relatively low increases in core PPI a harbinger of a new trend," said Will Compernolle, a senior economist at FHN Financial in New York.