Washington is getting ready to welcome a new administration on Wednesday as President-elect Joseph Biden is inaugurated on Jan. 20. Since the Democrats will soon control both branches of Congress, as well as the White House, Biden might find it easier than previously expected to proceed with his pre-election agenda.
Green initiatives are likely to be on the top of his list. For instance, the U.S. is set to re-join the Paris climate agreement as early as this week. We can expect environmental, social and governance (ESG) criteria as well as alternative energy and electric vehicles (EVs) to receive continued interest in the coming months.
Infrastructure spending will also become a priority and could find bipartisan support. Building new and modern highways, roads, tunnels, bridges and other infrastructure projects will likely provide tailwinds for businesses in the space.
Since November, investors have already been putting money in sectors and companies they believe will benefit from the "blue wave." We previously covered several exchange-traded funds (ETFs) that could be appropriate under the incoming administration. Today, we introduce two more funds.
1. VanEck Vectors Low Carbon Energy ETF
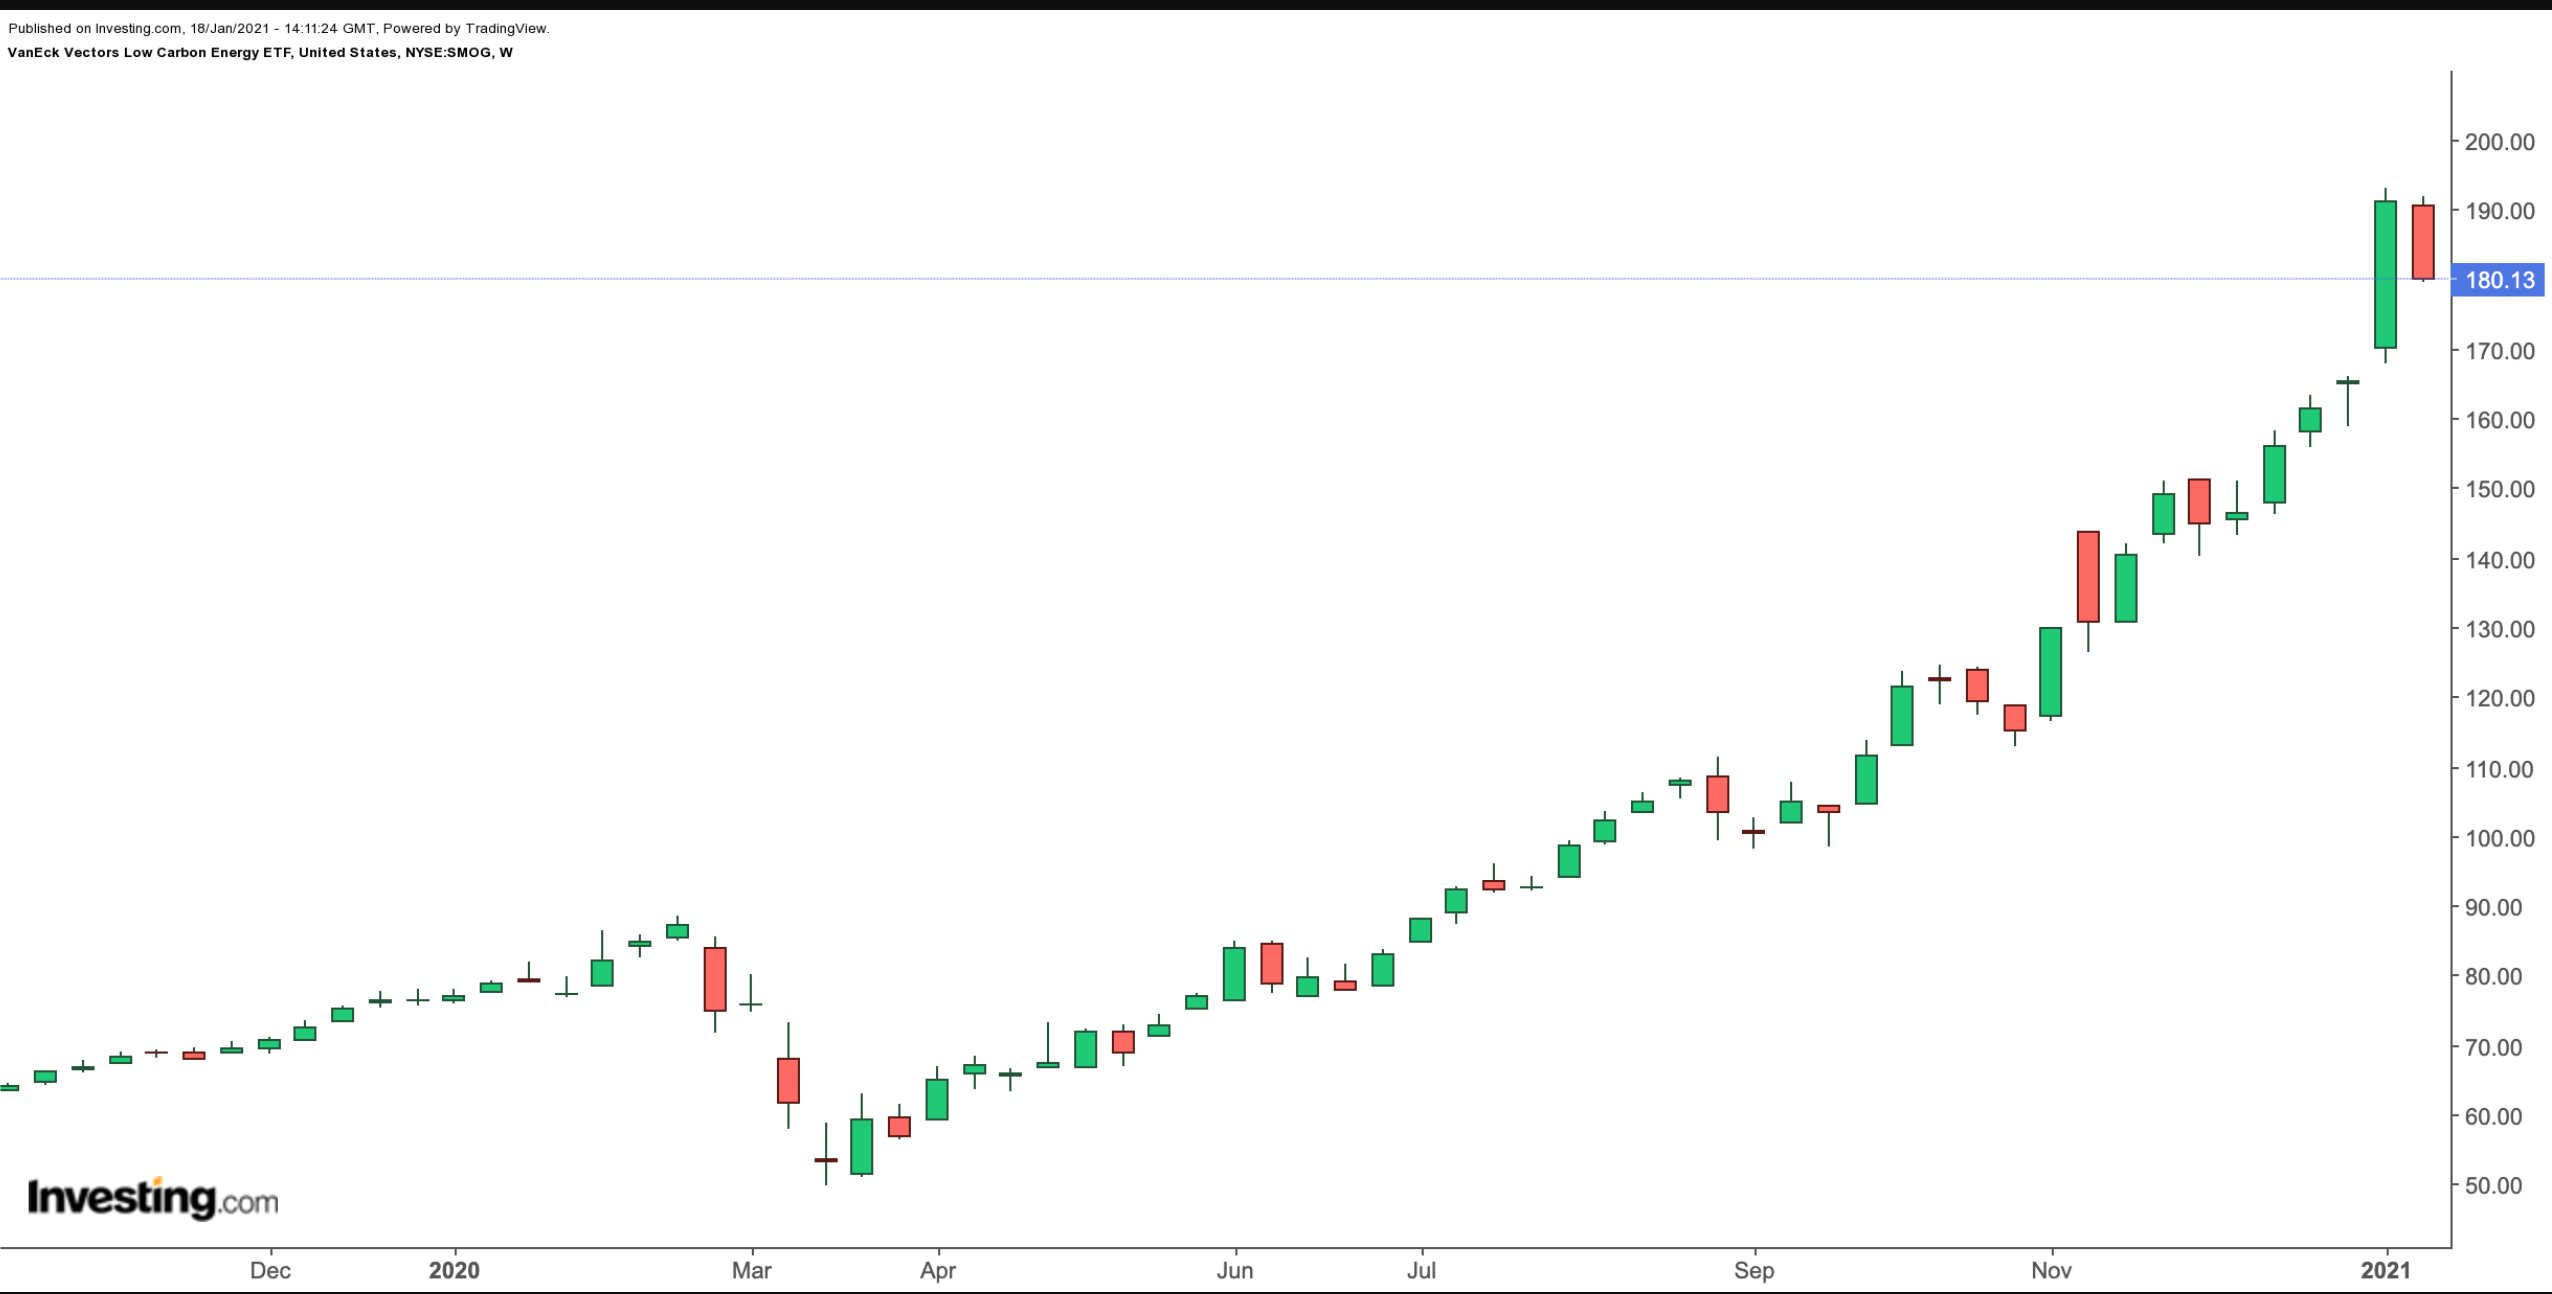
Current Price: $180.13
52-week Range: $49.81 - $193.04
Dividend Yield: 0.05%
Expense Ratio: 0.62%
The VanEck Vectors Low Carbon Energy ETF (NYSE:SMOG) gives access to global businesses in the clean-energy space. These firms may focus on the production or use of alternative energy, including power derived principally from biofuels (like ethanol), solar, wind, hydro and geothermal sources. The fund started trading in May 2007 and has net assets of more than $320 million.
SMOG, which follows the Ardour Global Extra Liquid Index, has 30 holdings. Businesses from the U.S. top the roster with over 54%, followed by China (18.24%), Denmark (14.65%), South Korea (4.04%) and Canada (3.23%).

In terms of sectoral allocation, industrials (32.2%), information technology (32.1%), consumer discretionary (22.8%) and utilities (9.4%) have the highest weighting.
The 10 largest holdings constitute close to 66% of the fund. Denmark-based Vestas Wind Systems (OTC:VWDRY); EV darlings Tesla (NASDAQ:TSLA) and Nio (NYSE:NIO), which has been increasing its market share in its native China; global power management group Eaton (NYSE:ETN) and Microchip Technology (NASDAQ:MCHP) lead the names in SMOG.
Over the past year, the ETF has returned an eye-popping 129%. As the new earnings season gets under way, short-term profit-taking is likely.
A potential drop toward $170 or less would improve the margin of safety. Nonetheless, during this new decade, we are likely to witness the growth of the sector both in the U.S. and globally.
2. Invesco DB U.S. Dollar Index Bearish Fund
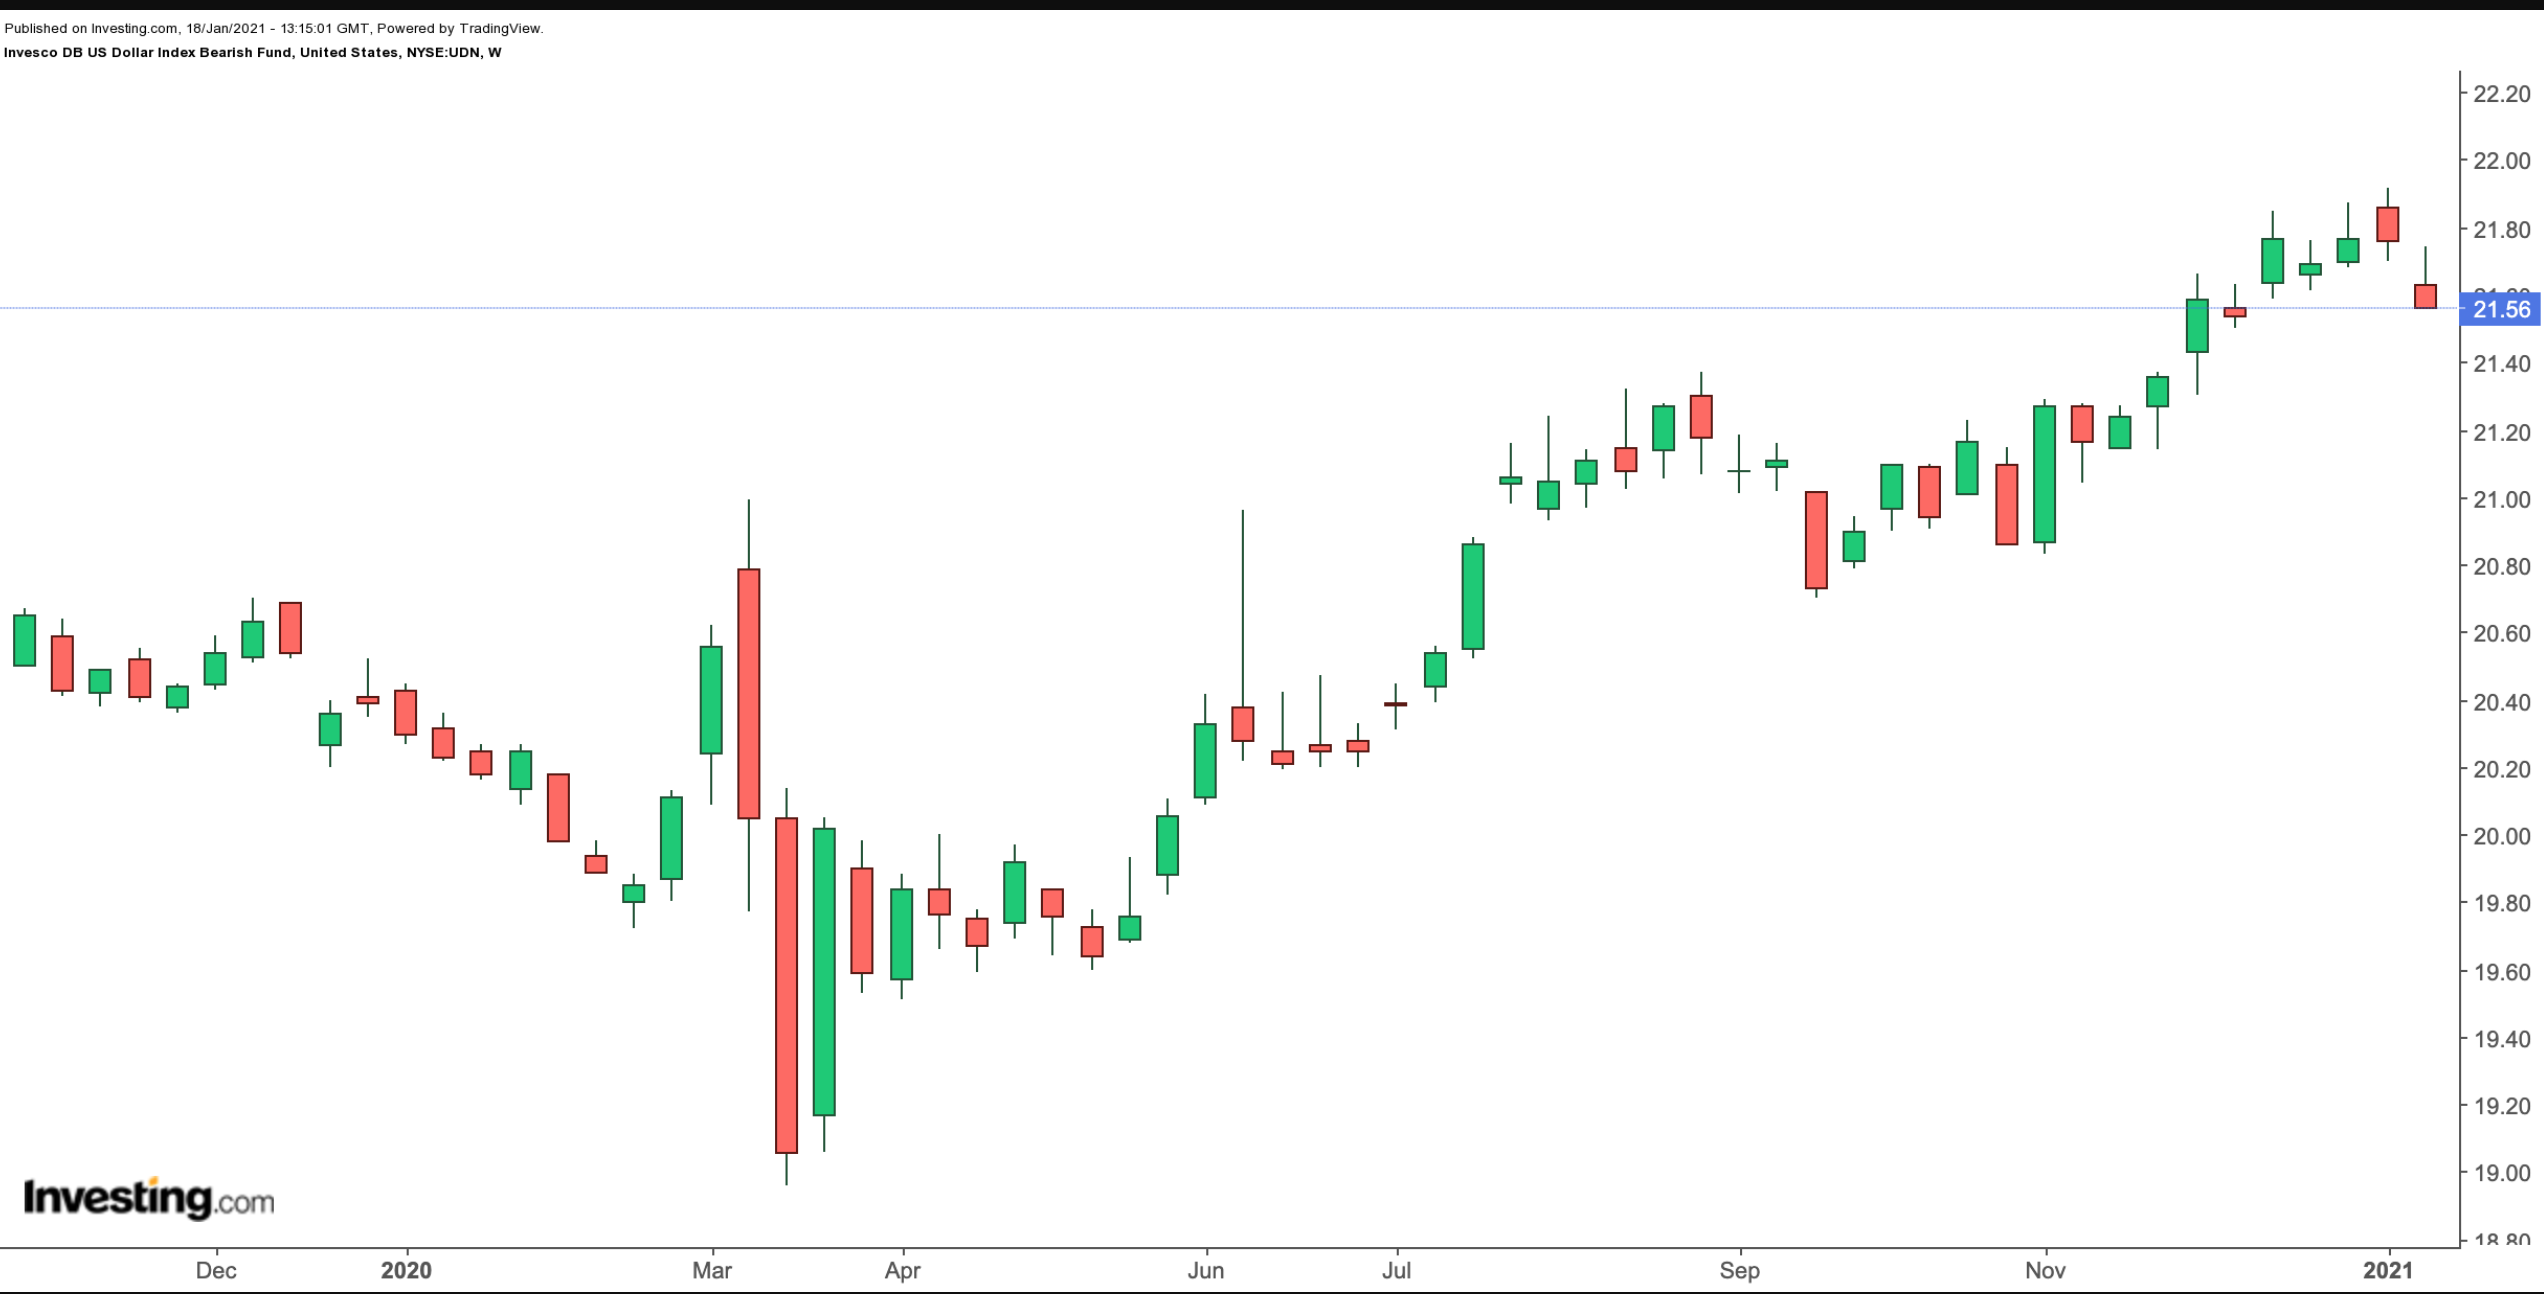
Current Price: $21.56
52-Week Range: $18.96 - $21.91
Expense Ratio: 0.77% per year
Biden has recently proposed a $1.9-trillion emergency relief plan. Although the amount could change and possibly decrease, the markets are expecting a stimulus injection. Another fiscal package would mostly be welcomed by individuals and businesses. But it would also continue to weigh on the greenback. Even though the USD is regarded as the world’s preeminent currency, it has been volatile in recent months.
In fact, over the past year, the U.S. Dollar Index, which measures the value of the currency relative to a basket of six currencies from some of the most significant U.S. trading partners, has been steadily declining. It is currently hovering between 90 and 91. Therefore, our second fund could, in part, be seen as a play on a weaker U.S. dollar. The Invesco DB U.S. Dollar Index Bearish Fund (NYSE:UDN), a currency ETF, moves higher when the value of the dollar Index declines.

UDN tracks an index that is short U.S. Dollar Index futures contracts that trade on the Intercontinental Exchange.
There could be several ways UDN could find a place in a portfolio. For example, traders who are bearish on the U.S. dollar against the euro could go long UDN. A weaker USD is generally favorable for emerging market (EM) assets.
Other market participants could see UDN as a proxy for broader U.S. indices. In simple terms, a weak USD typically means higher prices for broader U.S. markets.
Thus, those who are bullish on U.S. stocks may potentially be expecting the greenback to depreciate and lose value. Again, they could go long UDN.
For speculators who want to take a position on interest rate moves, UDN could be another option. All else being equal, when interest rates in a country go down, the value of its currency also declines. So UDN could be combined with other ETFs suitable for a low interest-rate environment.
Investors who want to hedge their commodity holdings may also utilize UDN, with the general understanding that the greenback and most commodities are inversely related.
Our view is that in the long run, the USD index could decline even further. However, the coming weeks could see the greenback recover some lost ground, which would give long-term UDN bulls a better entry point into this currency ETF.
