Top 6 chip stocks to buy for 2026, according to this semiconductor analyst
Almost a year ago, in mid-February 2020, broader markets stalled and went into freefall in a matter of weeks as COVID-19 became a global pandemic. Then came the rally that took many stocks to record highs.
Over the past year, the Dow Jones Industrial Average, the S&P 500 and the NASDAQ 100 are up around 7.1%, 16.3% and 42.8%, respectively.
Given these significant increases, especially in tech shares, many market participants wonder if there could be some short-term profit-taking around the corner. Over the past several weeks, most equity darlings of Wall Street have been fluctuating depending on the news flow and corporate earnings.
Investors are also keeping a close eye on the CBOE Volatility Index, the main benchmark for U.S. stock market volatility. In late January and early February, the VIX was around 37, a level it had not seen since late October.
Therefore, today we'll discuss two exchange-traded funds (ETFs) that might appeal to investors wanting to diversify their portfolios.
1. SPDR Portfolio S&P 500 Value ETF
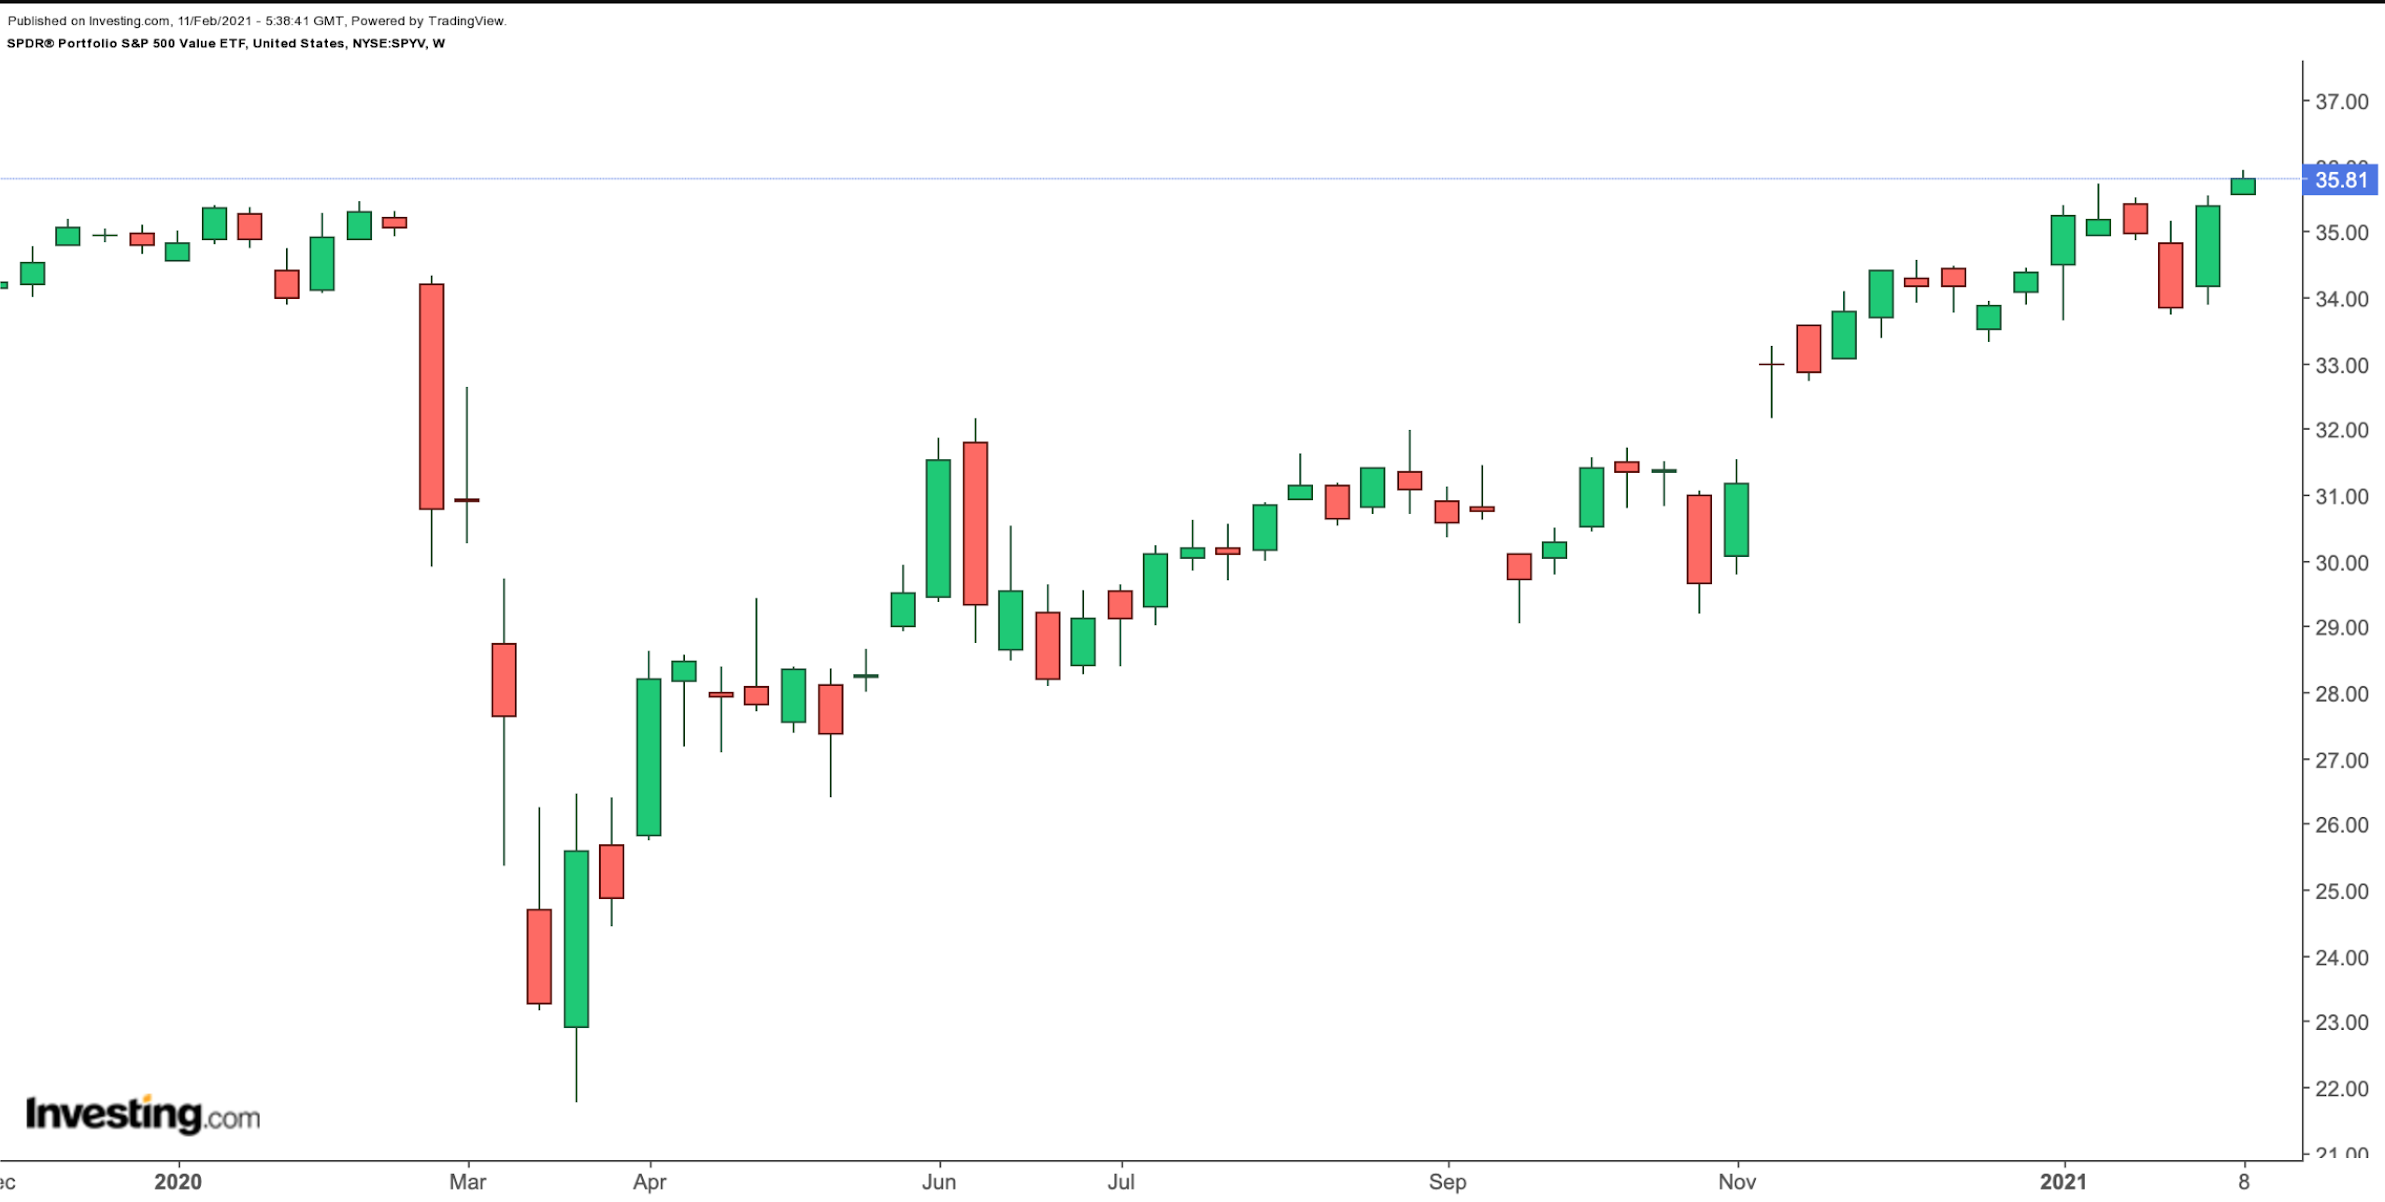
Current Price: $35.81
52-Week Range: $21.77 - $35.92
Dividend Yield: 2.3%
Expense Ratio: 0.04 % per year
The SPDR® Portfolio S&P 500 Value ETF (NYSE:SPYV) provides access to S&P 500 stocks that could be undervalued relative to the broader market. Since its inception in September 2000, assets under management have grown to $8.3 billion.

Value and growth investing are two important concepts for market participants. Value-oriented investors look for underpriced value stocks that might have recently fallen out of favor. Many investors know of Warren Buffett as one of the most prominent value investors of all time
On the other hand, growth-oriented investors seek out businesses with high revenue, strong earnings or cash-flow growth. The past decade has seen growth stocks take the markets to new highs. However, recently, value stocks are having a better time.
SPYV, which follows the S&P 500 Value Index, has 390 holdings. The benchmark index includes S&P 500 companies that exhibit strong value characteristics based on three ratios:
- price-to-book value
- price-to-earnings
- price-to-sales
The leading sectors by weighting are financials (19.78%), health care (14.98%), information technology (11.64%), consumer staples (9.35%) and consumer discretionary (7.67%).
The top 10 holdings make up 20% of SPYV. Warren Buffett's Berkshire Hathaway (NYSE:BRKa) (NYSE:BRKb)), global banking giant JPMorgan Chase (NYSE:JPM), entertainment and media conglomerate Disney (NYSE:DIS), diversified medical group Johnson & Johnson (NYSE:JNJ) and chip giant Intel (NASDAQ:INTC) lead the names in the fund.
Over the past 52 weeks, SPYV is up about 2%. In fact, the recent returns have come since the start of the new year as the fund has returned over 4% year-to-date (YTD). Those investors who believe value strategies might outperform growth stocks should keep the ETF on their radar.
2. iShares MSCI Global Min Vol Factor ETF
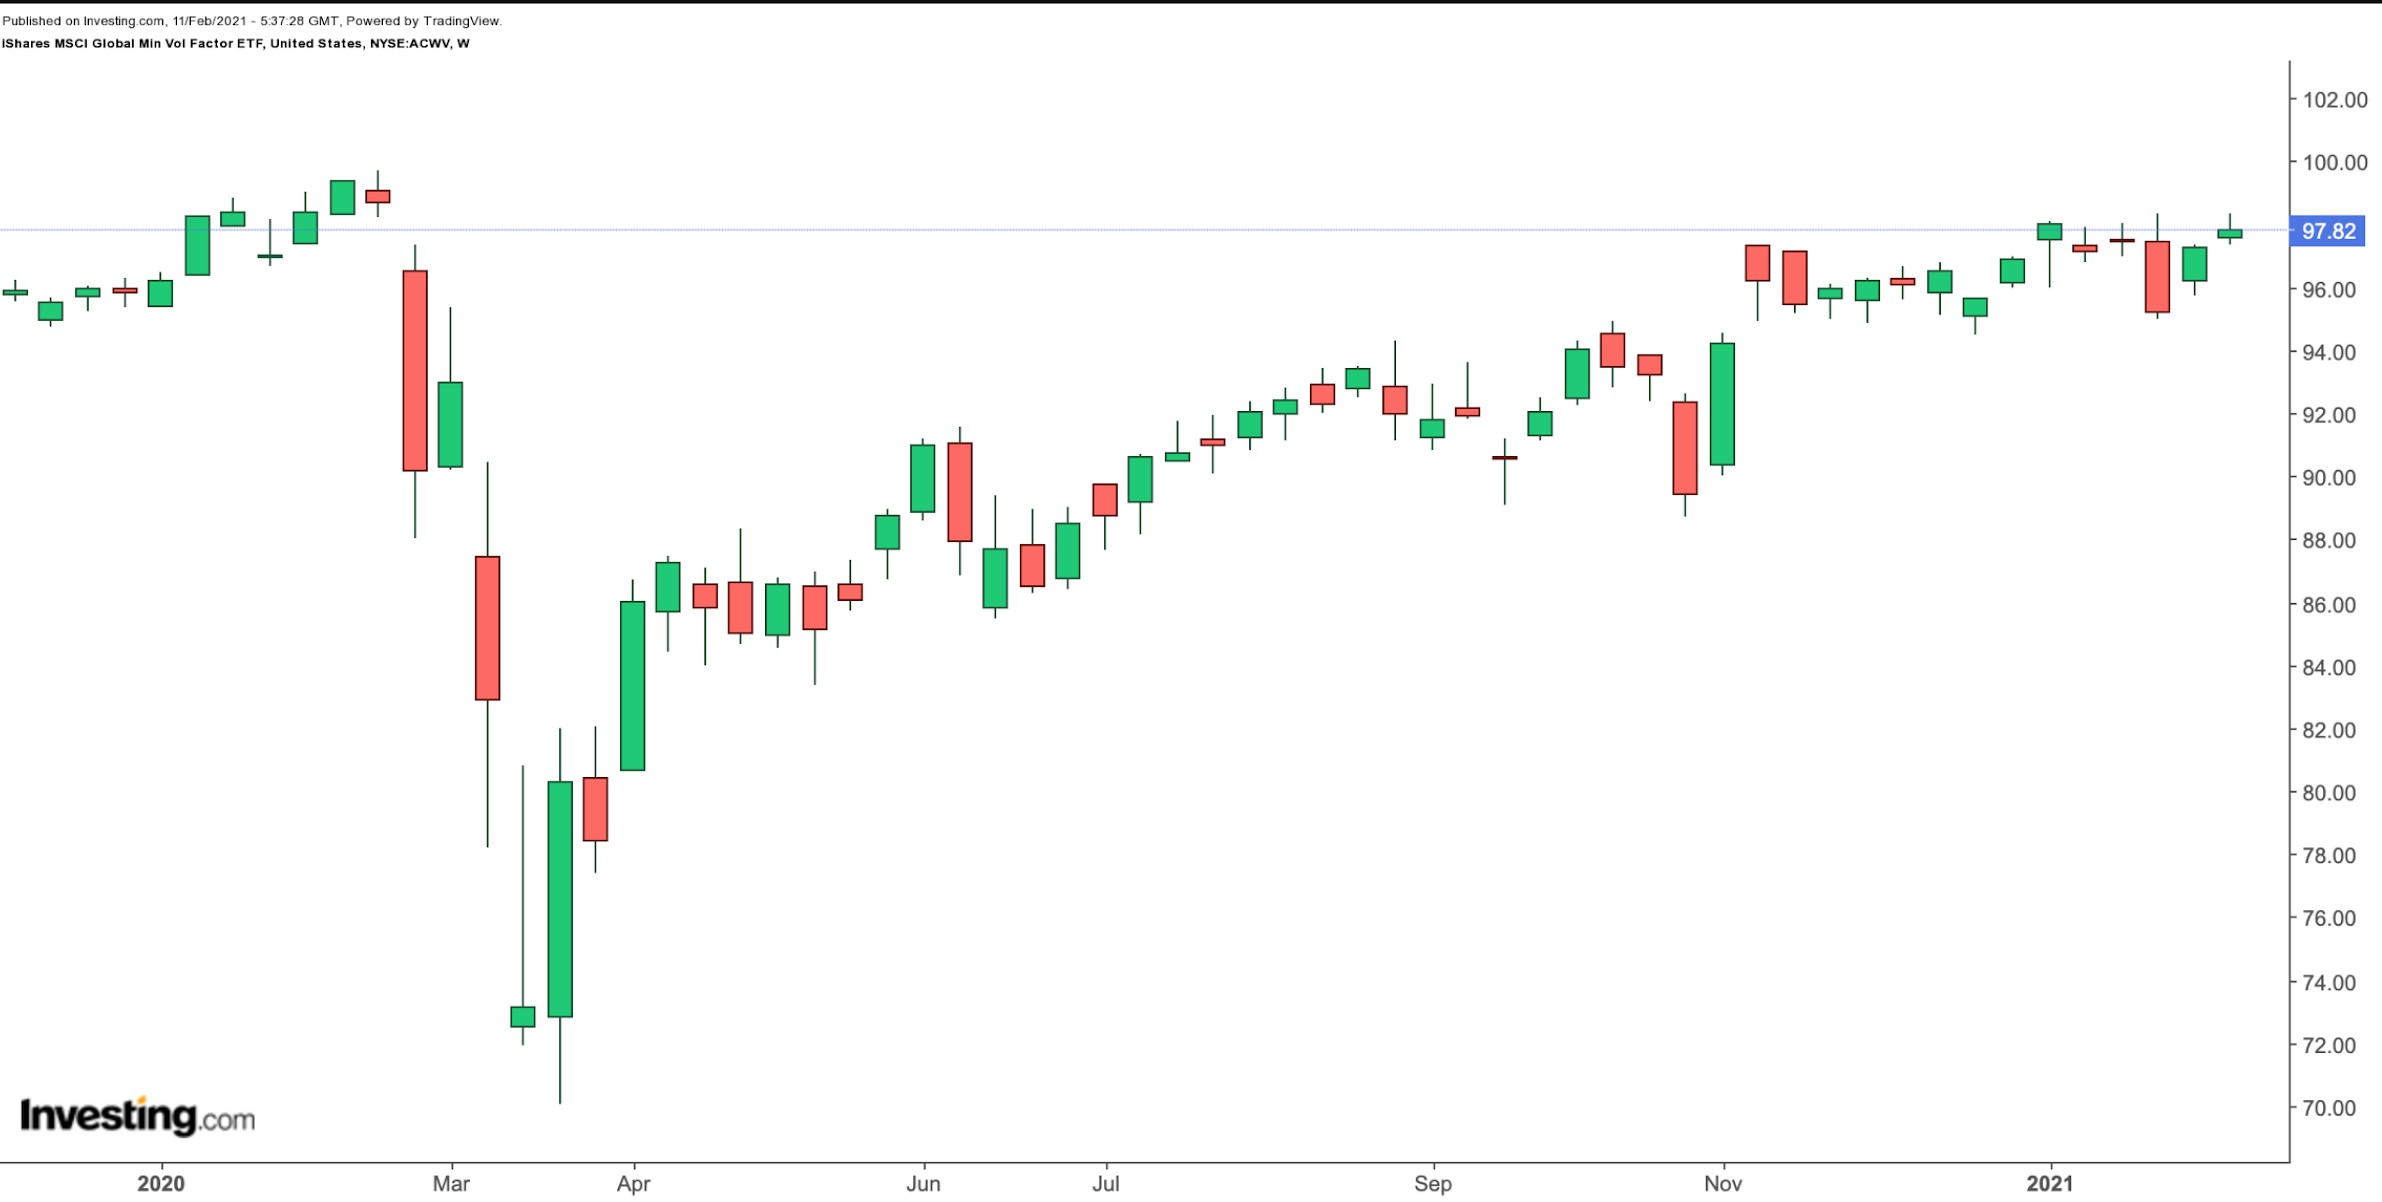
Current Price: $97.82
52-Week Range: $70.06 - $99.70
Dividend Yield: 1.74%
Expense Ratio: 0.2%
iShares MSCI Global Min Vol Factor ETF (NYSE:ACWV) invests in global shares with lower volatility characteristics. Around half of the firms come from the U.S. Next in line are companies from Japan (12.18%), Switzerland (5.13%) and Canada (4.5%).

ACWV, which has 380 holdings, tracks the MSCI All Country World Minimum Volatility Index. The fund started trading in October 2011 and net assets stand at $5.7 billion.
In terms of sectors, IT leads with 17.08%, followed by health care (15.21%), communication (12.87%), consumer staples (12.05%), financials (10.89%), utilities (7.79%), industrials (7.75%), consumer discretionary (7.46%) and others.
The top 10 stocks comprise more than 12% of the funds. The Swiss pharma group Roche (OTC:RHHBY) and consumer goods giant Nestle (OTC:NSRGY), Verizon Communications (NYSE:VZ), sustainable energy group NextEra Energy (NYSE:NEE) and Colorado-based mining group Newmont (NYSE:NEM) lead the names in the roster.
Over the past 12 months, the fund is down about 0.6%. But since the start of 2021, it has returned 1.5%. We believe international diversification could help decrease portfolio volatility. At this point, analysts are debating whether broader U.S. indices are richly valued. On the other hand, most stocks outside the U.S. have not seen the high returns that many U.S. shares have had in the past year.
Therefore, we'd consider buying the fund, especially around $95 or below.
On a final note, options are available on the ETF, making it possible for experienced traders to put together more complex strategies.
