Will it go the last $100 mile? Or will there be little meaningful progress from here? Worse, could it plummet back to the low $1,800s or even lower?
Gold’s potential path after its first return in 20 weeks to $1,900 pricing might not be the biggest puzzle in commodities. But it’s close.
All charts courtesy of S.K. Dixit Charting
To hear it from anyone who’s been following gold diligently, the yellow metal is having its biggest month since January—up almost 8% for May—because of the wind that’s been sucked out of US bond yields and the dollar.
After blowing hot for months, particularly from mid-March to mid-April, the yield on the 10-year Treasury note has gone cold, tumbling to 1.55% this week from a 2021 high of almost 1.78%, as the super-charged inflationary environment suddenly deflated by a raft of recent US data.
The Dollar Index, gold’s biggest nemesis on most days, is also wilting. The index, which pits the greenback against the euro and five other major currencies, hovers at under 89.62 now from a March high of nearly 93.5.
According to Bob Haberkorn, senior market strategist at RJO Futures, “gold is just acting as a safe haven today”—the role hijacked from it months ago by the 10-year Treasury note when yields became the hottest wager for anyone betting against the Federal Reserve’s resolve not to hike interest rates.
Except for gold bugs—who have sworn allegiance to the yellow metal, come what may—conviction has been a rare commodity for the average long investor who tried to stay true to gold through the travails of the past six months.
Since January, gold has been on a tough ride that actually began in August last year—when it came off record highs above $2,000 and meandered for a few months before stumbling into a systemic decay from November, when the first breakthroughs in COVID-19 vaccine efficiencies were announced.
To many, gold’s return to above $1,900 is logical, overdue, and even remarkable—considering the tortuous journey it’s been on this year.
But after so many false starts during mini rallies in the $1,700 and $1,800 levels, skepticism understandably lingers for $1,900 pricing and even more, of course, for $2,000 gold.
The reference to gold as an inflation hedge is a painful one for some who made a beeline to the yellow metal in recent months, on the premise of it being touted as the best store of value and a safety instrument to count on during times of both financial and political trouble.
For some, gold was incredibly late to this year’s inflation party even as prices of other commodities like oil, lumber and even coffee took off on supply strains and demand ripping from an economy reopening after months of COVID-lockdowns.
Others will point to the run-up to $2,000 and beyond during the heights of the pandemic as proof of gold forerunning inflation and, therefore, “balancing things off” now.
Dhwani Mehta, a gold chartist who blogs on FXStreet, said despite the overbought RSI, or Relative Strength Index, in the metal, buyers were still attempting to defy the bearish odds to try and test the Jan. 8 high of $1,917.
Adds Mehta:
“Further upside appears elusive, as gold bulls could take a breather before resuming the uptrend towards $2,000.”
“The next upswing could likely get fueled by prospects of bearish crossovers on the said time frame. Meanwhile, any corrective pullbacks could meet initial demand at $1890, the static resistance now supports.”
But she also cautioned that further south, “strong support near the $1,872/70 region could guard the downside.”
Investing.com’s Daily Technical Outlook has a “Strong Buy” call on the June front-month contract in New York-traded futures of Comex gold.
As of Wednesday morning in Asia, the highest prediction for June gold on that platform was $1,909.45. That was marginally higher than the day’s peak of $1,907.95 on Comex, an indication of the little headroom projected in the immediate hours after the metal’s arrival to $1,900 territory.
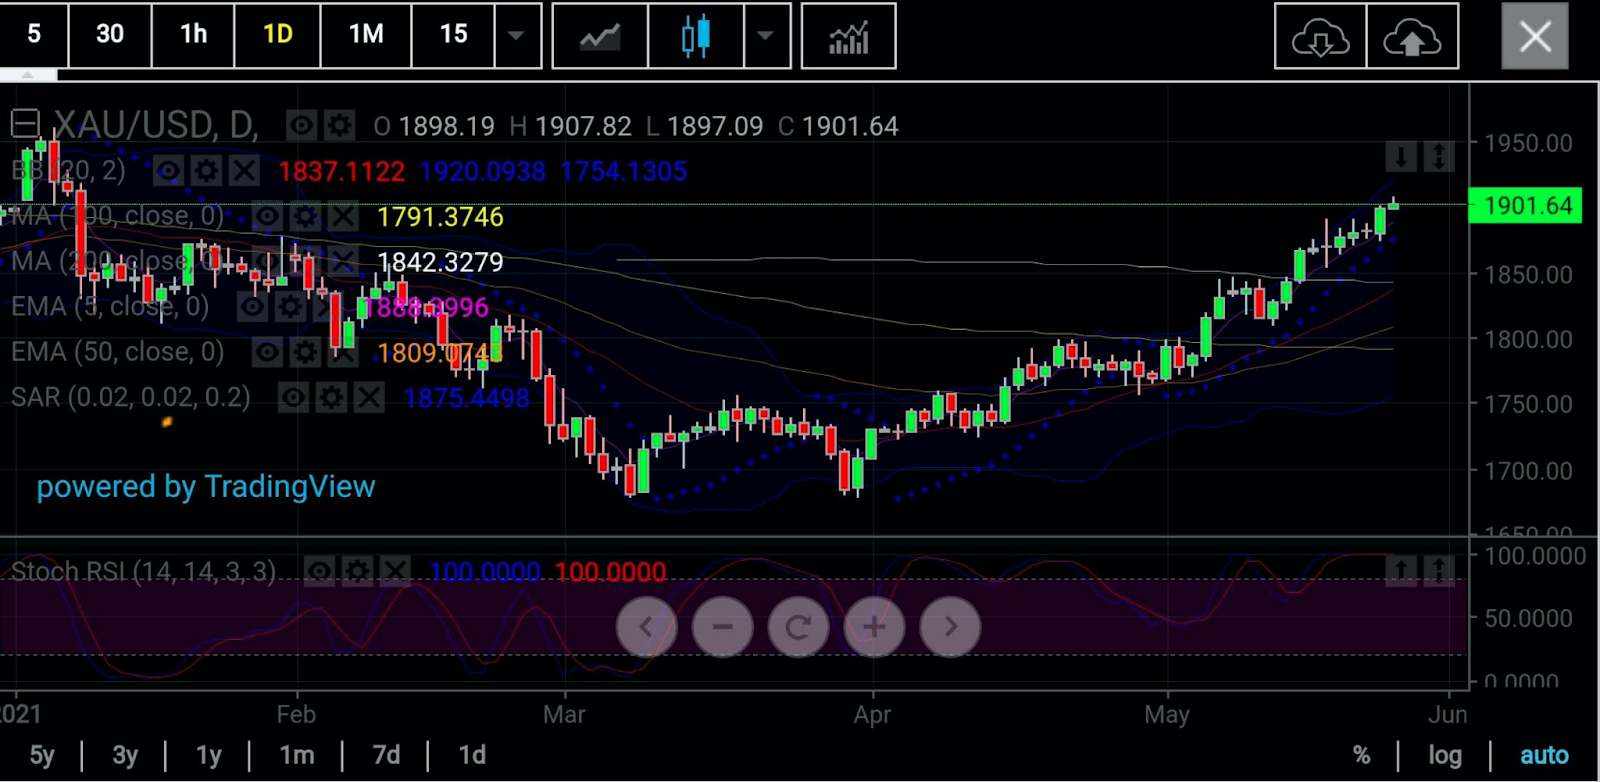
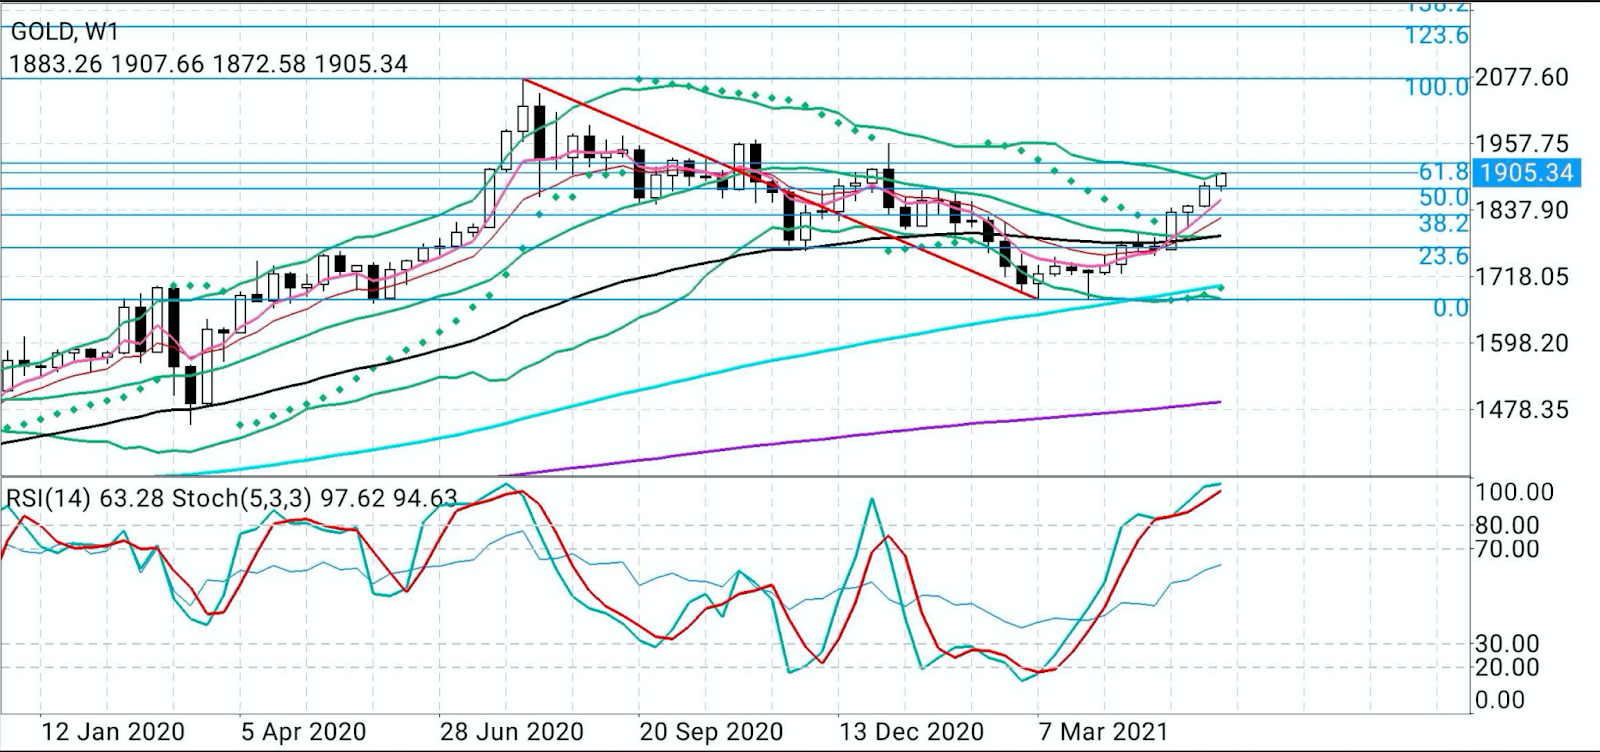
Sunil Kumar Dixit of S.K. Dixit Charting in Kolkata, India, said he saw the spot price of gold moving to $1,922 first, then $1,958, making what would be defined as “a triple top formation,” before plunging to between $1,848 and $1,828.
Said Dixit:
“Gold has strongly steered clear above the 50% Fibonacci level of $1,875 of retracement, measured from the $2,075 high to $1,676 low and is all set for the next leg higher of $1,922, which is the 61.8% Fibonacci level.”
He said the Stochastic RSI reading of gold’s daily chart is 100/100 while on the weekly chart, it reads 97/94.
“This means the rally is likely to take gold higher, possibly to $1,958, make a triple top formation before the plunge to 1848-1828 which is a confluence zone of the 50-Exponential Moving Average’s middle Bollinger® Band on the weekly chart.”
“To me, the odds of a pre-$1,960 plunge are a lot greater than a promising rally beyond $2,000.”
Disclaimer: Barani Krishnan uses a range of views outside his own to bring diversity to his analysis of any market. For neutrality, he sometimes presents contrarian views and market variables. He does not hold a position in the commodities and securities he writes about.
