Earlier today, I used the InvestingPRO subscription tool, to do a screening of some stocks globally that reflect some particular characteristics.
Going into more detail, the main parameters that I set, are as follows (see photo below):
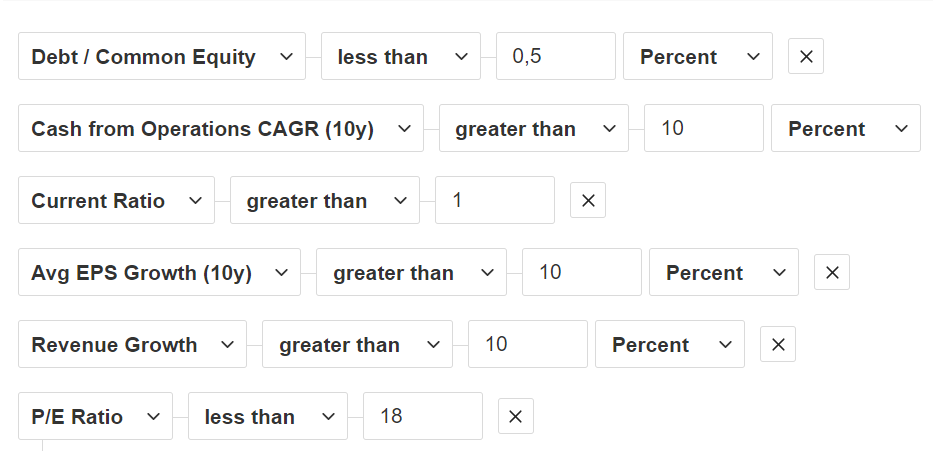
- Debt to equity ratio is less than 50%.
- Cash flow from operating activities lasts 10Y increasing at a rate of more than 10%.
- Current Ratio (i.e. ratio between current assets and current liabilities) > 1
- Last 10Y average earnings per share (EPS) growth greater than 10%
- Revenue growth greater than 10%
- P/E ratings below 18 (U.S. average)
The result is a list of 23 stocks, belonging to different countries and sectors, which allows us to narrow our search and analysis to a much more limited number of stocks.
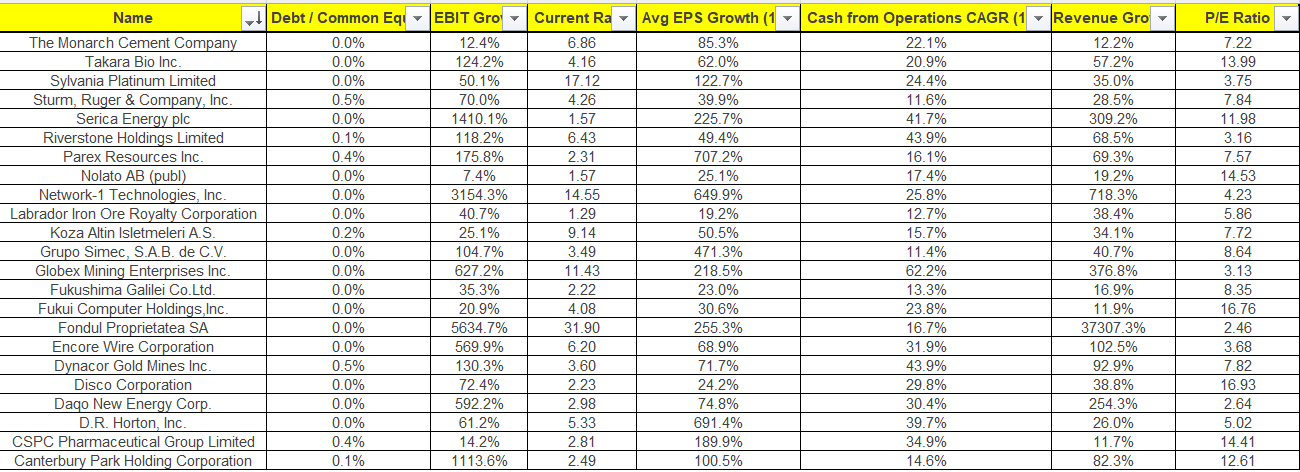
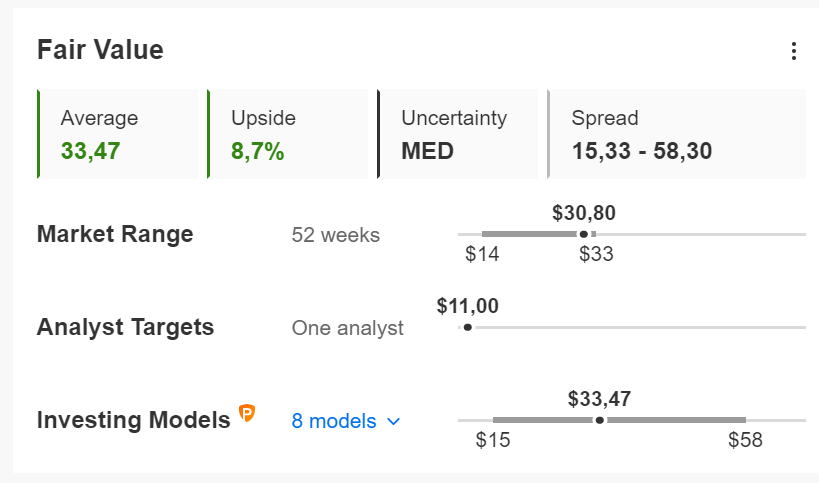
As we can see in the table, there are no particularly well-known stocks. Again using the InvestingPRO tool, is to go stock by stock to understand if compared to their fair value they are more or less at a discount. Taking the first two in the list as an example (put in alphabetical order) we notice that Canterbury Park Holding Corporation (NASDAQ:CPHC) turns out to have a very small margin (just an 8.7% discount).
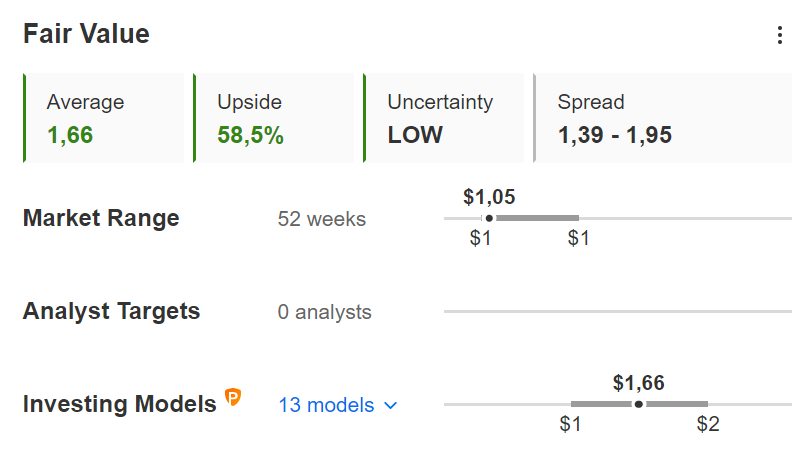
On the other hand, CSPC Pharmaceutical Group Ltd (HK:1093) presents an already more attractive fair value discount (58.5%), although as always the analysis should not stop here, I have to ask myself why there is such a big difference.
Once I have analyzed the business, the comparison between competitors, and the analysis of dividends, I will be able to pass to the last phase of the screening (when maybe I will have reached 3-4 good stocks in my final database).
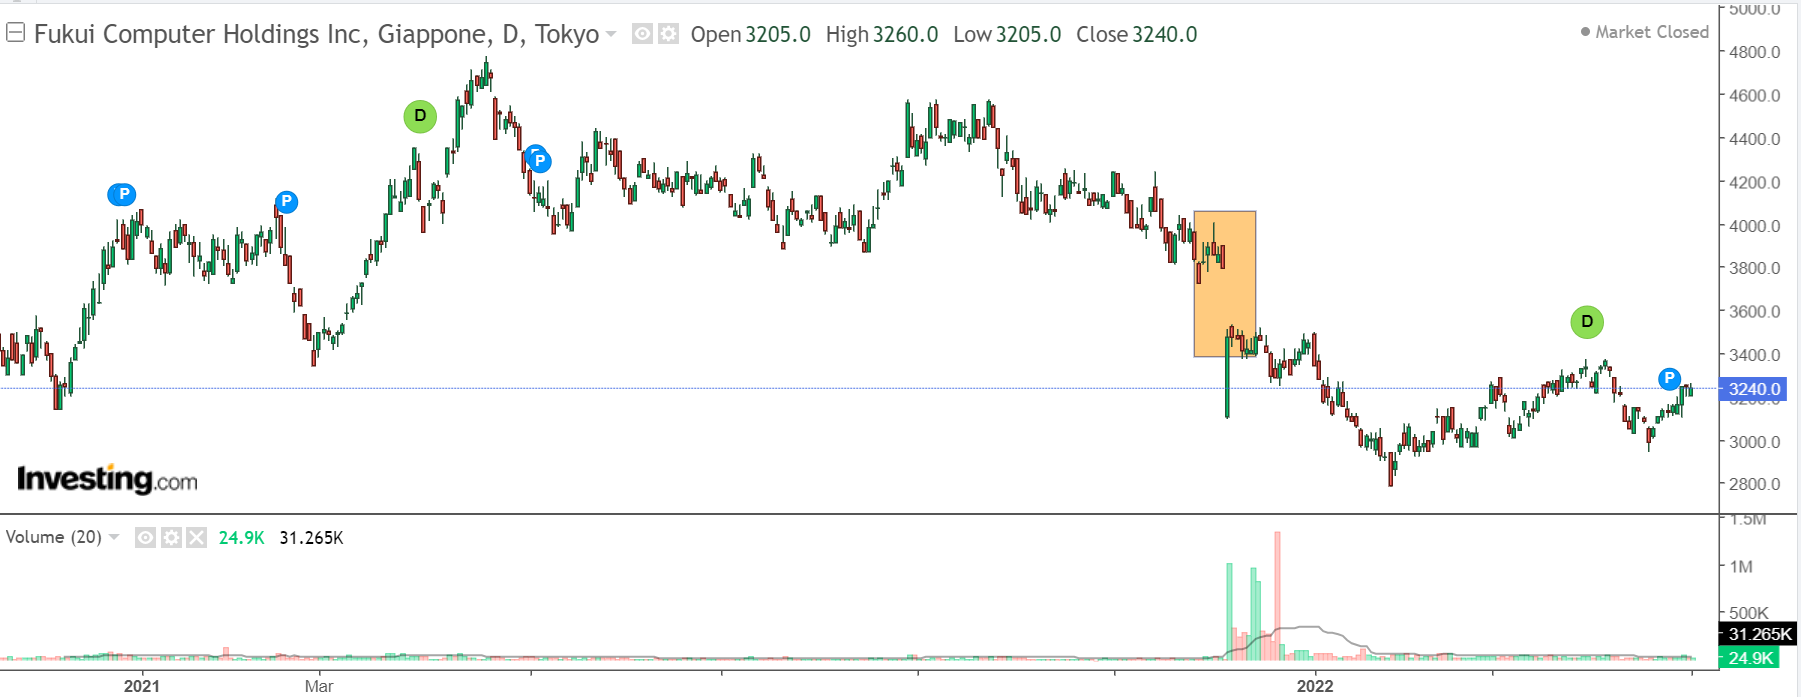
For example, in the case of Fukui Computer Holdings Inc (TYO:9790), I have to ask why there appears to be such a pronounced gap down at the end of 2021 (a bad quarter?), and consequently, investigate further.
So you see that selecting a stock to include in our portfolio is a process that requires several steps, which must always be done, at least to reduce to a minimum the possibility of making mistakes in the analysis, basing oneself on titles, for example, chosen "only because you read them in the newspaper" or because "your consultant suggests them to you" or because....you add whatever you want.
Until next time!
If you find my analyses useful and would like to receive updates when I post them in real-time, click on the FOLLOW button on my profile!
"This article has been written for informational purposes only; it does not constitute a solicitation, offer, advice, or recommendation to invest as such is not intended to incentivize in any way the purchase of assets. I remember that any type of asset, is evaluated from several points of view and is highly risky and therefore, every investment decision and its risk remain at the expense".
