Earnings from the U.S. tech sector have all but wound down, but results this week are due from a variety of high-flying cloud-computing software companies.
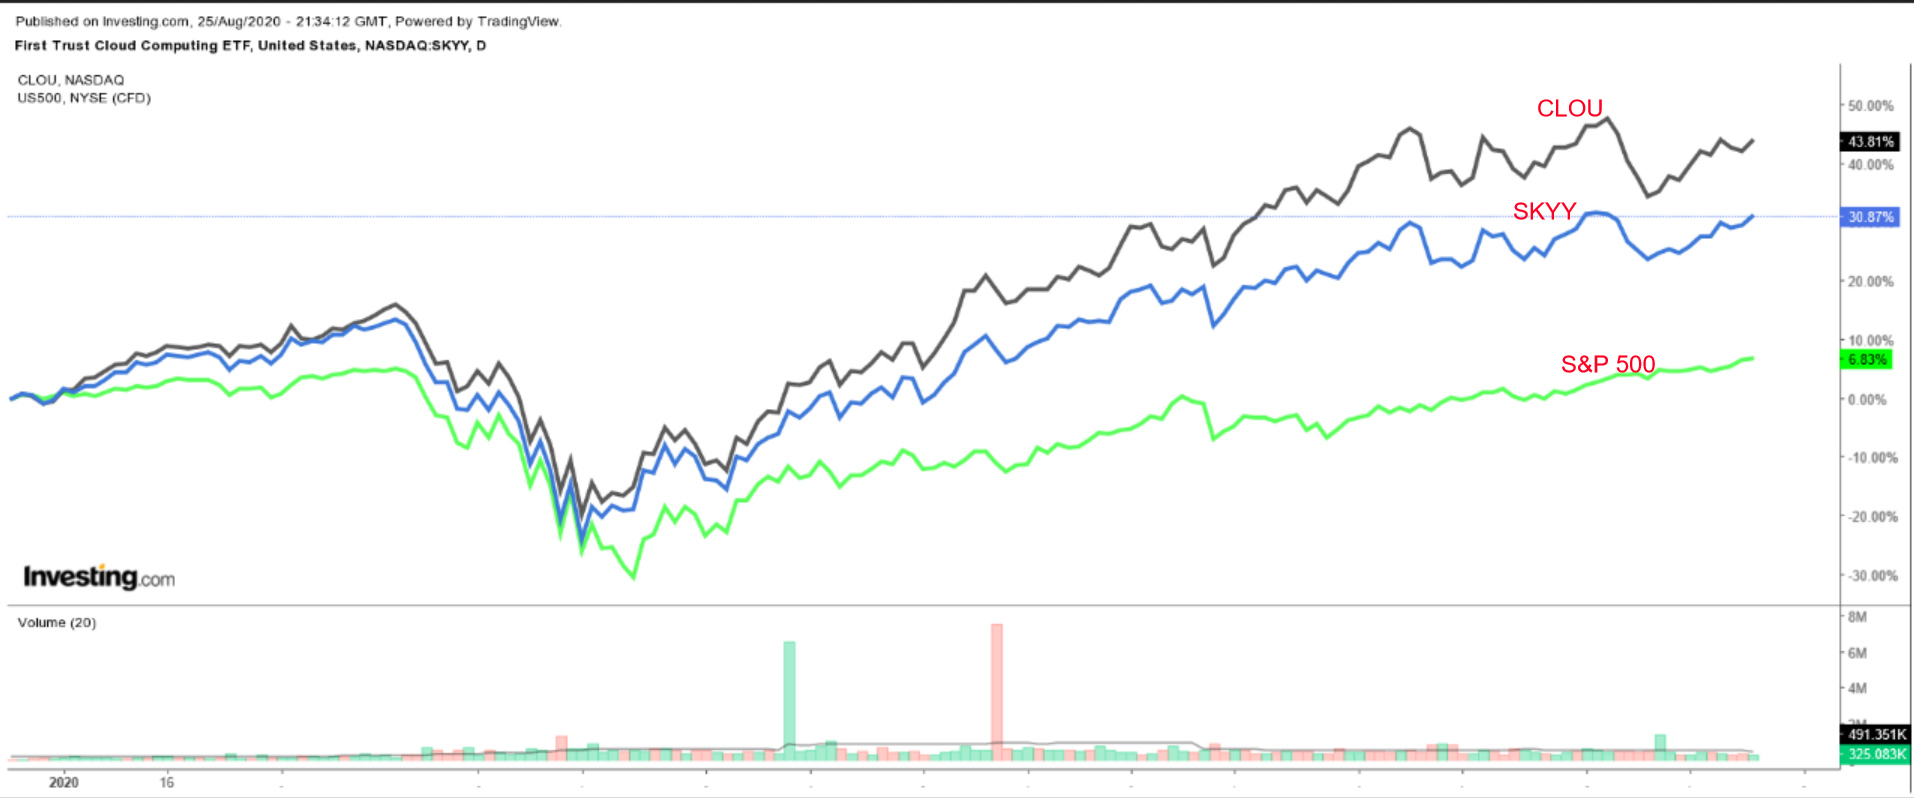
Cloud-related software ETFs are trading near their highest levels on record, with the First Trust Cloud Computing ETF (NASDAQ:SKYY), and the Global X Cloud Computing ETF (NASDAQ:CLOU) up around 76% and 84% respectively since their March lows, reflecting booming demand for cloud-based offerings as the COVID-19 pandemic accelerated enterprise digitization trends.

Below are three cloud-based tech sector stocks set to enjoy robust earnings and revenue growth thanks to strong demand for their innovative products.
Each is well worth considering ahead of their upcoming quarterly earnings reports.
1. Splunk: Reports August 26 After Markets Close
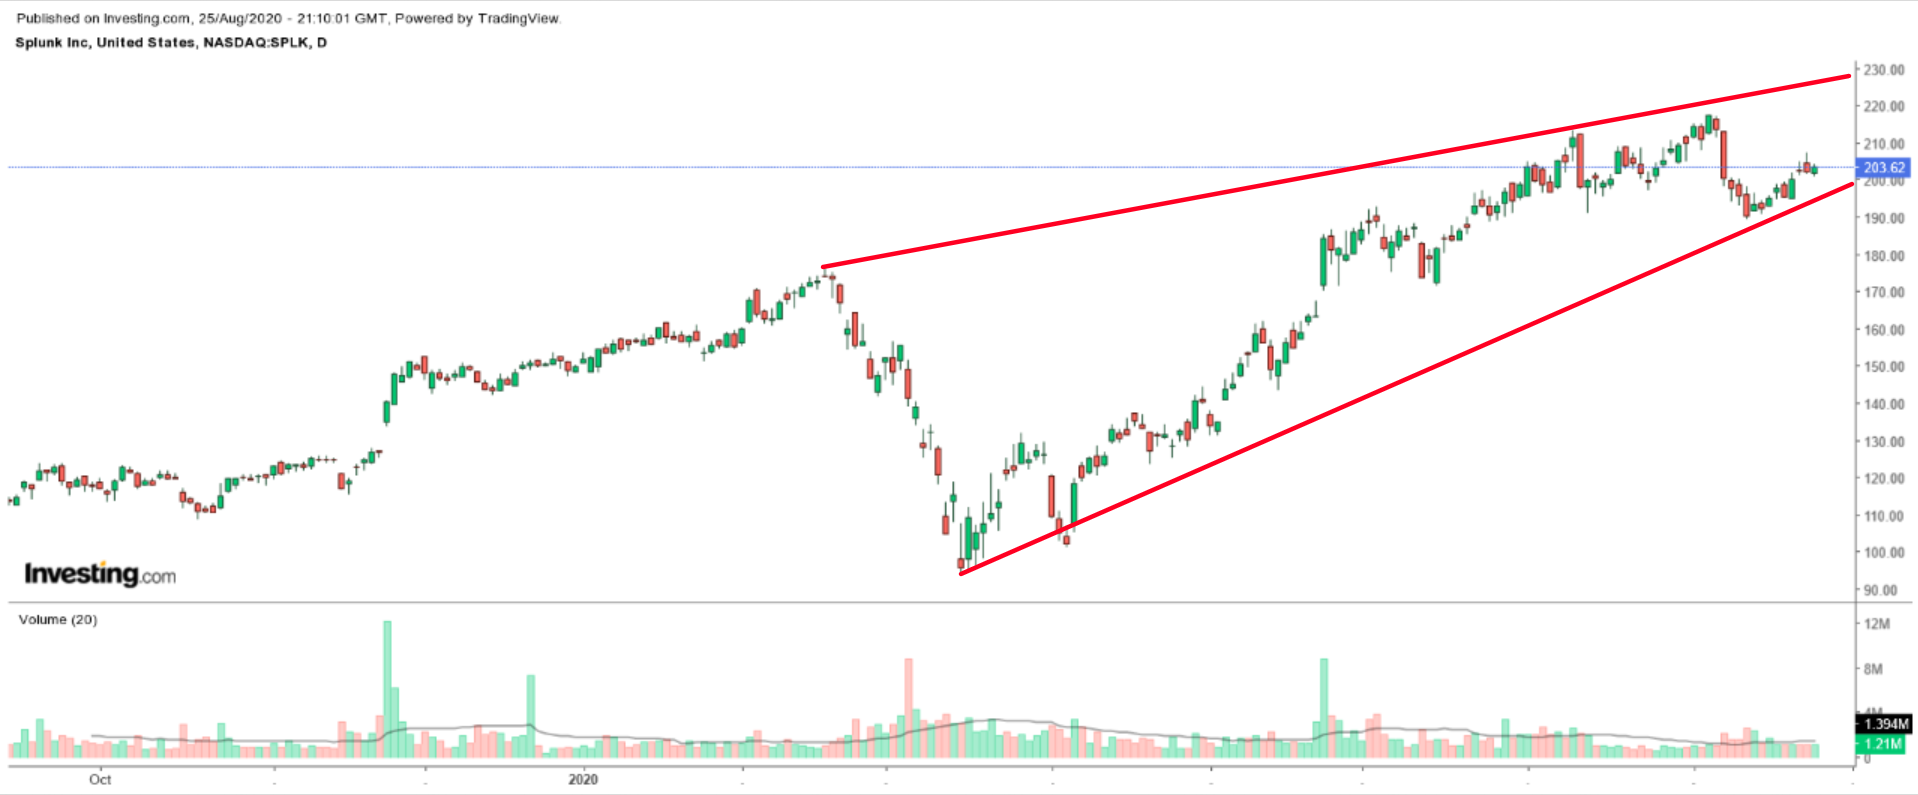
Splunk (NASDAQ:SPLK) has seen its shares significantly outperform the broader market in recent months, rebounding about 117% from lows hit in mid-March, as investors have become increasingly bullish on the San Francisco, California-based data analytics company.
The stock ended at $203.62 on Tuesday, not far from its all-time high of $217.33 reached on August 5, giving the rapid-growing tech corporation a market cap of around $32.3 billion.

Splunk—which reported mixed first-quarter results in late May—is expected to report a loss of $0.33 per share for the second quarter, compared to earnings of $0.30 per share in the year-ago period. Revenue is forecast to rise about 1% from the same period a year earlier to $520.98 million, reflecting the boost in demand for its Splunk Enterprise management platform.
Perhaps of greater interest: growth rates in Splunk’s cloud-based segment, which soared 81% in the previous quarter to $112 million.
In addition to the top- and bottom-line numbers, market players will also pay attention to Splunk’s update regarding its enterprise client additions. At the end of the first quarter, the company’s customers included more than 90 of the Fortune 100 companies.
2. Okta: Reports August 27 After Markets Close
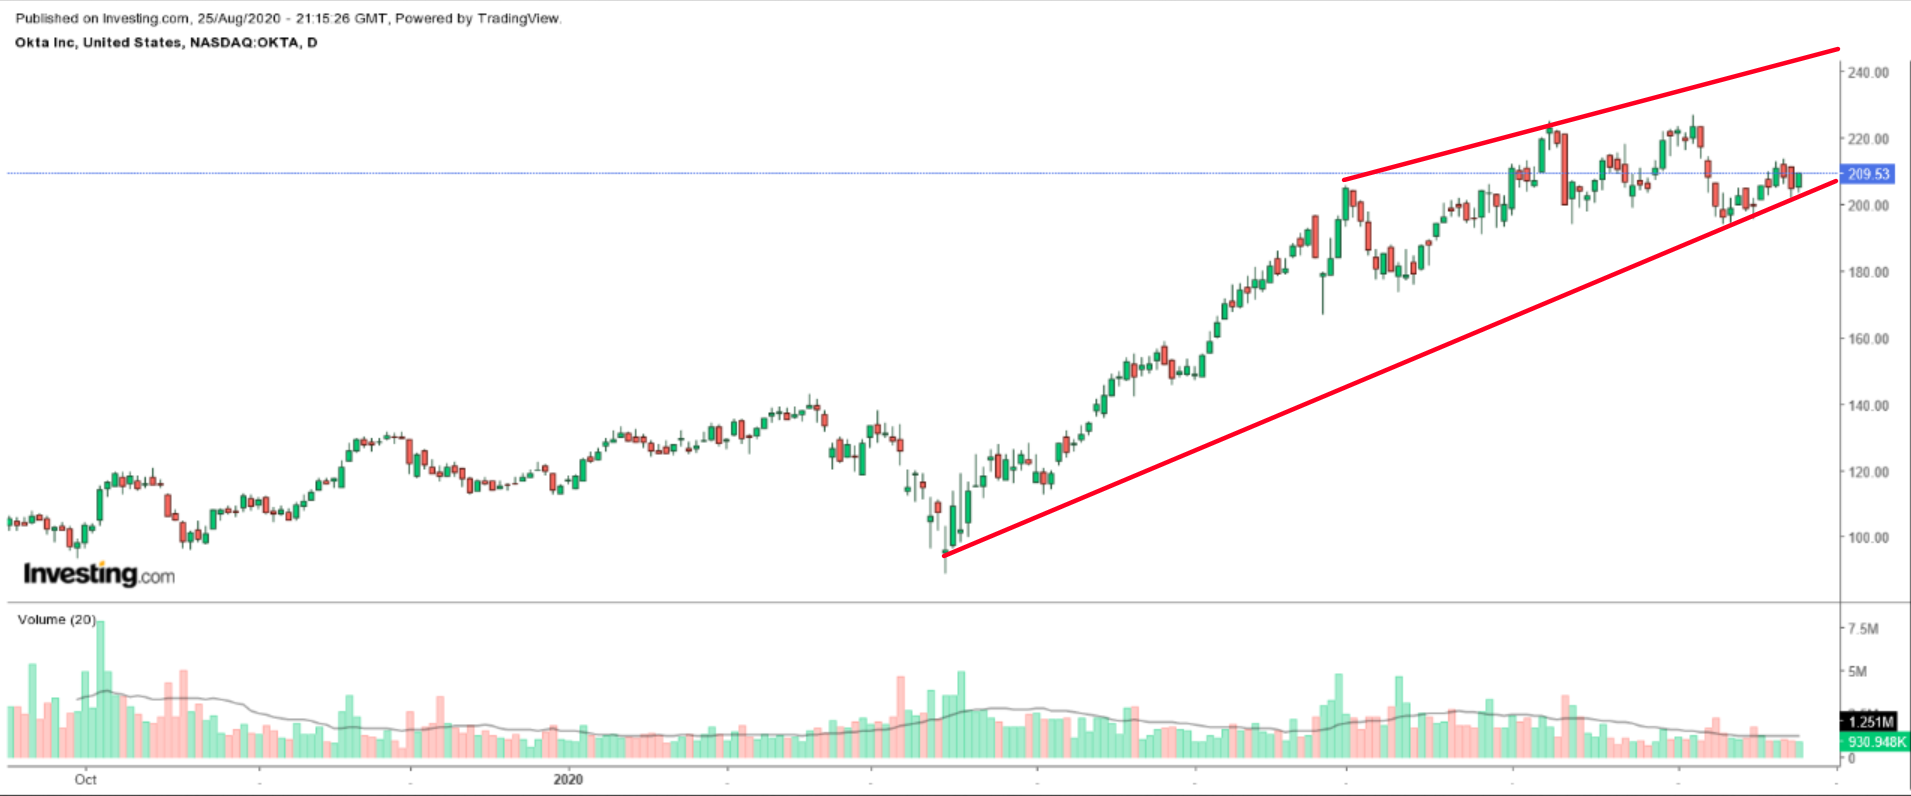
Okta (NASDAQ:OKTA) shares have more than doubled off their mid-March lows, rallying 136%, as it benefits from strong demand for its cloud-based cybersecurity platform, which helps enterprises connect securely to their employees and customers.
The stock settled at $209.53 yesterday, within sight of its record high of $226.87 touched on August 5, giving the San Francisco, California-based company a market cap of about $26.1 billion.

Okta beat expectations last quarter on results and its guidance. For its upcoming results, consensus calls for a loss of $0.02 per share for the second quarter, narrowing from a loss of $0.05 per share in the year-ago period. Revenue is forecast to jump 32% from the same period a year earlier to $186.26 million, thanks to an expected surge in the use of its Okta Identity Cloud platform.
Investors will also focus on Okta’s subscription software revenue, which spiked 48% in the last quarter to $173.8 million, amid an increase in remote work in response to the pandemic.
Beyond EPS and revenue, the company’s updated outlook for the rest of the year and beyond will be closely watched. The cloud-based identity-and-access management specialist raised its full-year revenue guidance to a range of between $770 million to $780 million in its last quarter, representing growth of 31% to 33% year-over-year.
3. Workday: Reports August 27 After Markets Close
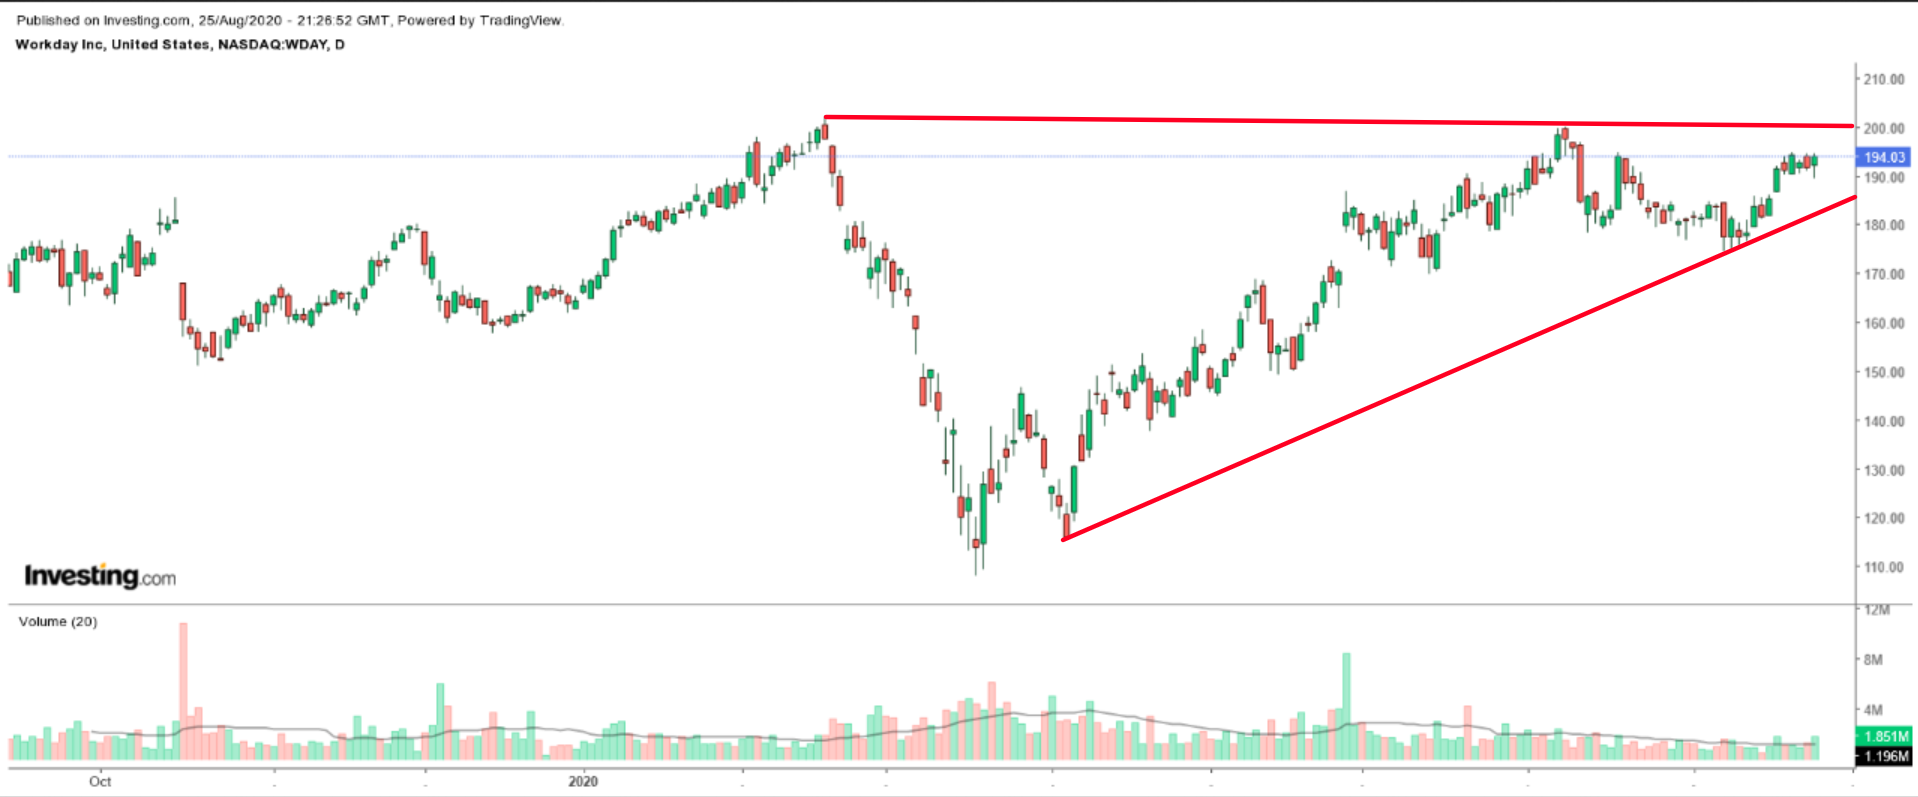
Workday (NASDAQ:WDAY), which offers enterprise-level software solutions for financial management and human resources, has seen its shares rise 80% from their bear market low in March. The Pleasanton, California-based human resources software maker, which currently counts big names like Microsoft (NASDAQ:MSFT) and Salesforce (NYSE:CRM) as customers, is quickly becoming the go-to name in HR management.
The stock closed at $194.03 last night, reapproaching its record high of $202.00 reached in February. At current levels, the human capital management (HCM) firm has a valuation of roughly $45.5 billion.

Although Workday missed earnings estimates in the first quarter, it topped revenue expectations.
For its upcoming release, consensus estimates call for its earnings of $0.66 per share, which would indicate a year-over-year EPS growth rate of 50%. Revenue is expected to climb 17% from the same period a year earlier to $1.04 billion, benefiting from enterprises transitioning to the cloud for managing their payroll and human resources amid the COVID-19 pandemic.
As such, Wall Street will be closely watching subscription services revenue, which accounts for over 85% of Workday's total revenue. It increased by 25.8% year-over-year in the preceding quarter to $882 million.
