- The S&P 500 and Nasdaq have bounced back amid expectations of a potential Fed pivot.
- Positive signals, including the reclaiming of the 200-day moving average and favorable seasonal trends, have fueled market sentiment.
- Strong earnings and historical data indicate that the stock market's long-term uptrend is intact and a strong finish to the year is on the horizon.
- Unlock the potential of InvestingPro for up to 55% off this Black Friday and never miss out on a market winner again
The markets have responded positively to the slowdown in inflation. The S&P 500 showed a robust weekly performance, exceeding a 2% gain so far, while the Nasdaq closely followed suit.
This is partly attributed to the possibility that the Federal Reserve might finally be done with interest rate hikes and a potential pivot could be on the horizon next year.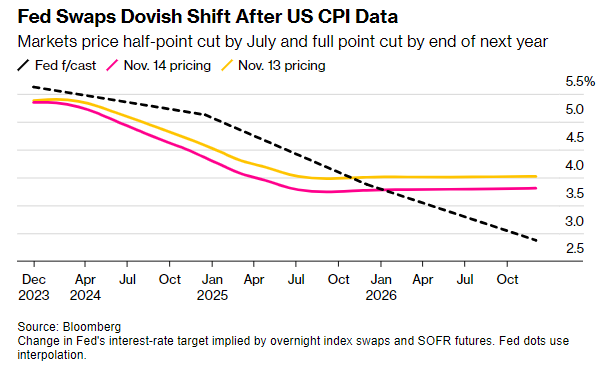
Source: Bloomberg
The current deceleration in inflation has bolstered the belief that the Federal Reserve's rate hike cycle has concluded. Fed swaps are signaling a zero probability of another hike, with the market now anticipating a 50 basis points rate cut by July 2024.
On top of the positive macro outlook, let's take a look at three more reasons why we could be witnessing just the start of a broader and longer rally.
1. 200-Day Moving Average Is an Accumulation Point for Bulls
Despite last week ending the S&P 500's consecutive positive daily streak (8 sessions, the longest since 2023), further upward have movements ensued once again. While the Nasdaq has retraced the yearly highs set in July, Microsoft (NASDAQ:MSFT) has made new all-time highs.
The significance of the 200-day moving average and its potential is often underestimated. Historically, a weak trend breaking the moving average would lead to new lows. However, what goes unnoticed is that it serves as an accumulation point where investors initiate buyback strategies, leading to subsequent recovery.
We find ourselves at a historical turning point as the 200-day moving average has been strongly reclaimed. Moreover, the current moment appears favorable when viewed from a seasonal standpoint, with statistics suggesting a positive outlook for the market from this point onward.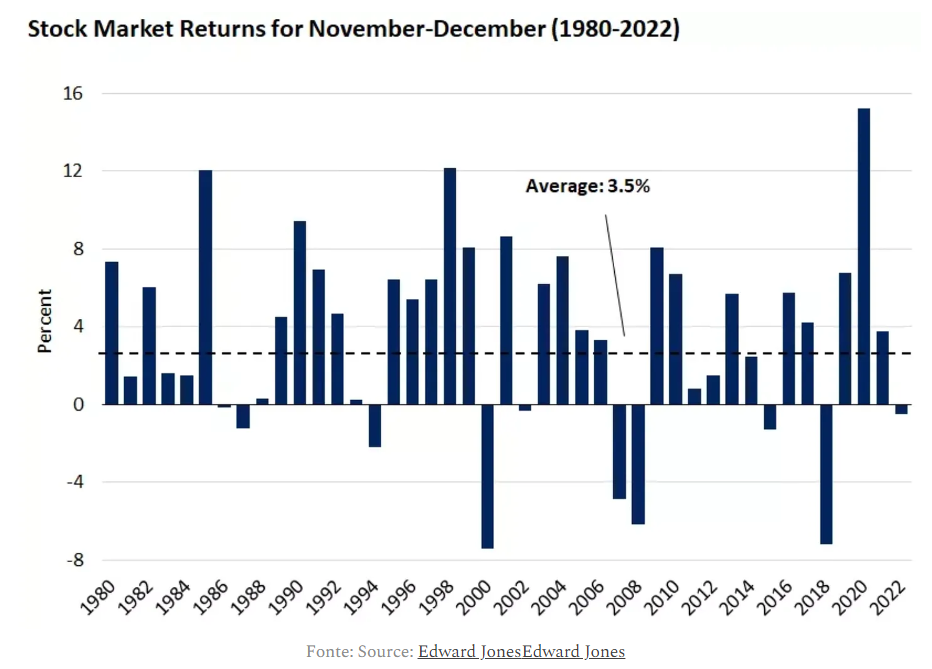
Source: Edward Jones
If we look at the chart, since 1980 November and December returns have been positive 80% of the time, with average returns of +3.5%. There are only 8 of the last 42 years with negative returns. Statistically, there is a very high probability that the market will continue to rally, and the S&P 500 will recover its annual highs between now and year-end.
2. Investor Sentiment Has Taken a U-Turn
According to the AAII survey, which offers information on individual investors' opinions and their expectations for rising stock prices in the next six months, the survey went from the highest bearish level of the year to well below average in one week. In addition, bullish sentiment is 43.8% above the historical average of 37.5% for the fourth time in 14 weeks.
Source: JP Morgan
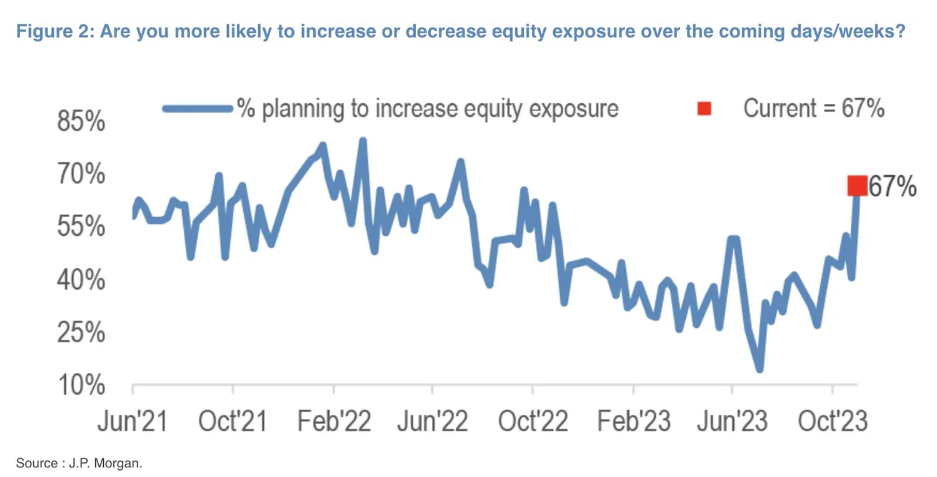
This was also confirmed by the survey conducted by JP Morgan (NYSE:JPM), which asked whether clients were more likely to increase or decrease their equity exposure in the coming weeks, with the result of 67% planning to increase their exposure (the highest figure in over a year).
3. Magnificient 7's Rise Has Scared Off Short Sellers
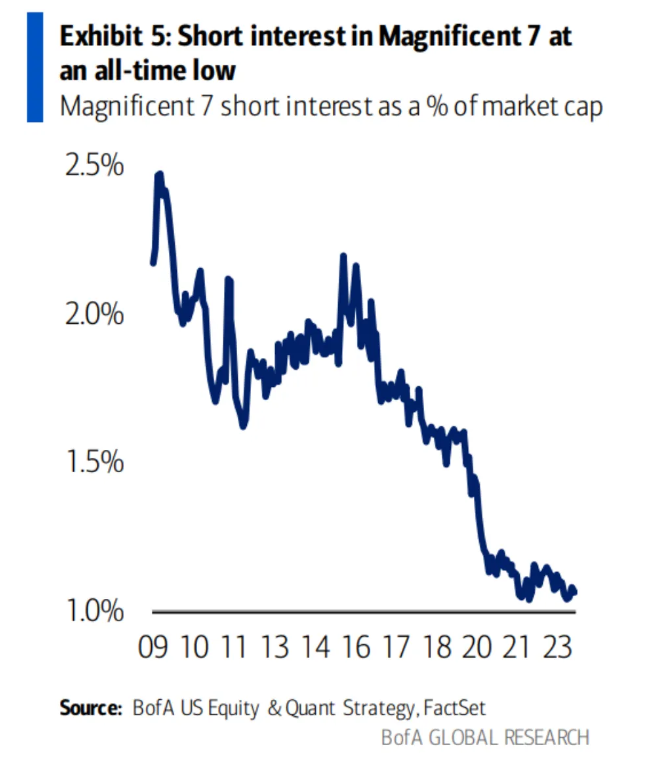
As we can see from the chart below, according to BofA it appears that investors have given up selling short any of the Magnificent 7 stocks leading the market upward.
Source: BoFA US Equity, FactSet
Certainly, polls and sentiments can be unpredictable. However, a more steadfast indicator lies in earnings, the true driver of stock performance. Earnings have consistently outperformed, surpassing expectations by 5.7%, well above the pre-Covid average of 3.7%.
It's crucial to acknowledge that there are years marked by bearish trends and others characterized by robust bullish movements. In the short term, stock prices fluctuate, akin to a roller coaster ride. Yet, in the long term, stock prices exhibit an upward trajectory.
An insightful chart from BofA adds weight to this perspective. It reveals that since 1824, if one had invested $1 in stocks of large U.S. companies, that dollar would have grown to a staggering $16 million by 2023, with dividends reinvested. 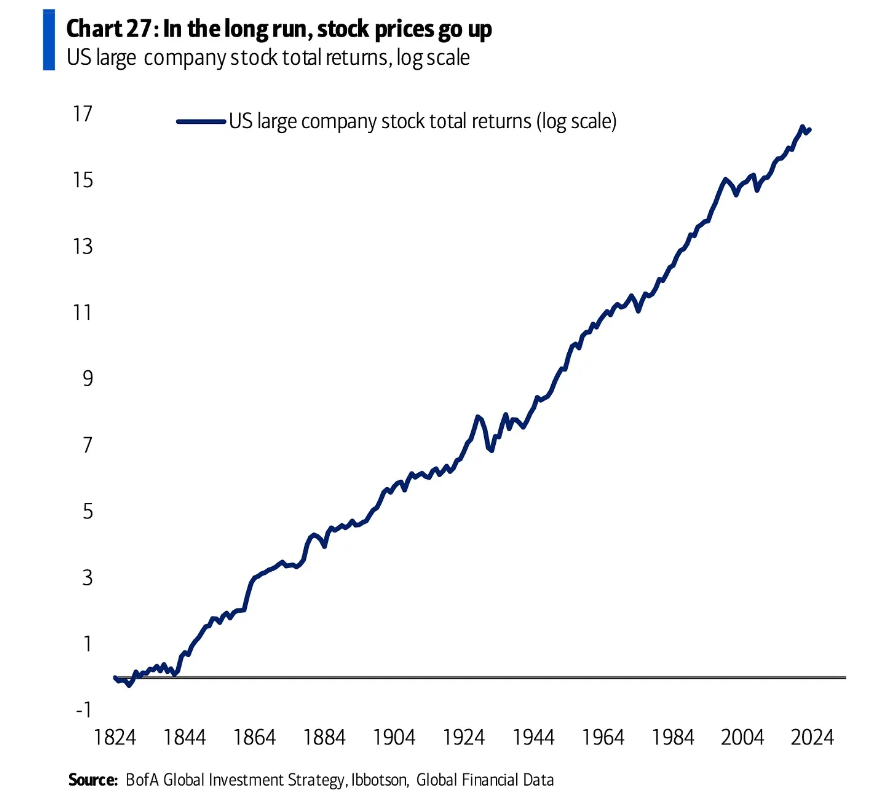
But how can this be? The shorter the investment period, the lower the probability of a positive return. The short term has two variables called volatility and risk. Consequently, when we stretch that time frame, the probability of a positive return increases. Check out the chart below.
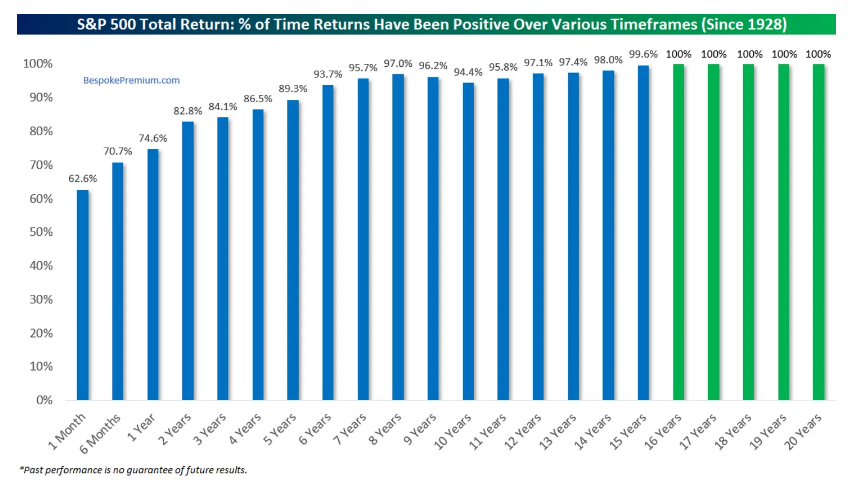
Since 1928, the S&P 500 has consistently yielded positive returns, achieving a 100% success rate for investments lasting 16 years or more.
The inclination to liquidate positions out of fear persists, yet the stock market continues its upward trend. This historical data underscores the value of investing for the long term. 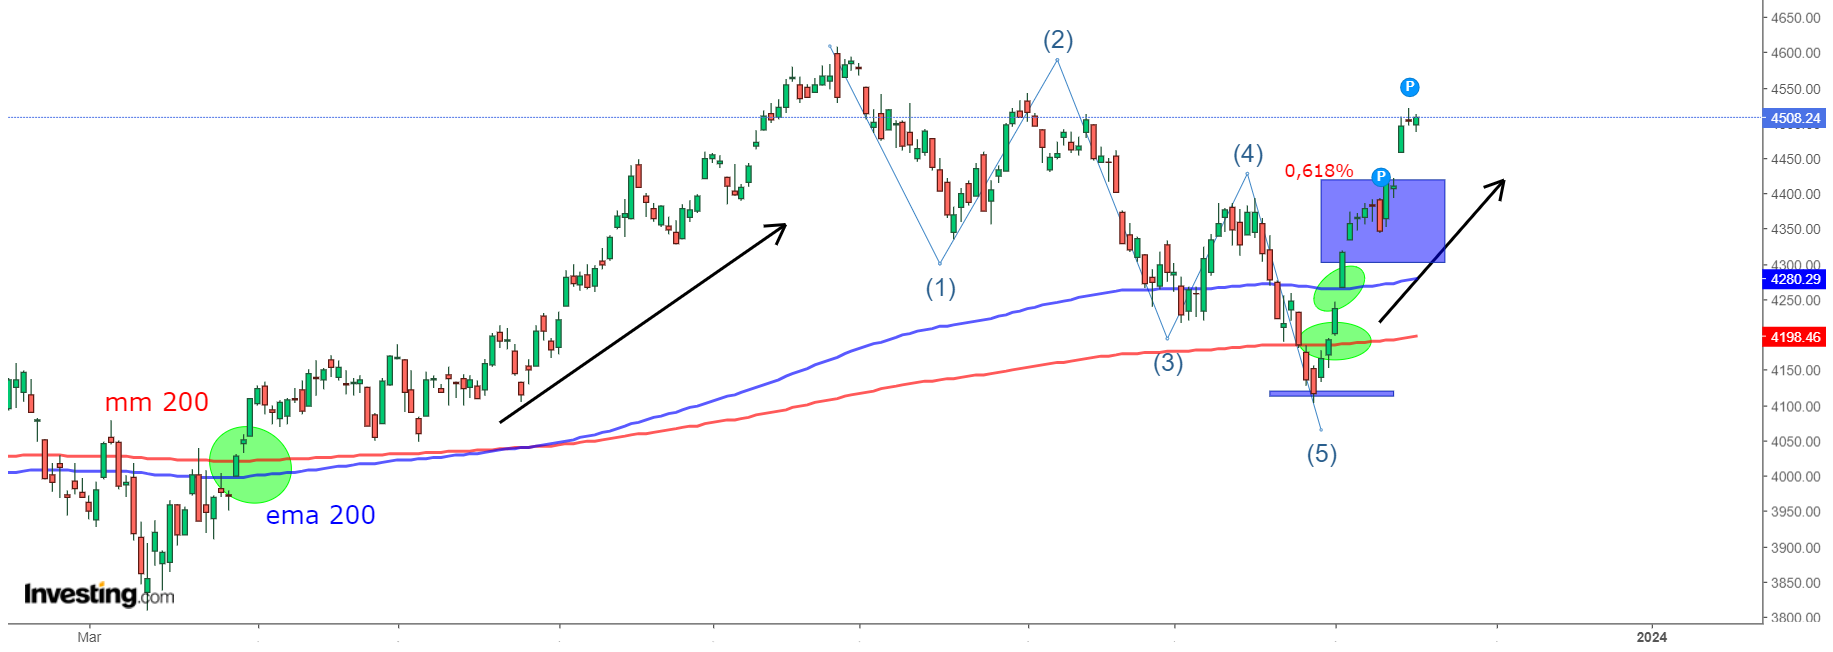
And to date, the long-term uptrend has remained intact.
***
Buy or Sell? Get the answer with InvestingPro for Half of the Price This Black Friday!
Timely insights and informed decisions are the keys to maximizing profit potential. This Black Friday, make the smartest investment decision in the market and save up to 55% on InvestingPro subscription plans.
Whether you're a seasoned trader or just starting your investment journey, this offer is designed to equip you with the wisdom needed for more intelligent and profitable trading.
Disclaimer: This article is written for informational purposes only; it does not constitute a solicitation, offer, advice, or recommendation to invest as such it is not intended to incentivize the purchase of assets in any way. I would like to remind you that any type of asset, is evaluated from multiple points of view and is highly risky and therefore, any investment decision and the associated risk remains with the investor.

