- Buying or holding stocks with a low Altman Z-score is never a good idea
- The score is correct more than 70% of the time if considered two years in advance
- Currently, it indicates that bankruptcy remains in the offing for the five stocks we will discuss in this article
The Altman Z-score formula, developed by Professor Edward Altman in 1960, offers a practical means to gauge a company's financial robustness and its vulnerability to bankruptcy.
With a predictive accuracy of approximately 71-72% over a two-year horizon, it serves as a valuable tool for assessing bankruptcy risks.
Here's a straightforward interpretation of the Altman Z-score:
- If the computed score exceeds 2.99: This signals an enviable financial position, indicating a minimal risk of bankruptcy.
- If the score falls between 1.81 and 2.99: While not exceptionally high, it suggests a moderate risk of bankruptcy within the next two years.
- If the score dips below 1.81: This represents a worrisome scenario, indicating a substantial risk of bankruptcy, potentially in the near future.
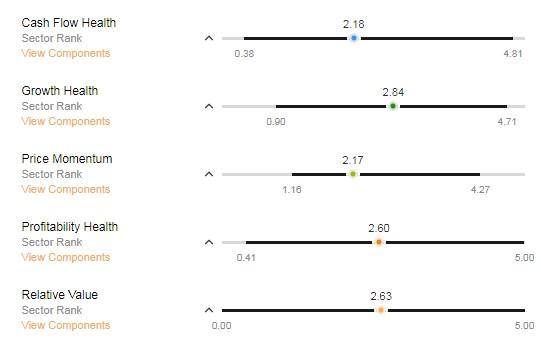
Another method for evaluating a company's financial risk is through InvestingPro's financial health metric, which considers five critical categories: earnings, growth, price momentum, cash flow, and relative value. Each category encompasses a range of metrics and assigns ratings from 1 to 5.
Now, let's delve into an analysis of five stocks that, based on these metrics, might be facing a risk of bankruptcy. We will utilize the InvestingPro tool to identify these stocks and gain insights into the reasons behind their precarious financial positions.
1. ADT
ADT (NYSE:ADT) is a company headquartered in Boca Raton, Florida, specializing in electronic security and fire protection services. The company went public in January 2018. Let's evaluate its financial health:
- Altman Z-score: 0.7
Interpretation: This low score indicates a significant risk of bankruptcy.
- Financial Health Rating: 2.80 out of 5
Interpretation: The rating suggests below-average financial health.
While these metrics are concerning, let's delve into specific financial indicators to better understand ADT's financial situation.
Source: InvestingPro
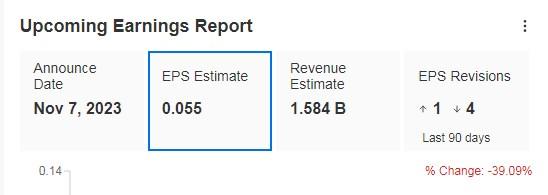
On November 7, it will present results, and a -39.09% drop in earnings per share (EPS) and -7.55% drop in actual revenue is expected.
Source: InvestingPro
It has 3 ratings, of which 1 is hold and 2 are sell.
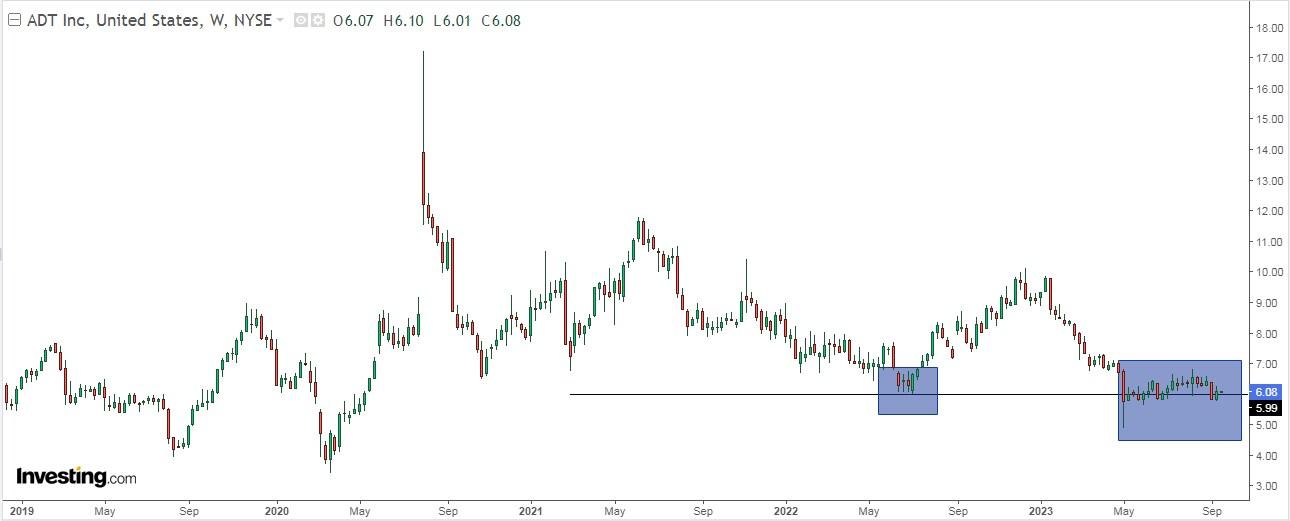
The suspense continues as to whether it will manage to hold the support or lose it.
2. Plymouth Industrial
Plymouth Industrial (NYSE:PLYM) is a full-service real estate investment and property management company specializing in the acquisition, ownership, and management of various types of properties, excluding financial leasing. Let's assess its financial health:
- Altman Z-score: 0.6
Interpretation: A low Z-score suggests a substantial risk of bankruptcy.
- Financial Health Rating: 2.95 out of 5
Interpretation: The rating indicates below-average financial health.
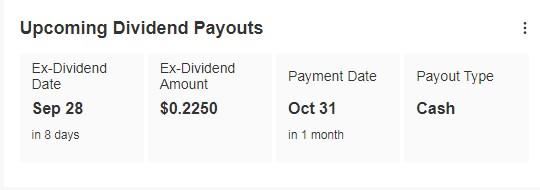
Additionally, it's noteworthy that Plymouth Industrial is set to distribute a dividend of $0.225 per share on October 31st. To qualify for this dividend, investors must hold shares before September 28th. The annual yield is approximately +4.07%.
Despite the dividend offering, the low Altman Z-score implies a significant financial risk. Let's continue examining key financial metrics for further insights.
Source: InvestingPro
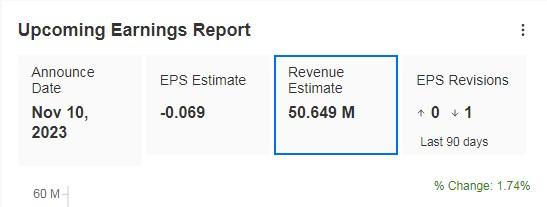
On November 10, it will present earnings and they're expected to be underwhelming.
Source: InvestingPro
InvestingPro's models set a target price of $16.53. None of the 6 ratings are buy, 4 are hold, and 2 are sell.

Source: InvestingPro
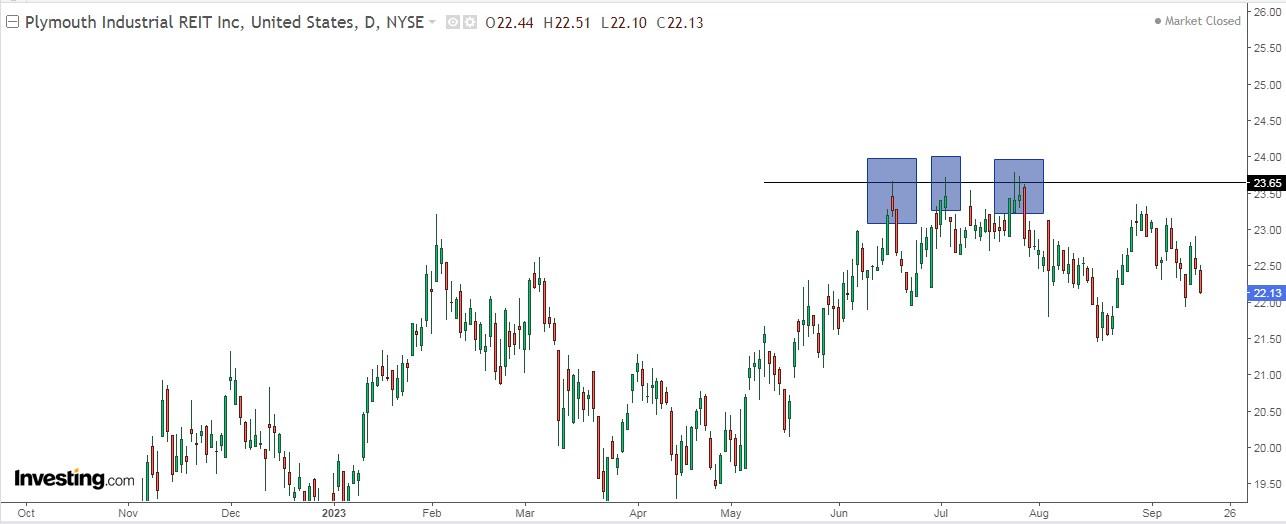
After several attempts, the stock could not overcome resistance.
3. The Hanover Insurance
The Hanover Insurance Group (NYSE:THG) is an insurance company headquartered in Worcester, Massachusetts. Originally founded in 1852 near Hanover Square (NYSE:SQ) in Manhattan, New York, it was formerly known as Allmerica Financial Corporation before adopting its current name in 2005. Now, let's delve into its financial health:
- Altman Z-score: 0.3
Interpretation: A low Z-score suggests a substantial risk of bankruptcy.
- Financial Health Rating: 1.90 out of 5
Interpretation: The rating indicates poor financial health.
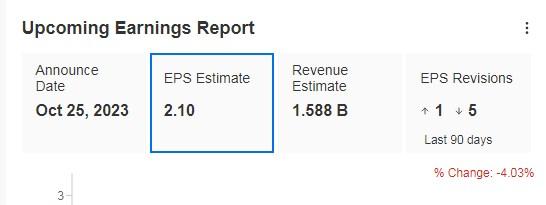
Furthermore, The Hanover Insurance Group is scheduled to release its earnings on October 25th. Market expectations anticipate a -4.03% decline in earnings per share (EPS) and a -43% decline in annual earnings. This data underscores potential challenges faced by the company in the near future.
Given the low Altman Z-score and financial health rating, it's crucial to closely monitor this company's financial performance and results. Let's continue to explore more companies and their financial standings.
Source: InvestingPro
On September 29, it will distribute a dividend of $0.81 per share, and to be eligible to receive it, shares must be held before September 15. The annual yield is +3%.
InvestingPro's models do not see potential. Moreover, they placed their target price at $109.29.

Source: InvestingPro
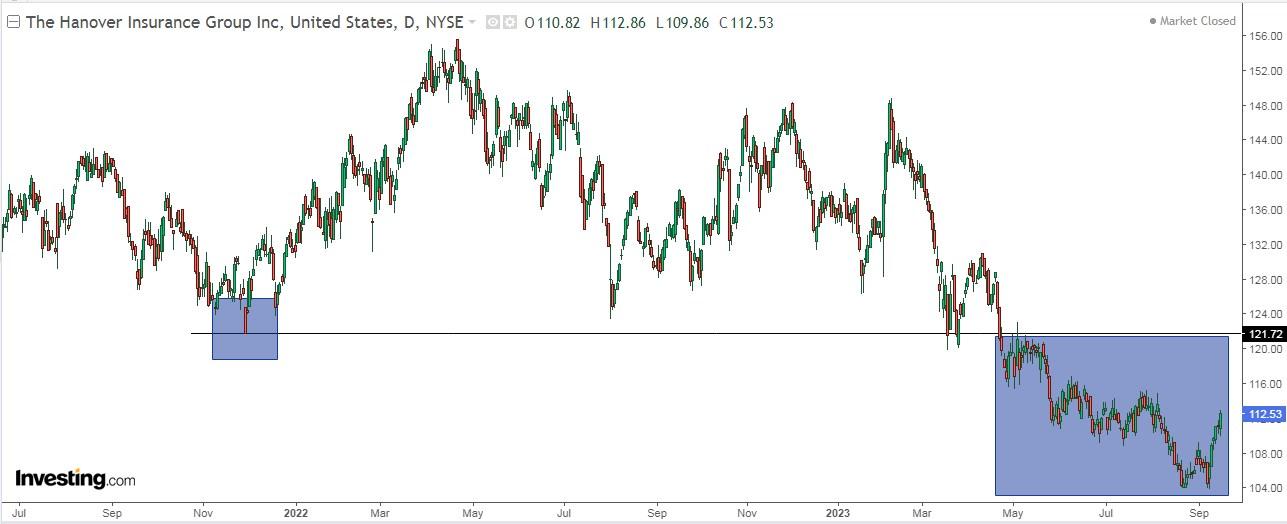
Technically, the stock's loss of support in April triggered the bearish weakness signal.
4. The Marcus Corporation
The Marcus Corporation (NYSE:MCS) is a company based in Milwaukee, Wisconsin, with a history dating back to its founding on November 1, 1935. The company operates primarily through two main divisions: Marcus Theatres and Marcus Hotels and Resorts. Here's a closer look at its financial health:
- Altman Z-score: 1.5
Interpretation: A Z-score of 1.5 suggests a moderate risk of financial distress, though not as severe as some other companies.
- Financial Health Rating: 2.75 out of 5
Interpretation: The rating indicates somewhat moderate financial health.
The Marcus Corporation is slated to release its earnings on October 26th. Market expectations anticipate a -38% drop in earnings per share (EPS) and a -6.77% decrease in actual revenue.
These projections suggest potential challenges that the company may face in the upcoming period.
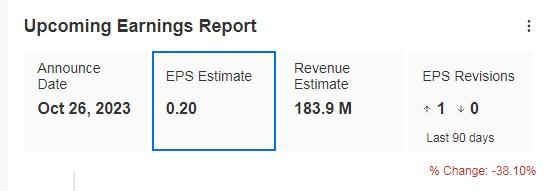
Source: InvestingPro
The current annual dividend yield is +1.7%.
InvestingPro models give it a little upside momentum at $17.47.

Source: InvestingPro
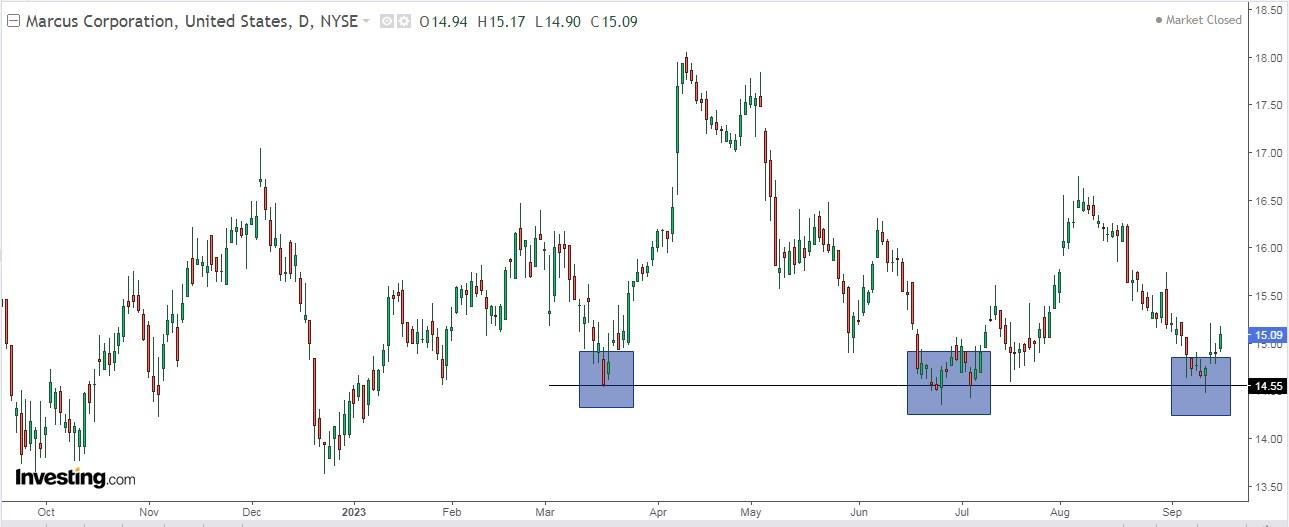
Technically, upport continues to work well. Every time it is touched, it prevents further falls and allows for an interesting bounce to the upside.
5. Cinemark
Cinemark Holdings (NYSE:CNK) is a prominent chain of movie theaters with a presence in several regions, including the United States, Taiwan, the Caribbean, and much of Latin America. Established in 1961, the company's corporate headquarters are situated in Texas. Here's an overview of its financial health:
- Altman Z-score: 1.2
Interpretation: A Z-score of 1.2 indicates a moderate risk of financial distress, emphasizing the need for vigilant financial management.
- Financial Health Rating: 2.95 out of 5
Interpretation: The financial health rating suggests a moderately stable financial position.
Cinemark Holdings is scheduled to release its financial results on November 3rd, with expectations pointing towards a -22.47% decline in earnings per share (EPS). This anticipated decrease in EPS indicates potential challenges that the company may need to address in its upcoming financial reports.
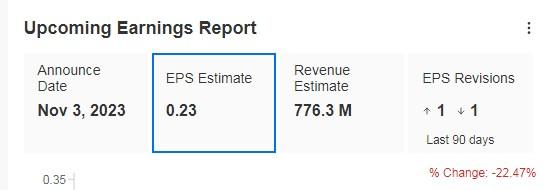
Source: InvestingPro
It presents 6 ratings, of which 3 are hold and 3 are sell. InvestingPro models give it a small upside potential at $18.17.

Source: InvestingPro
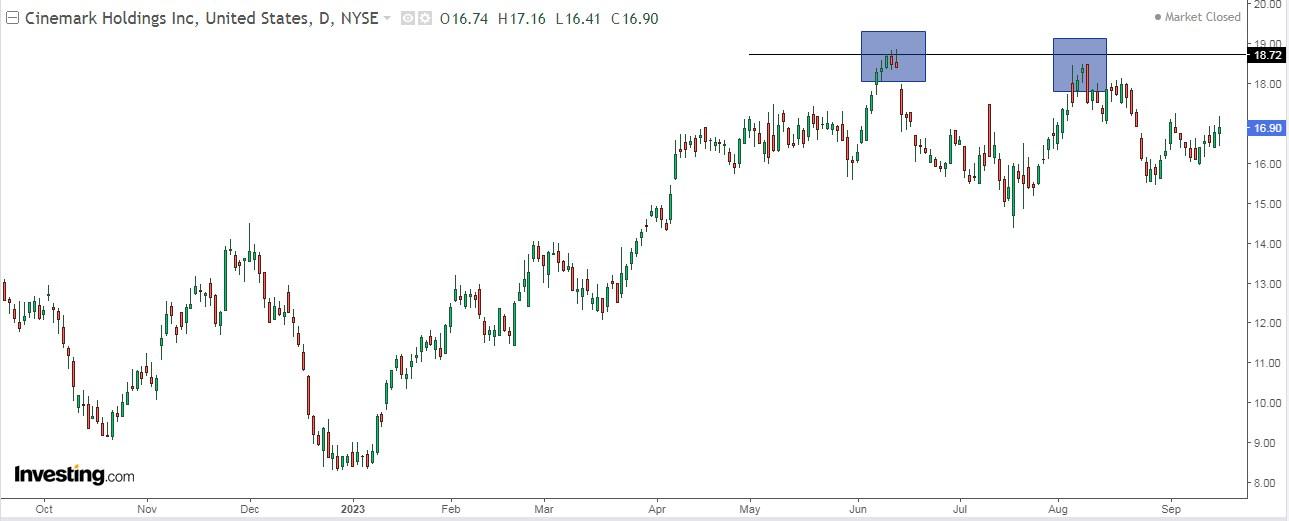
In August, it reached its resistance but failed to break through it.
***
Disclaimer: This article is for information purposes only; it is not intended to encourage the purchase of assets in any way, and does not constitute a solicitation, offer, recommendation, opinion, advice or investment recommendation. We remind you that all assets are considered from different angles and are extremely risky, so that the investment decision and the associated risk are specific to the investor.

