- Recent declines have sparked fears of a bigger selloff.
- However, underlying trends suggest the market still remains in an uptrend.
- In this piece, we'll take a look at 3 factors that support the fact that the indexes are just taking a breather.
- Unlock AI-powered Stock Picks for Under $8/Month: Summer Sale Starts Now!
Recent market volatility has underscored a familiar truth: fear sells. Negative news often captures more attention than positive, creating a sense of urgency to hit the panic button and sell everything.
Even first-time investors have noticed this trend, with sensational headlines often seeking to amplify fears.
Relying solely on news to guide investment decisions can be challenging. To illustrate, consider the historical performance of the S&P 500.
The chart below reveals that the average intra-year decline since 1980 is 14.2%. Despite these dips, the S&P 500 has delivered positive annual returns 33 times out of 44 years. 
Volatility is an inherent part of investing, and understanding this can help investors stay the course. Keeping that in mind, let's consider three things investors should know as market correction deepens, and the urge to sell off takes hold.
1. Majority of S&P 500 Stocks Remain in an Uptrend
The current bullish market, which began from the October 2022 lows and recently rebounded after the 4Q23 pullback, has been marked by concentrated market leadership. While investors hoped for a broader market expansion beyond the Magnificent 7 and mega-cap technology stocks, this summer's rotation is under question.
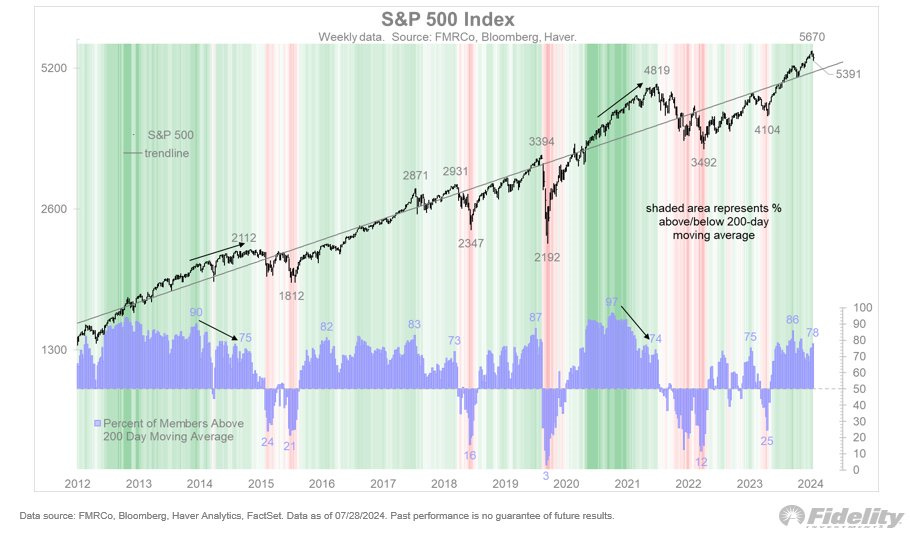
Notably, 78% of the S&P 500 Index components are currently in an uptrend—a higher percentage than in recent weeks—despite the overall index decline. This disparity arises because the performance of the larger companies has overshadowed the strength of the remaining S&P 490 components.
2. July's Market Consolidation Was Healthy
July's market performance reflected a typical consolidation phase, with the S&P 500 achieving a 14.4% annualized gain. Over the past month, 9 out of 11 sectors posted gains, with only technology and communications lagging. Notably, 364 stocks ended the month with positive returns.
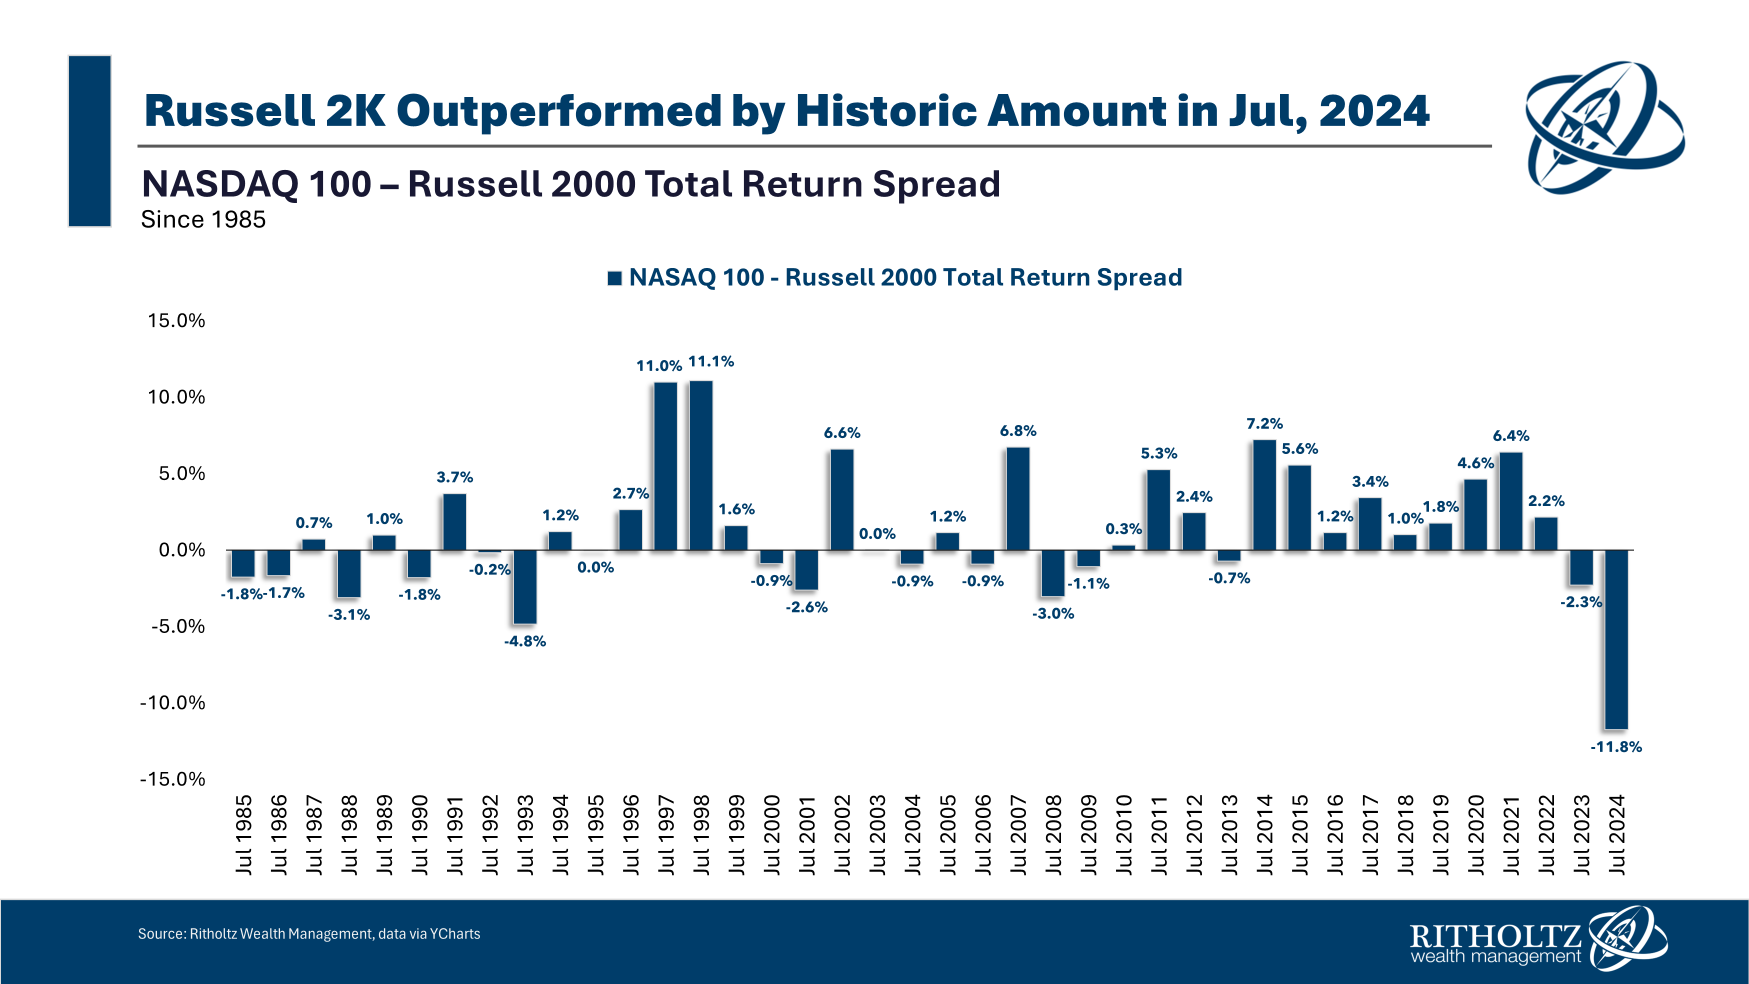
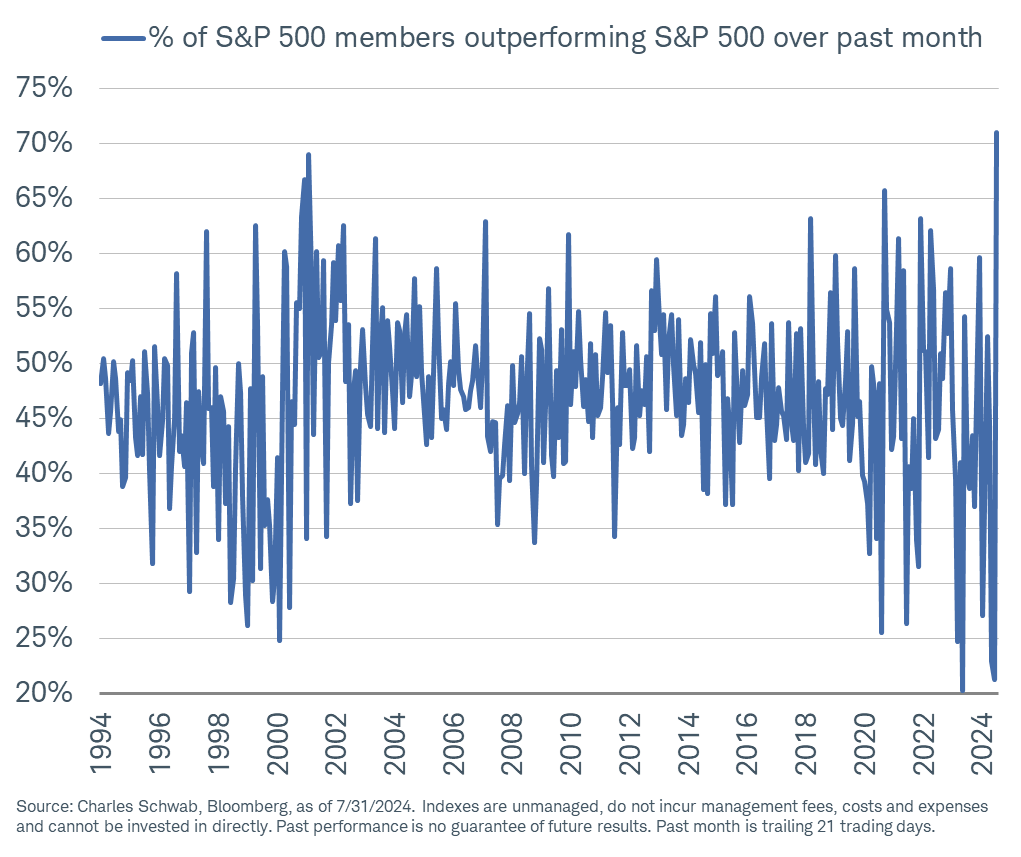
An intriguing development is the 11.8% performance gap between the NASDAQ 100 and the Russell 2000 in July—the largest such disparity on record. This indicates that while the NASDAQ lagged, it coincided with the strongest month of stock performance since the 1990s, with individual stocks outperforming the index by just over 70%.
3. Long-Term Bullish Trend Remains Intact
Currently, the market remains robust, with two-thirds of stocks in a long-term bullish trend, consistently trading above their 50-day and 200-day moving averages. At present, 73.95% of stocks are above the 200-day average, and 64.21% are above the 50-day average—levels that historically signal a strong uptrend.
Percentages above 60% have often preceded positive returns, reflecting a health" market breadth and supporting the likelihood of the index maintaining its bullish trajectory.
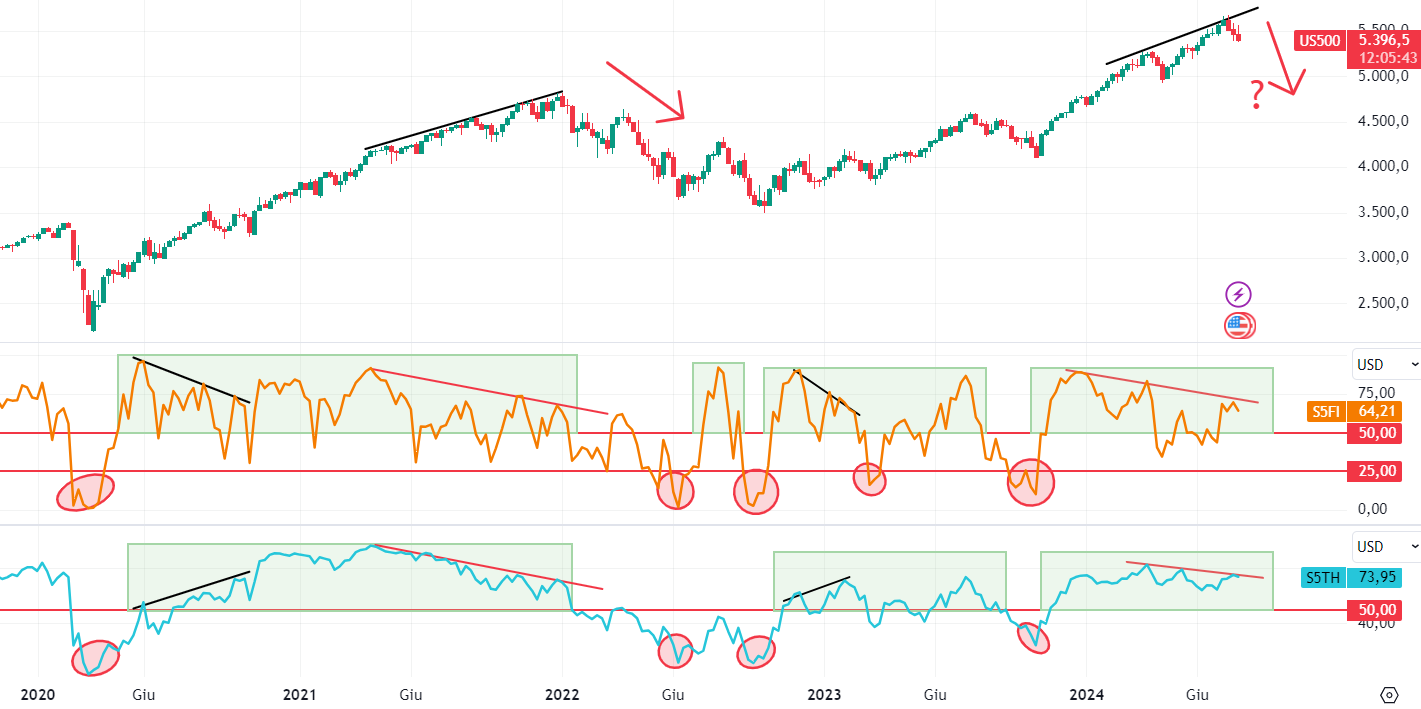
A significant shift would occur if the percentage of stocks above these moving averages dropped below the 55% to 50% range, which could raise investor concerns. However, the market currently does not exhibit signs of severe distress.
Interestingly, when the S&P 500 shows a double divergence from the percentage of stocks above moving averages, as we see now, it often precedes notable declines, followed by strong recoveries.
Bottom Line
While some individual stocks are taking a breather, the overall market is not facing a crisis. The broad market remains in a strong position, with healthy breadth and favorable trends supporting the bullish view.
***
This summer, get exclusive discounts on our subscriptions, including annual plans for less than $8 a month!
Tired of watching the big players rake in profits while you're left on the sidelines?
InvestingPro's revolutionary AI tool, ProPicks, puts the power of Wall Street's secret weapon - AI-powered stock selection - at YOUR fingertips!
Don't miss this limited-time offer.
Subscribe to InvestingPro today and take your investing game to the next level!
Disclaimer:This article is written for informational purposes only; it does not constitute a solicitation, offer, advice, counsel or recommendation to invest as such it is not intended to incentivize the purchase of assets in any way. I would like to remind you that any type of asset, is evaluated from multiple perspectives and is highly risky and therefore, any investment decision and the associated risk remains with the investor.

