During the month of March we saw another action-packed, topsy-turvy, roller coaster ride in the cryptocurrency market. A number of key developments over the past four weeks seemed to sway investor sentiment in support of either a bullish or bearish outlook.
On the bullish side, there was some relief following the G20 Meeting in Argentina in mid-March, as the organization's Financial Stability Board (FSB), which coordinates financial regulation for the Group of 20 Economies, resisted calls from some members to clamp down on the crypto trading.
However, from a bearish perspective, some of the major headlines this past month included reports that South Korea banned all government officials from holding and trading cryptocurrencies; the U.S. Securities and Exchange Commission (SEC) issued a statement saying that online platforms trading digital assets are considered securities and need to register with the agency; and finally Twitter (NYSE:TWTR) imposed a ban on crypto-related advertising, following similar moves by Google (NASDAQ:GOOGL) and Facebook (NASDAQ:FB) earlier this year.
In addition, from the purely technical perspective, most cryptos are in clear downtrends, trading below their respective 200-day moving averages, as well as at levels below their downtrend lines, which usually signals more losses ahead. Not surprisingly, when taking these developments into consideration, the prices of nearly all the big-name mainstream cryptocurrencies including Bitcoin, Bitcoin Cash, Ripple, Dash and Litecoin cratered this month.
Of the 19 digital currencies with a market cap of greater than $1 billion, 18 finished the month in negative territory. Astonishingly, and in stark contrast, only one ended March with gains, highlighting just how ugly the past month has been for cryptocurrencies.
Below we take a look at a few of the biggest losers, the alt-currencies that suffered the steepest declines over the past month and highlight the single coin that managed to outperform and defy the broader market meltdown.
[Editor's note: This post should not be considered an endorsement, nor investment advice. It’s merely reportage. Do your own due diligence before investing in any particular asset or asset class. Coin statistics were collected on March 31, 2018. Values may differ depending upon the date this article is being read.]
Biggest Losers
1. NEO (NEO/USD): March Percentage Change: -62%
NEO, dubbed by many crypto aficionados as the "Ethereum of China," is a blockchain platform and cryptocurrency which enables the development of digital assets and smart contracts. The price of one NEO coin changed hands at $128.37 on March 1, before collapsing to $49.56 on March 31, its weakest level since December 22.
It ended the month at $50.22, representing a whopping monthly decline of 62%. Year-to-date, NEO is down roughly 40% after starting the year at $75.02. It hit its highest level on record at $193.70 on Jan. 15. At current prices, NEO ranks as the ninth biggest cryptocurrency in circulation, with a market cap of roughly $3.0 billion.
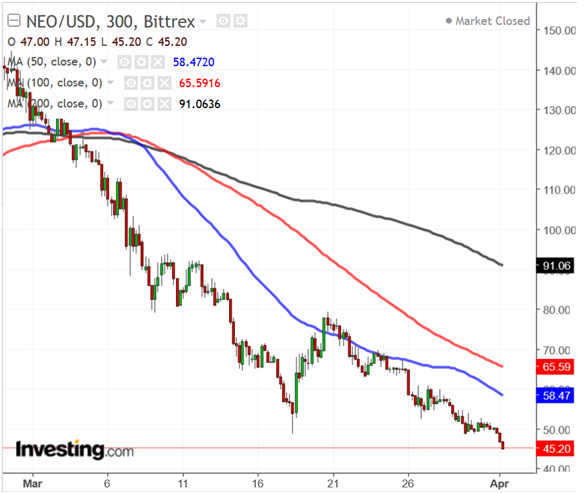
Losses during the past month were not sparked by any particular event, but rather by the overall bearish trend that has gripped the cryptocurrency market in recent weeks. From a technical standpoint, NEO/USD needs to reclaim its 50-day moving average (DMA) at around $58.50 to reduce immediate price pressure. Once this hurdle is cleared, the coin may try its luck at recouping its 100-DMA above the $65-level.
On the downside, any sustained move below the $45.00 support level may trigger a massive sell-off towards $30, which is the next level of support that held throughout December.
2. Ethereum (ETH/USD): March Percentage Change: -53.8%
Ethereum is an open software platform based on blockchain technology that enables developers to build and deploy decentralized applications that run smart contracts. It was proposed in late 2013 by Vitalik Buterin, a cryptocurrency researcher and programmer, and launched in 2015. It's currently the number 2 most popular digital currency by market cap.
The price of one Ethereum coin stood at $869.24 on March 1, before sinking to $364.66 on March 30, its weakest level since November 22, 2017. It ended the month at $392.97, for a loss of about 53.8%. Ethereum is down around 51% so far this year after starting at $737.77 on January 1. It rose to an all-time peak of $1,423.20 on January 13.
At current levels, Ethereum has a market cap of approximately $37.4 billion, trailing only Bitcoin.
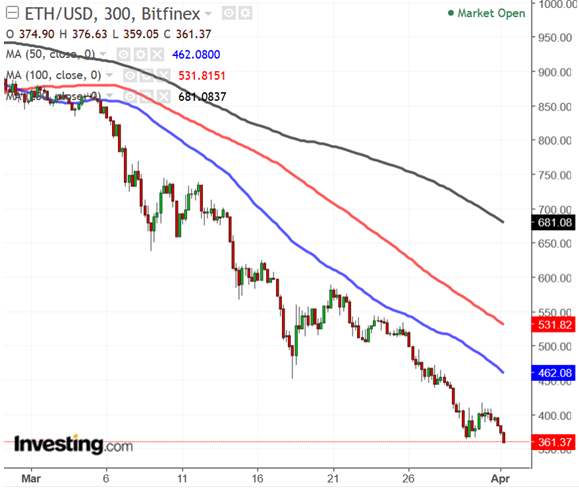
Like the rest of the crypto market, Ethereum has been on a downward spiral for the past few weeks, with no specific fundamental catalyst driving the sharp downward move. Some in the market have attributed the steep price decline to a recent blog post by Buterin in which he proposed initiating "rent fees" which would be levied on individuals who use the Ether network to store data.
In terms of the technical chart, action does not look constructive as long as prices remain below their 50-, 100- and 200-day moving averages. This indicates complete dominance by the bears. If the $350 support zone breaks, the next support zone is between $275 and $300.
3. Cardano (ADA/USD): March Percentage Change: -50.5%
Cardano is a technology platform that runs the Ada cryptocurrency. Launched by blockchain development firm Input Output Hong Kong (IOHK) and led by Charles Hoskinson, former co-founder of Ethereum, the platform is capable of running financial applications, smart contracts, and decentralized applications.
Cardano's price on March 1 was $0.30001, before sinking approximately 50.5% to end the month at $0.15020. The digital currency sank to a lifetime low of $0.12330 on March 18.
It's currently the seventh most valuable alt-currency in circulation with a market cap of around $3.7 billion. Cardano is down roughly 80% so far this year, making it the worst performing cryptocurrency so far in 2018.
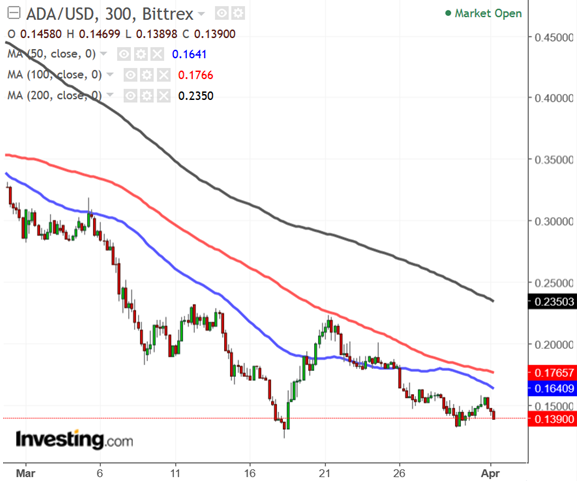
For the most part there has been no particular reason for the enormous crash in Cardano's price. Some have pointed to the fact that it's very popular among traders in South Korea (over 41% of all Cardano transactions processed in March were on the South Korean cryptocurrency exchange Upbit). Accordingly, some have speculated that the tighter approach to digital assets adopted by the regulators in the country and their clampdown on anonymity and money laundering issues may have affected Cardano price dynamics to the downside.
From a technical view, ADA/USD needs to climb above the 50DMA close to $0.1640 in the near-term to ease the relentless selling pressure. Over the longer-term, Cardano needs to reclaim its 100DMA at $0.1766 for an extended recovery.
However, if the current bearish trend continues, ADA may slide back to retest its recent low around the $0.12-handle.
Not So Honorable Mentions
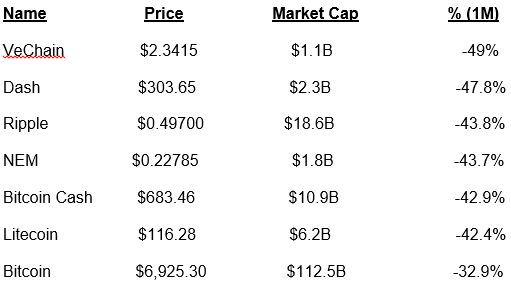
Aside from the three digital coins mentioned above, additional big losers this past month included:
The Only Gainer
1. Binance Coin (BNB/USD) March Percentage Change: +5.7%
Binance Coin is the signature virtual token of the popular China-based crypto exchange Binance, which supports around 100 other digital currencies as well and is one of the world’s leading exchanges for Bitcoin, Ethereum and Tether. Launched in July 2017, BNB is used as an alternative method for paying Binance’s trading fees.
Binance Coin ended March at $11.0510, a gain of approximately 5.7% for the month. Its opening price on March 1 was $10.4970, before surging by as much as 30% to a two-month peak of $14.9300 on March 24.
At current prices, it has a market cap of nearly $1.1 billion, making it the 19th biggest digital currency. BNB climbed to a record high of $24.64 on January 12.
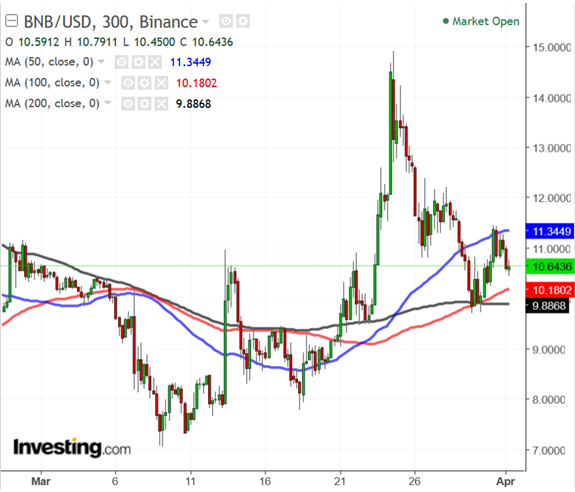
Binance Coin has been outperforming other coins in the current bearish market. The currency is in high demand thanks to the growing popularity of the Binance exchange.
This positive trend amid the sea of negativity currently overpowering the cryptocurrency market should not be underestimated.
From a technical point of view, the price action looks bullish, as long as it holds above the key moving averages and trend lines. A successful break and close above the March high at around $15.00 would open the door to further gains.
