Newmont beats expectations as gold prices surge, reports record cash flow
- Bitcoin has been consolidating around $63,000 despite broader market declines.
- But, the double-top pattern and struggle to get back above $70k raises concerns of a correction.
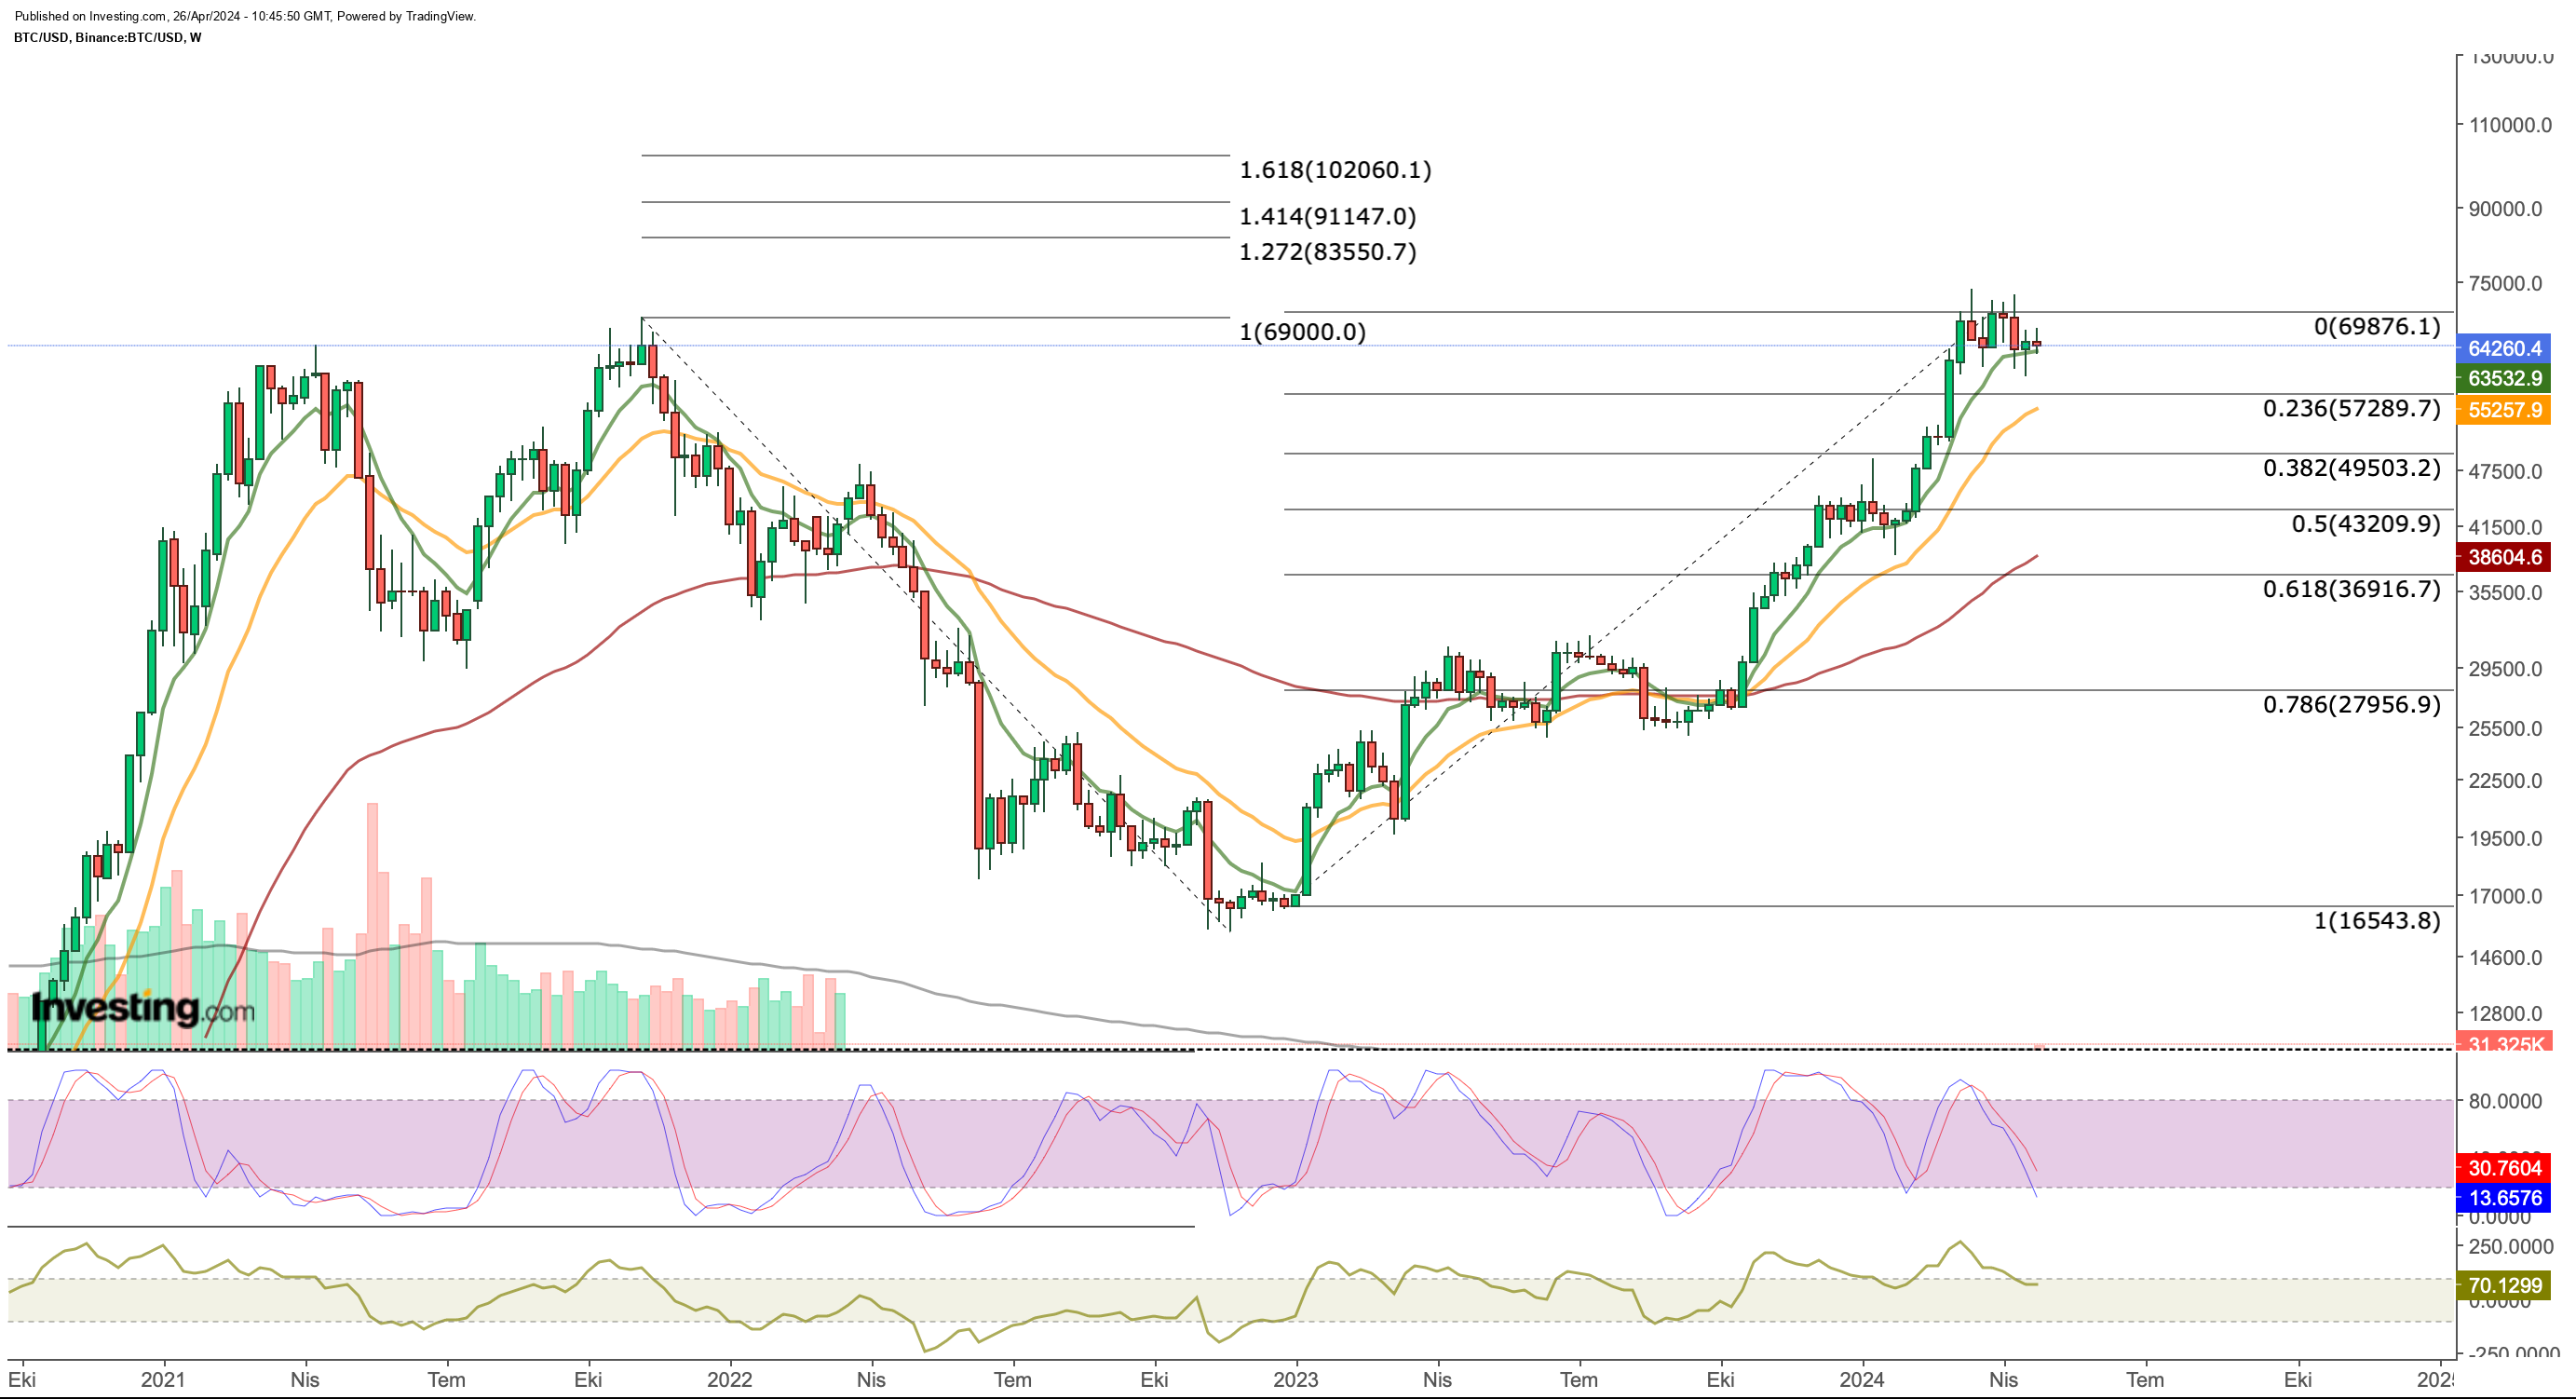
- Critical support levels, such as the 21-week EMA at $55,200, should be monitored closely in case of a potential correction.
- Invest like the big funds for less than $9 a month with our AI-powered ProPicks stock selection tool. Learn more here>>
Bitcoin has been stuck in a holding pattern for the past four weeks, with prices consolidating around the $63,000 mark. While the broader cryptocurrency market has seen steeper declines, Bitcoin has shown some short-term resilience.
While Bitcoin remains above its previous all-time high, it's worth noting that weekly closes just below $70,000 have consistently triggered selling, keeping the price in a squeeze for the past two months.
Bitcoin Weekly Chart Analysis
A closer look at the weekly chart reveals a double-top pattern formed by two peaks at similar price levels in late 2021. While corrections followed both peaks, Bitcoin ultimately entered a bear market in 2022 after falling below its 89-week Exponential Moving Average (EMA). The recovery process began last year, accelerating after a bullish crossover of the fast and slow EMAs in October 2023.

Bitcoin's recent struggle to maintain prices above $70,000 raises concerns about a potential correction. Similar price oscillations occurred in 2021, suggesting a repeat could be on the horizon.
Several critical support levels should be monitored closely. If a clear weekly candle closes below $63,500, it could trigger a correction. The next potential support zone lies at the 21-week EMA, currently around $55,200. If the price falls further, historically established support levels from 2023's downtrend at $49,500, $43,200, and $36,900 could come into play.
What Could Spark a Downtrend?
Multiple factors could act as catalysts for a downward trend.
- Short-Term Pullback: Historically, periods of long-term bullishness after halving events have been followed by temporary pullbacks.
- Slowdown in Spot ETF inflows: The recent surge in Bitcoin might be fueled by spot ETF inflows. A slowdown could dampen the uptrend.
- Fed Policy Shift: While the Fed initially anticipated rate cuts, recent signals suggest a pause or even tightening. This hawkish stance could reduce risk appetite in the market, including cryptocurrencies.
- Geopolitical Tensions: Global uncertainty, as seen during the Israel-Iran conflict, can lead to sharp declines in the crypto market.
Bullish Signs to Watch Out for
On the other hand, a weekly close above $70,000 could signal a positive outlook and a potential move towards $80,000. The cryptocurrency market is inherently dynamic and susceptible to various influences.
Traders should closely monitor price movements around support and resistance levels, and stay informed about global events and market developments.
***
Take your investing game to the next level in 2024 with ProPicks
Institutions and billionaire investors worldwide are already well ahead of the game when it comes to AI-powered investing, extensively using, customizing, and developing it to bulk up their returns and minimize losses.
Now, InvestingPro users can do just the same from the comfort of their own homes with our new flagship AI-powered stock-picking tool: ProPicks.
With our six strategies, including the flagship "Tech Titans," which outperformed the market by a lofty 1,745% over the last decade, investors have the best selection of stocks in the market at the tip of their fingers every month.
Subscribe here and never miss a bull market again!

Disclaimer: This content, which is prepared purely for educational purposes, cannot be considered as investment advice. We also do not provide investment advisory services.
