- Geopolitical tensions and strong U.S. data have pushed Bitcoin down to support near $60,000.
- Today’s Non-Farm Payroll report may spark volatility, impacting Bitcoin’s recovery.
- Key resistance at $61,500 is vital for Bitcoin's rebound; a drop below $61,250 could reignite selling pressure.
- Looking for actionable trade ideas to navigate the current market volatility? Unlock access to InvestingPro’s AI-selected stock winners for under $9 a month!
Bitcoin's recent decline was triggered by a combination of factors, including geopolitical tensions and better-than-expected U.S. economic data. After a sharp pullback, the coin found support near $60,000.
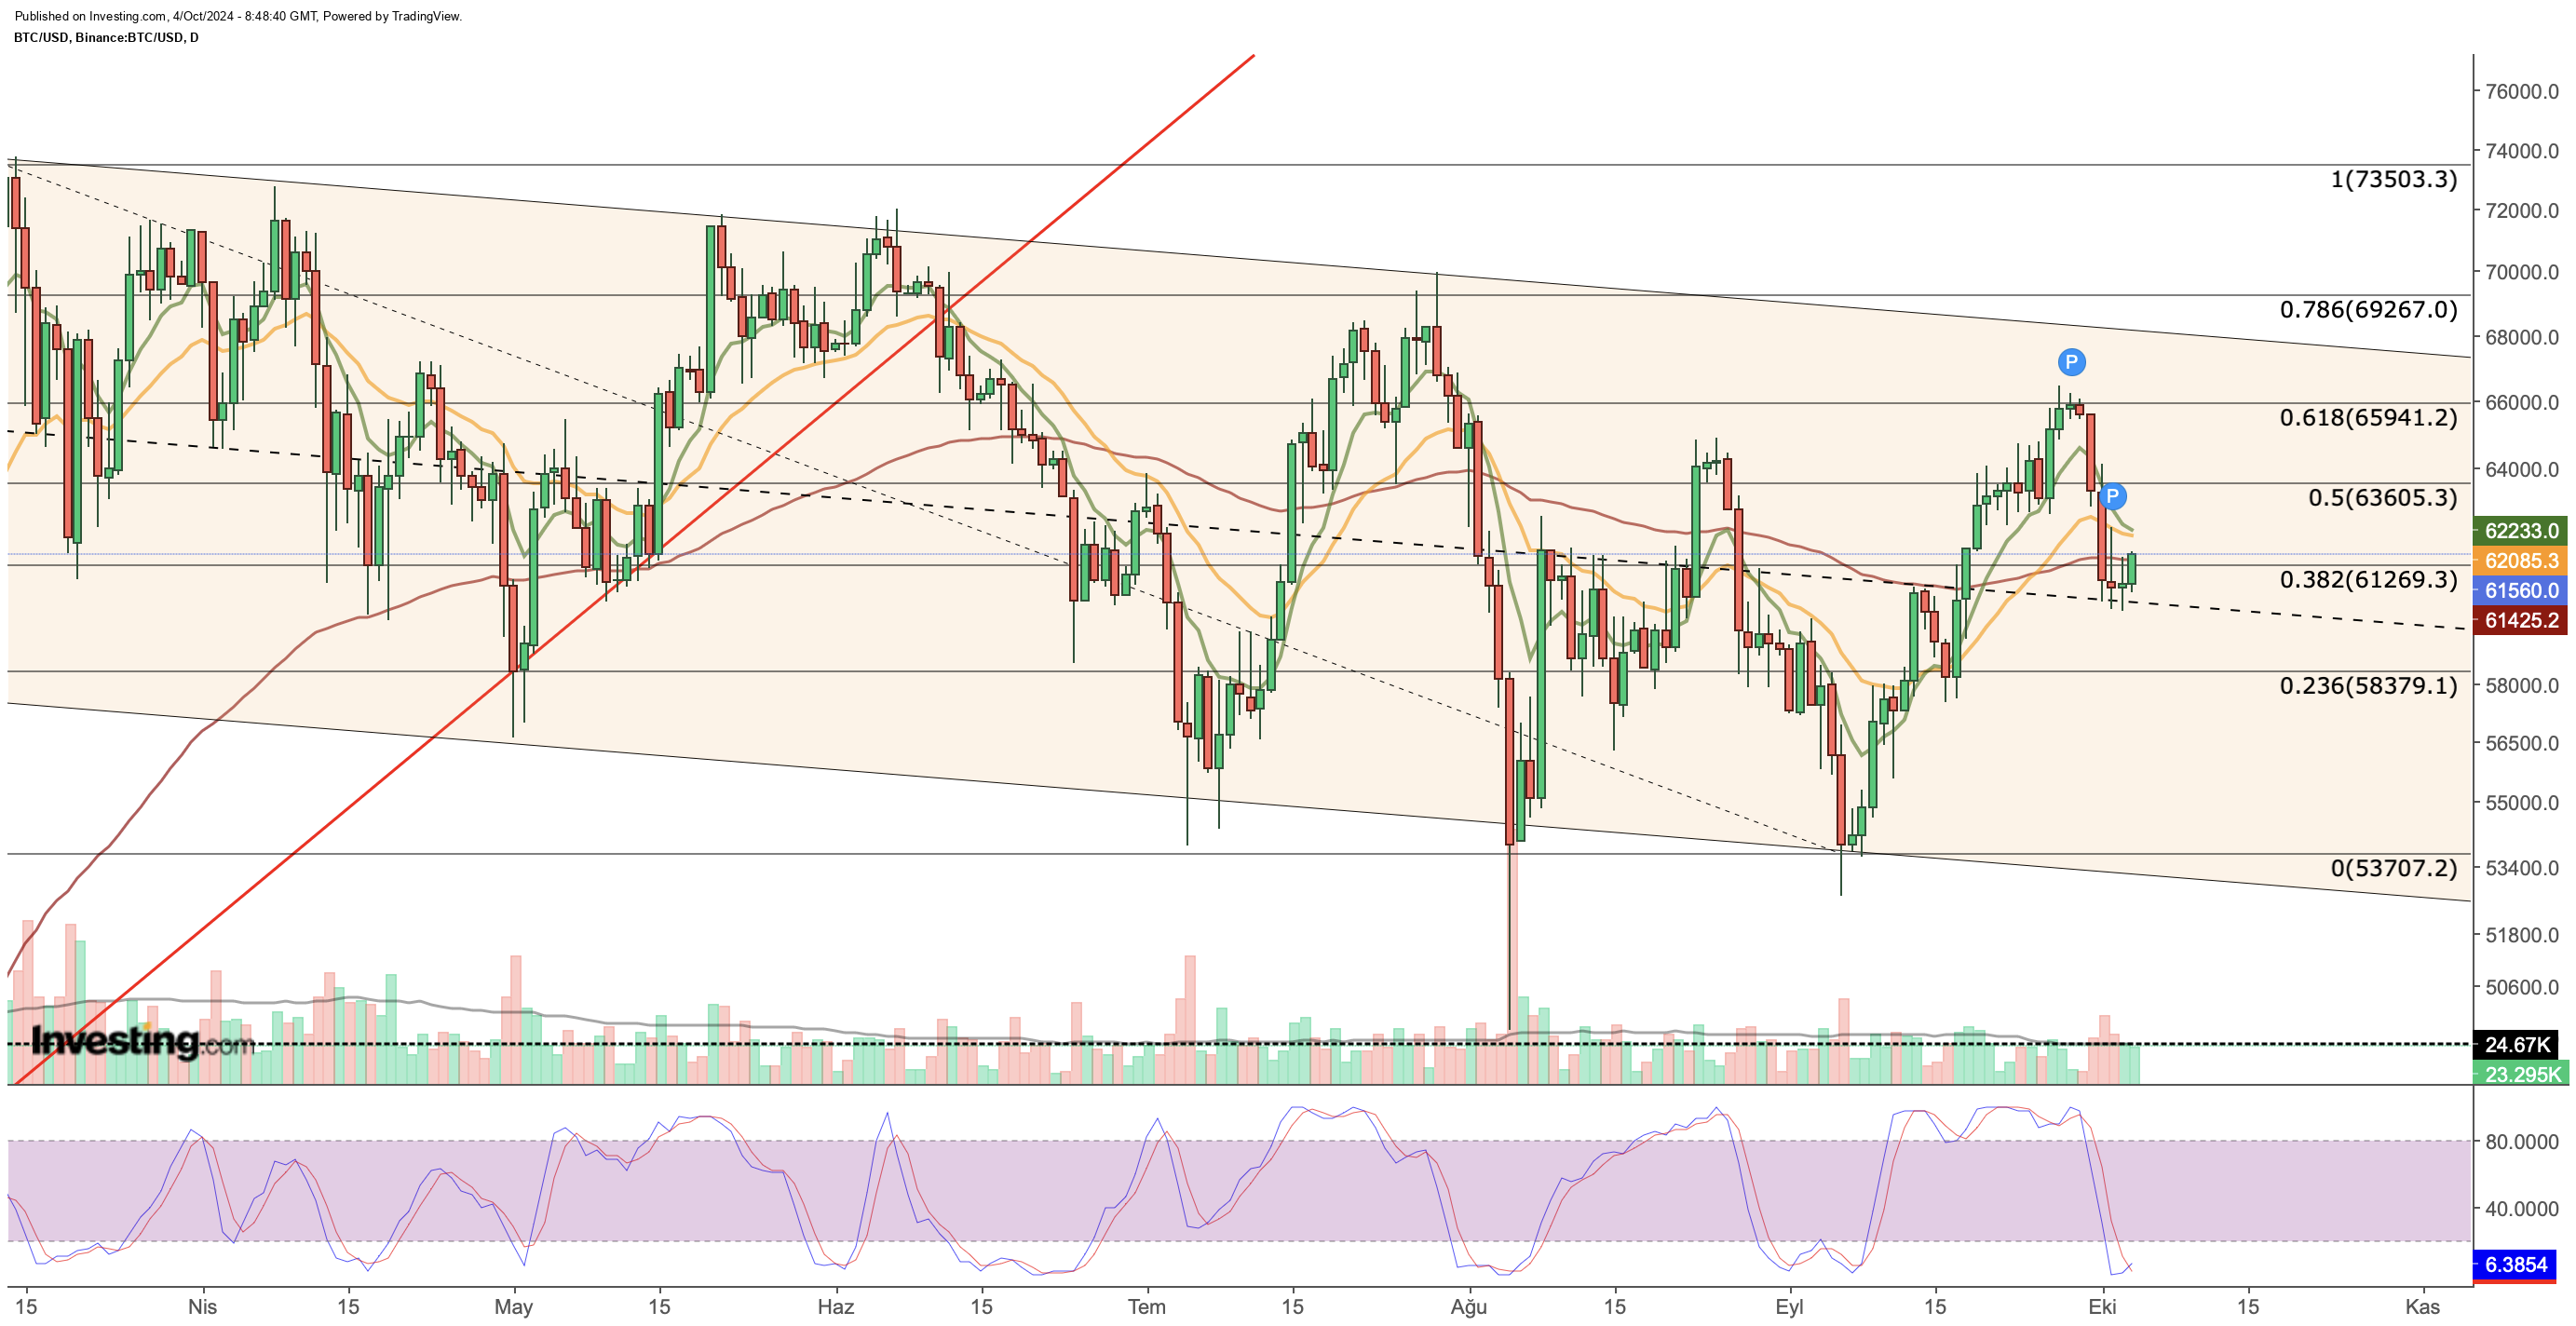
This price action represents a correction following the impressive rally that drove Bitcoin from an average of $53,700 to $66,000 in early September.
The current decline seems tied to rising geopolitical tensions in the Middle East, along with upbeat U.S. employment data that has strengthened the US dollar.
Looking at the bigger picture, the recent labor data has given the Federal Reserve some breathing room to take a more cautious approach to interest rate cuts.
This has become a familiar excuse for the recent pullback in riskier assets like Bitcoin.
Yet, as recession fears in the U.S. begin to fade and the Fed’s interest rate outlook appears more dovish, the medium-term outlook for Bitcoin and other cryptocurrencies looks more promising.
Today’s nonfarm payrolls report, along with unemployment figures and average hourly earnings, could shake things up, leading to increased volatility as the weekend approaches.
If today’s employment numbers align with previous figures, we might see more demand for the dollar, which could slow Bitcoin's recovery.
On the flip side, weaker data could lead the Fed to consider larger interest rate cuts, potentially boosting risk appetite if geopolitical tensions remain low.
What Lies Ahead for Bitcoin?
This recent correction in Bitcoin has raised questions about its reputation as a safe haven—often likened to "digital gold."
With geopolitical risks on the rise, investors seem to be flocking to dollar-denominated assets and gold, resulting in Bitcoin’s notable 8% decline this week.
The cryptocurrency is starting to resemble a tech stock more than a safe haven asset. This trend is reminiscent of what we saw back in April when Iran first attacked Israel, where a lack of immediate response eased tensions temporarily.
However, the current anticipation of a possible retaliation from Israel continues to weigh heavily on investor sentiment, putting pressure on Bitcoin's demand.
As traders look to today’s employment data, how the market reacts will be crucial. Strong numbers could further boost the dollar and hinder Bitcoin's rebound.
On the other hand, weaker figures might revive interest in crypto assets, but significantly poor data could reignite recession fears and lead to a sell-off in risky investments. Ideally, a balanced outcome would keep the market stable.
Key Support and Resistance Levels for Bitcoin
From a technical perspective, the last couple of days have shown that selling pressure in the Bitcoin market is easing.
As a result, Bitcoin opened the final trading day of the week with a renewed sense of buying interest, finding support around the $60,000 mark.

Today's upward movement is important for turning the Fibonacci 0.382 level at $61,250 into a solid support area.
If Bitcoin can hold gains above $61,500 early in the day, it could encourage more buyers to step in, possibly pushing prices back toward the $63,000-$65,000 range.
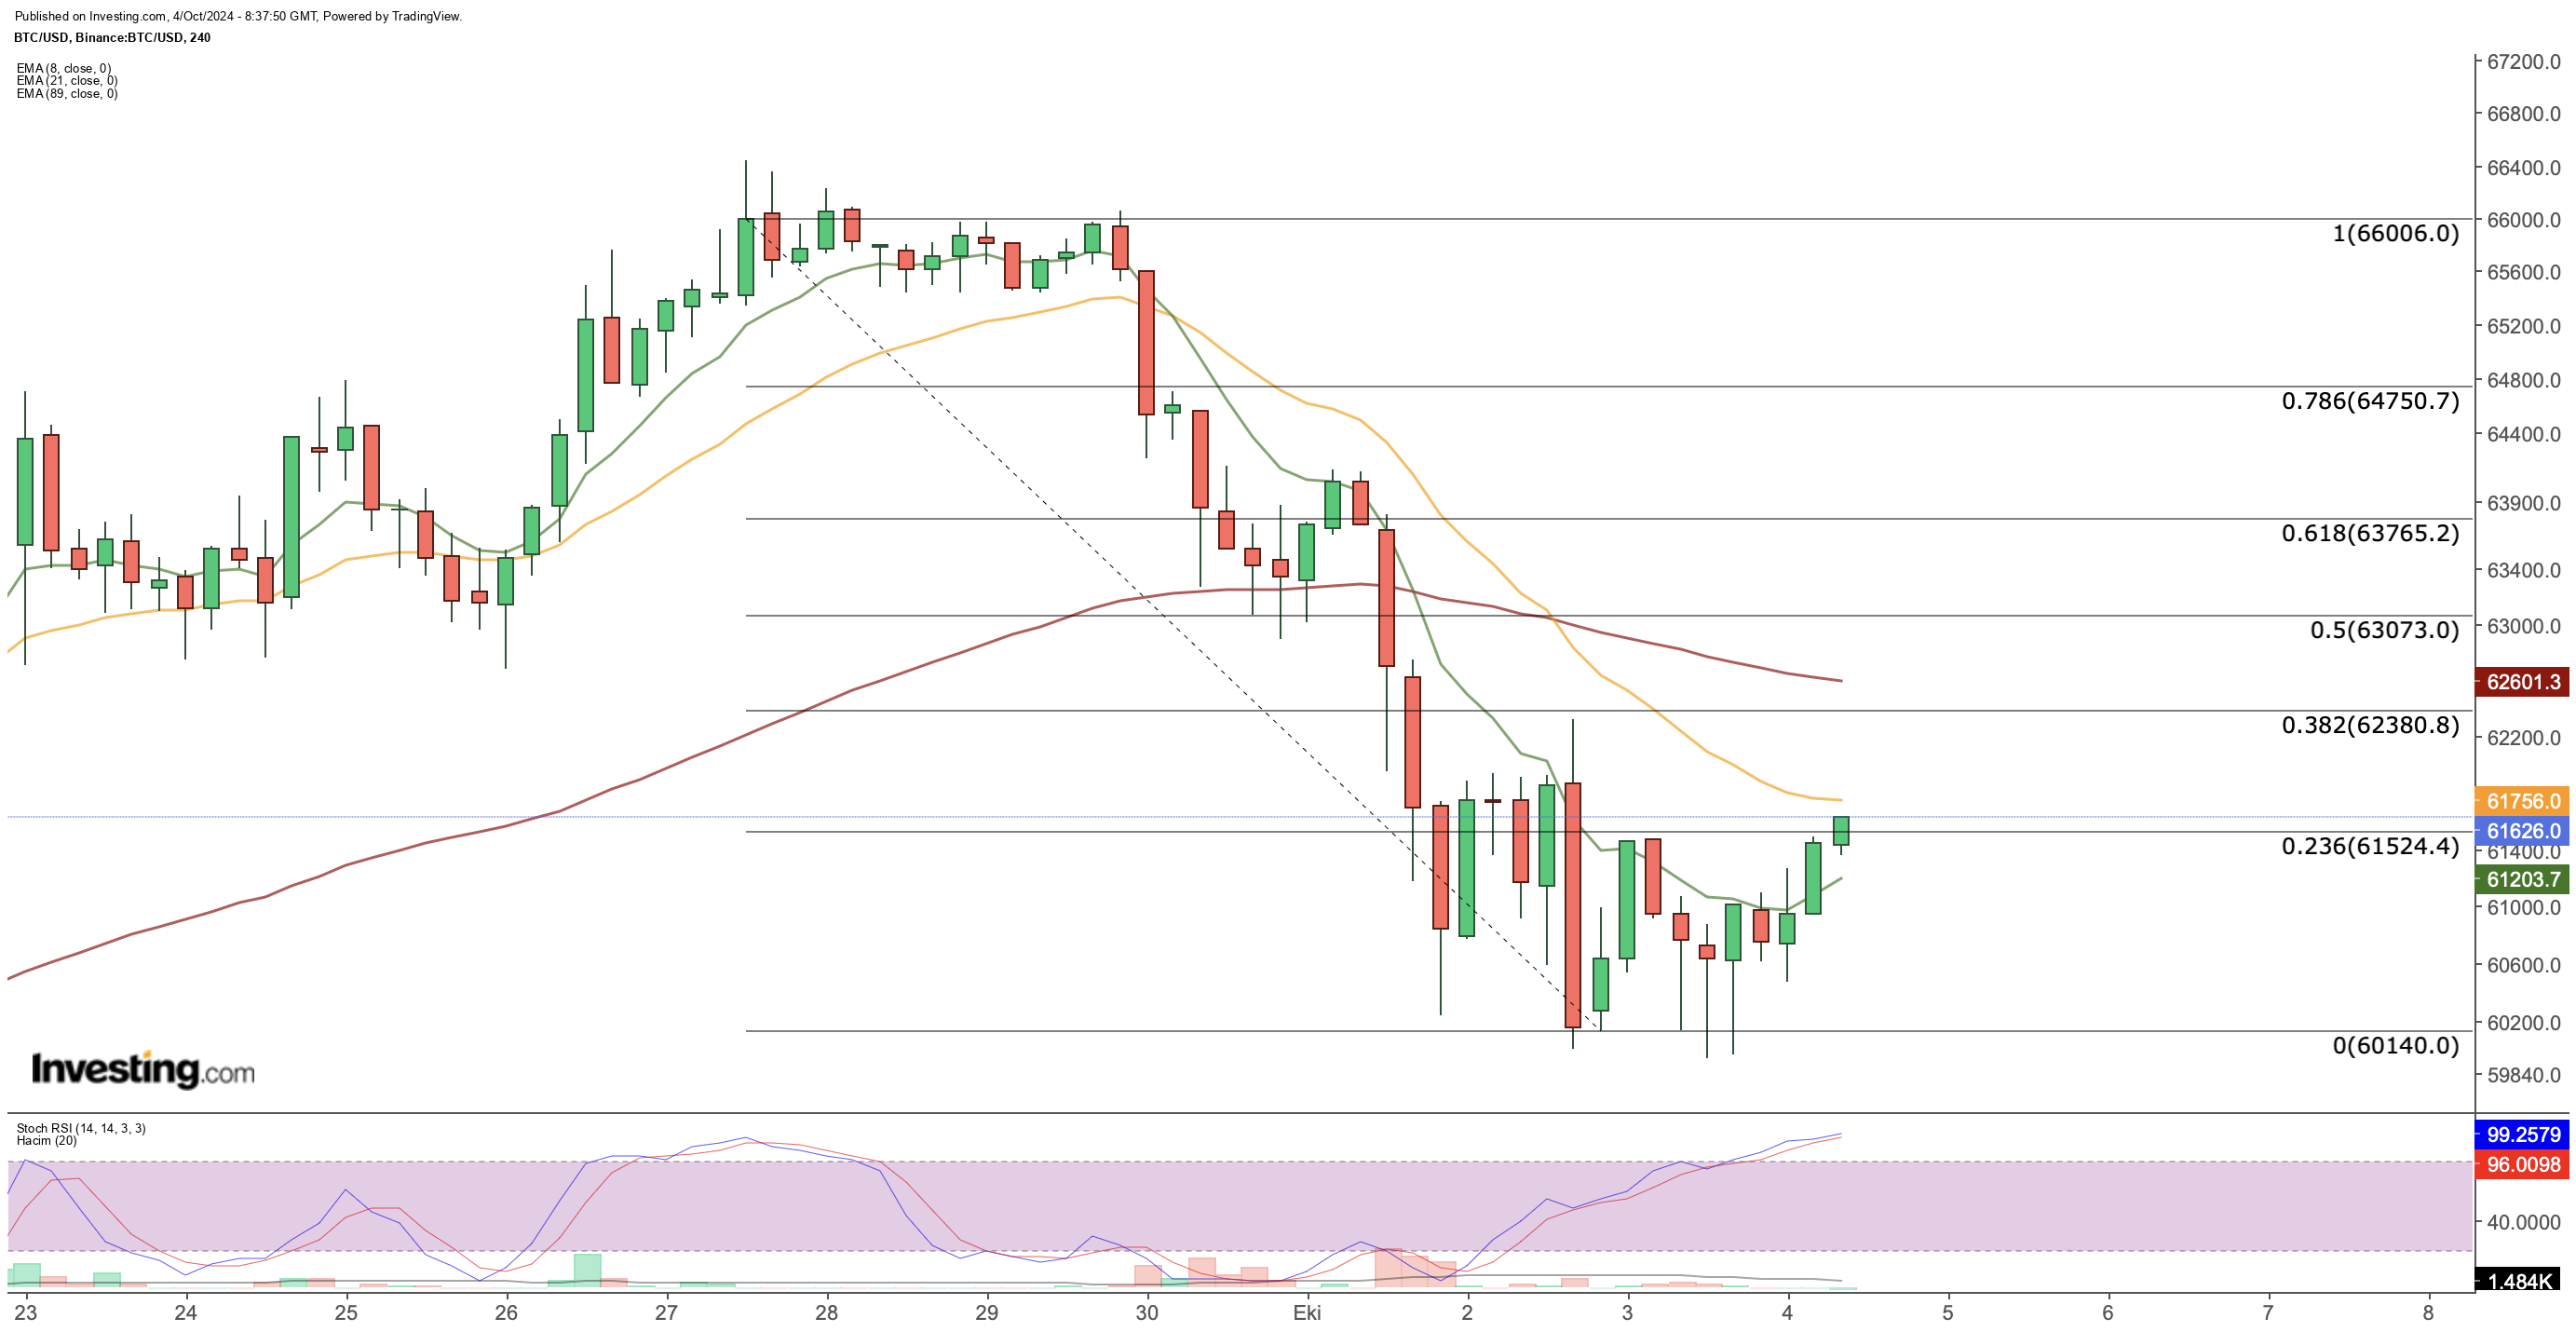
Taking a closer look at Bitcoin’s recent downward trend on a 4-hour chart reveals that $61,500 is a key resistance level for continuing the recovery.

If daily closes exceed this mark, investors could set their sights on the $63,000-$63,750 range. A strong breakout above this resistance could spark further upward momentum.
On the downside, slipping below an average of $61,250 might reignite selling pressure, potentially sending BTC back below $60,000 toward the next support level at $58,300.
A drop below the $58,000 support could lead Bitcoin to test the lower channel band, aligning with the $53,000 region.
Ethereum: Will It Reach the Demand Zone?
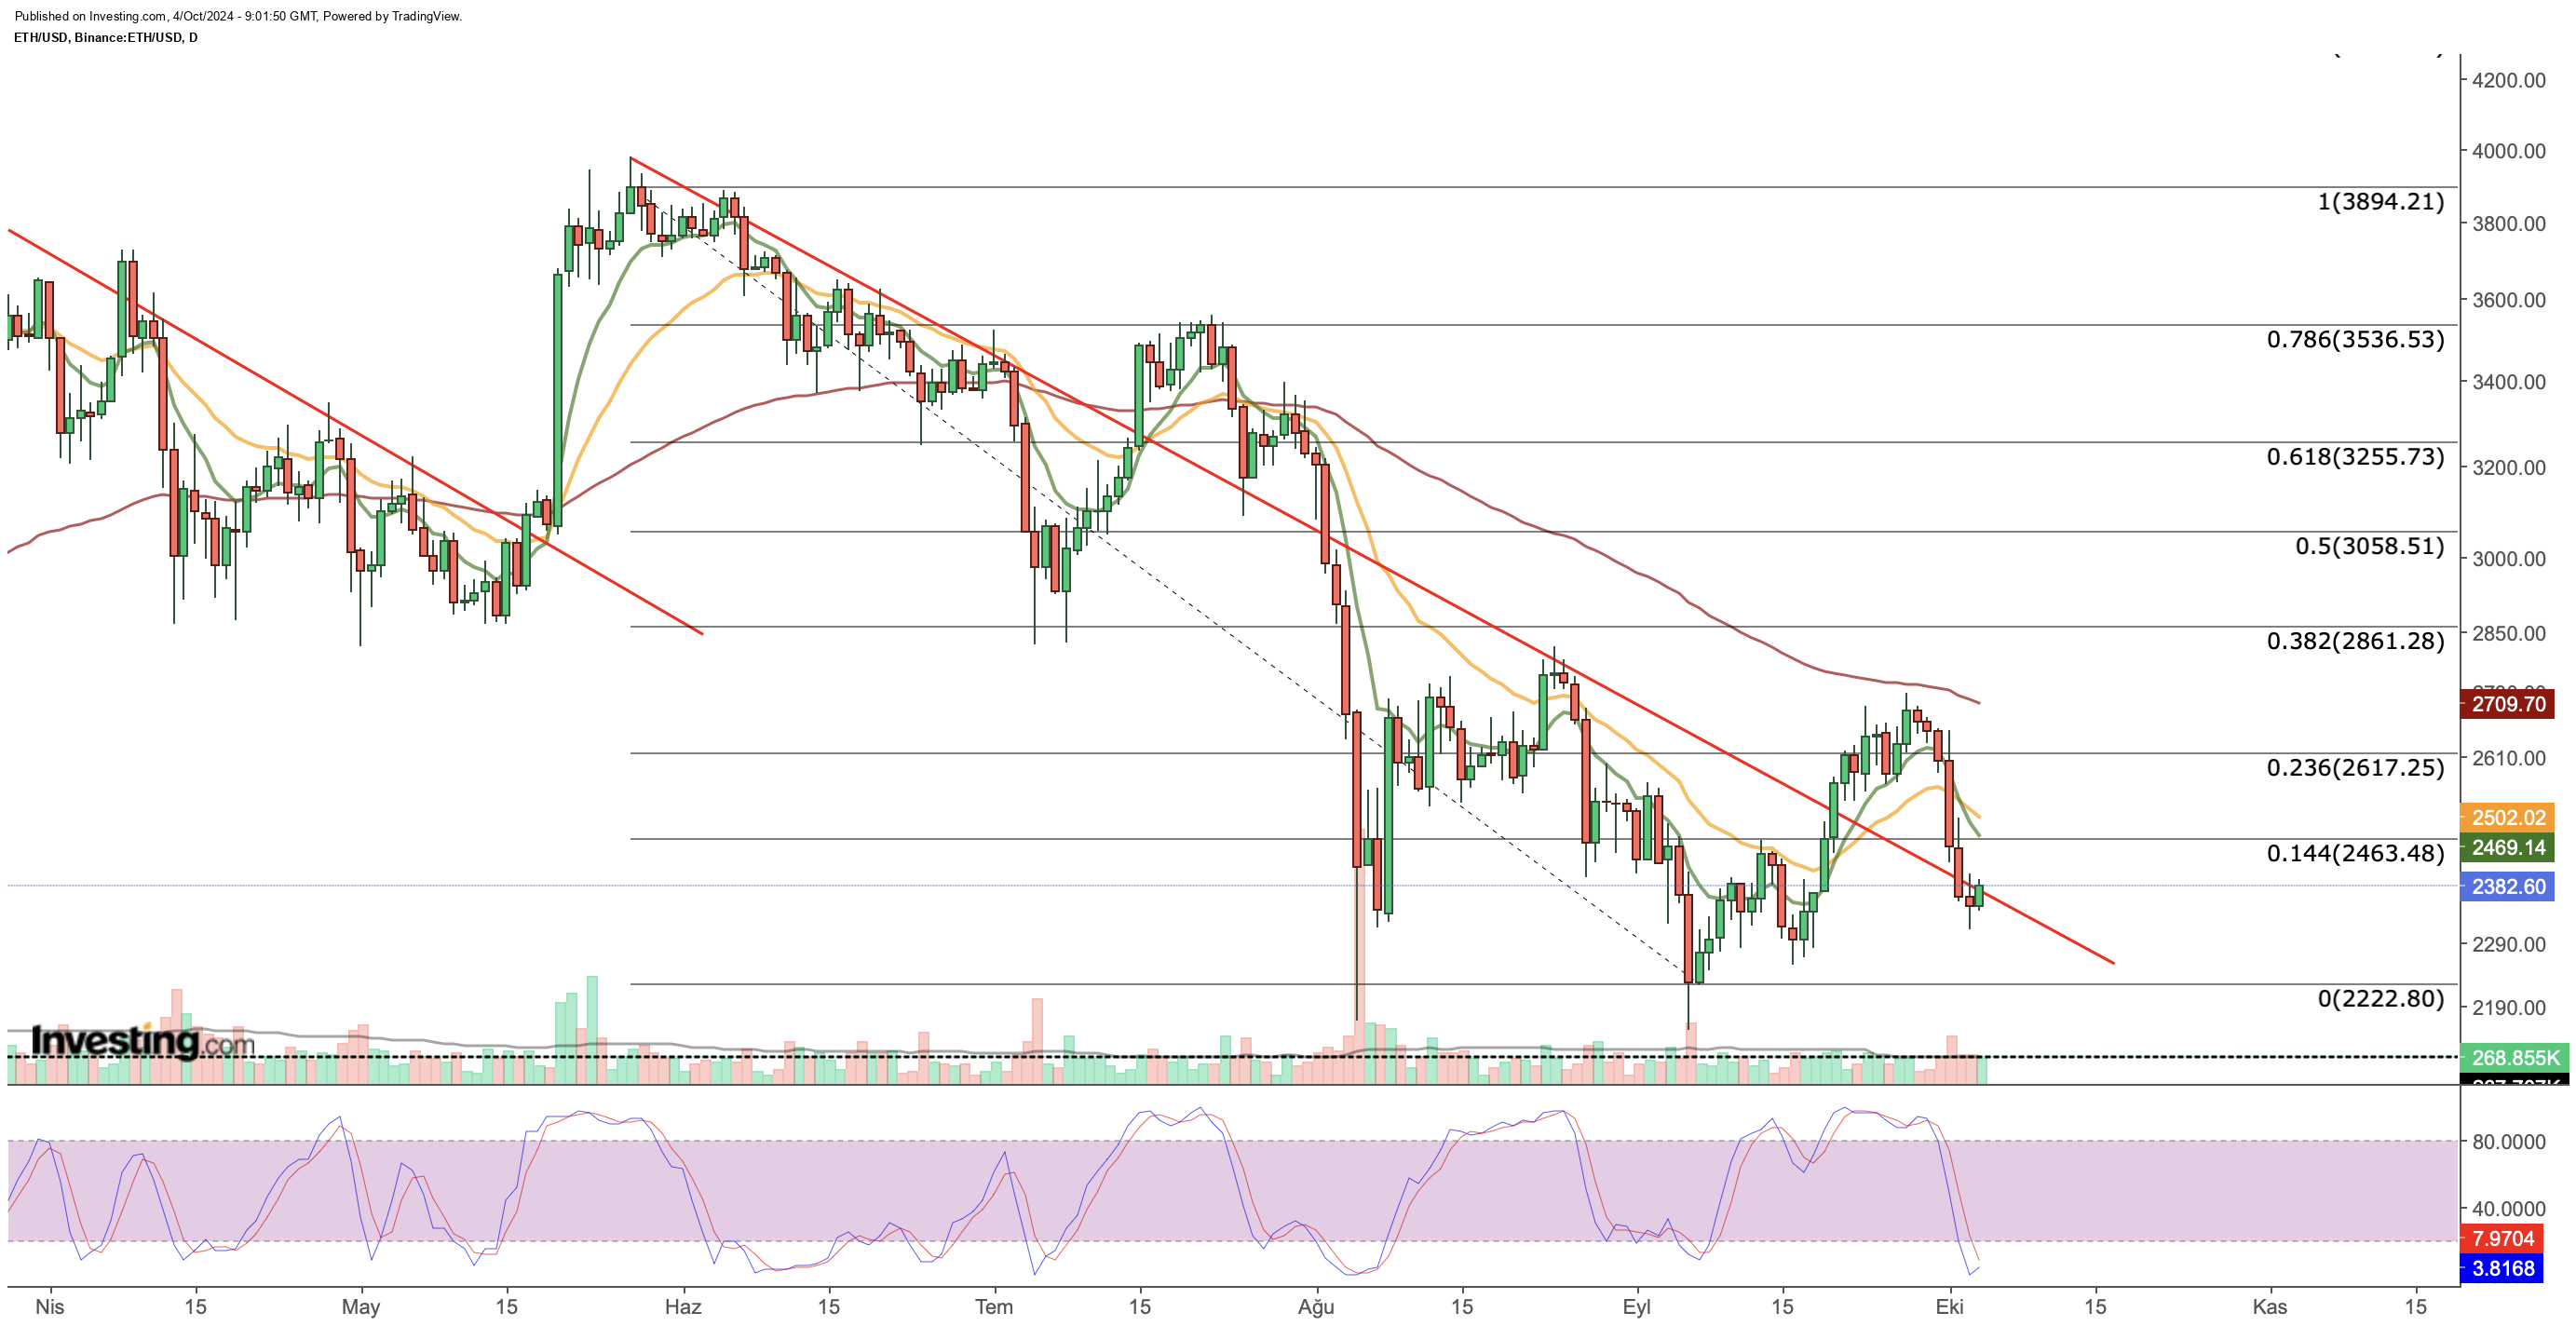
Ethereum has once again faced rejection at the $2,700 level during its latest attempt to reverse the downward trend that has persisted throughout the year.
This recovery effort looks similar to price movements from July.

Right now, ETH is grappling with the descending trend line, and if it can close daily above this line, it could reignite its push toward the $2,700 mark after facing resistance at $2,460 and $2,620.
If Ethereum can clear the $2,700 hurdle, it would mark a crucial step toward reversing the downward trend.
On the flip side, if it fails to maintain momentum, we might see the formation of lower peaks and continued bearish sentiment.
Should ETH close below $2,350, it would remain stuck under the descending trend line, possibly accelerating toward the last demand zone at $2,100 if a new selling wave hits.
***
Disclaimer: This article is written for informational purposes only. It is not intended to encourage the purchase of assets in any way, nor does it constitute a solicitation, offer, recommendation or suggestion to invest. I would like to remind you that all assets are evaluated from multiple perspectives and are highly risky, so any investment decision and the associated risk is at the investor's own risk. We also do not provide any investment advisory services.
