Canadians generally take pride that their banks have been able to weather the 2008 storm well and continue to exhibit solid performance . Recent financial results point to growing profits, increases in dividends and improvements in reserve requirements. Yet, the industry is aware of serious challenges from the collapse of oil prices as well as the challenges that all banks worldwide face from a low or negative interest rate environment. In this blog we will look at what will influence the performance of the Canadian banks in the near term.
For the benefit of our American readers, we should point out there are significant differences between the Canadian and US banking systems. The industry in Canada is dominated by six large banks (Big Six) which are national in scope, each having as many as one thousand branches throughout the country and each providing a full range of commercial and personal banking services (much like the money centre banks in the US) . There are dozens of much smaller banks that operate only regionally or in specific market segments In the US, even after a consolidation ,post-2008, there are about 7000 commercial banks and savings institutions , the majority of which operate independently only in local communities and have no national presence.
Canadian banks feature a high percentage of assets in personal loans, especially mortgages; whereas, the US banks sell their loans through the securitization market. The Canadian banks carry very little risk of loss since higher loan-to-value mortgages must carry mortgage insurance.
Finally, the Canadian financial regulatory environment has remained basically untouched even after the 2008 crisis; the US industry underwent dramatic changes that are still being implemented to this day. With a more stable regulatory environment, the Canadian industry is able to operate with little disruption, compared to what we see happening in the US and in the European market(1).
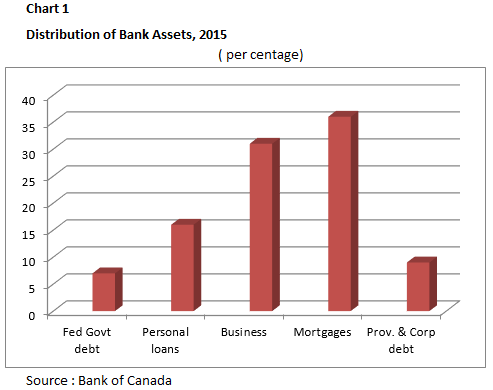
Lets turn our attention to challenges facing the Canadian industry. To begin, we note the structure of banks assets and revenues. Chart 1 sets out the asset classes and their relative importance.

Personal lending occupies more than half of all bank assets; personal accounts make up 16% and mortgages for an additional 36%. Business loans make up 31% of all assets. These proportions have remained relatively static over the years.
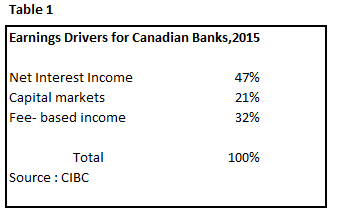
Regarding revenues, Table 1 reveals that the prime source of revenue (47%) is net interest income (NII), the basis of all banking operations. Ever since the banks purchased securities dealers in the 1990s, the industry has grown to rely increasing on capital market returns which ,on average, account for about 21% of all revenues. Finally, the Canadian banks have steadily increased the importance of fee-based income which now generates about 1/3 of its total revenues. The question we need to explore are : what factors will impact bank revenues and, hence , profits going forward?

There are four developments that need to be watched carefully as the industry copes with a changing environment.
1) Asset growth slowing. Domestic personal lending, especially mortgages has slowed . The banks are concerned with their exposure to that segment of their portfolio in view of weak economic growth and, especially, the impact of a hard-hit energy sector. Caution has taken hold.
2) Exposure to the energy sector. Canada's depressed energy sector is now hitting the banking community. The banks have steadily increased provisions for loan losses with each new quarterly reporting. However many analysts are arguing that these provisions are insufficient. The banks are conducting various stress tests to counter these arguments. Only six months ago, the price of oil was around $60 bbl and now trades at $30-35 bbl; the full impact of this dramatic decline has not yet been felt by lenders. The longer oil prices remain at this level, the more we can anticipate corporate and personal loan losses will climb. Time is not on the side of the banks in this regard.
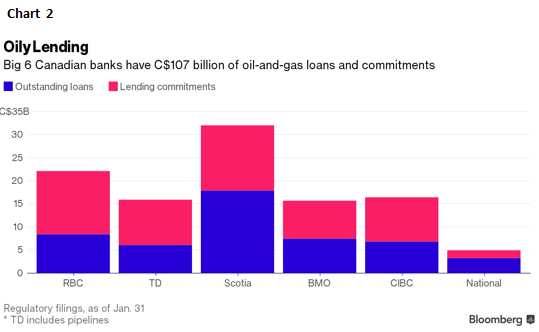
Industry analysts have been trying to get a handle on just what is the exposure of the Big Six to the oil patch. Exposure takes two forms: 1) direct outstanding loans and 2) untapped credit lines. In the accompanying Chart 2, according to Bloomberg.com, the total outstanding exposure is C$107 billion, not the C$ 50 billion highlighted by the banks in their recent quarterly reports. The difference lies principally in how much of untapped credit lines exist and other commitments the banks have undertaken to support clients. To be fair, these commitments in total will overstate the banks' actual risks, since not all lenders will draw down all these lines, even in times of greater difficulties; nevertheless, as the energy sector continues to operate in this tough environment , the banks' exposure needs to be watched closely.
 |
| Source: @business |
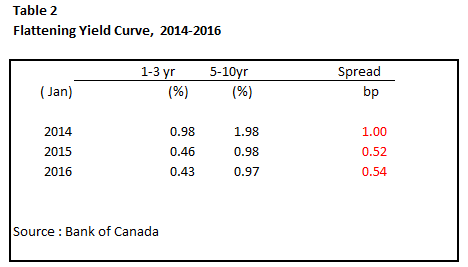
3) Narrowing of net interest margins (NII). The biggest single determinant of bank profits is the shape of the yield curve. Particularly ominous for the banks is the spread between short- and long-term rates, between the 2 and 10 year rates. Banks do well by borrowing short and lending long; the steeper the yield curve, the greater the opportunity for profits. However, as Table 2 clearly points out, the trend has been moving in the opposite direction. This spread has narrowed considerably, from 100bps in 2014 to just 54bps in 2016. In an era of super low interest rates, this narrowing of the spread is putting tremendous pressure on the banks to generate profit growth quarter after quarter. Worse yet, the decline in long term rates herald a weakening economy and deflationary developments, further pressuring profitability. The spectre of negative interests, as is the case in Europe and Japan, is also of great concern to the Canadian banking community.

4) Capital market volatility. Capital market revenues have to be earned afresh each day. That is, the revenues are a combination of trading profits, underwriting and advisory services, and as such exhibit a lot of volatility. As such, these revenues cannot be relied upon as a consistent and recurring source of income in comparison to mortgages or business loans. Moreover, as we explained in Part 1 of this series, this segment of the industry is undergoing major structural adjustments and profitability is becoming illusive. (http://soberlook.com/2016/02/canadas-changing-financial-landscape.html ).
5) Housing market .Canada's housing market poses an additional challenge to improving NII. There are many different opinions as to when and to what degree a slowdown in housing prices will take place. It is clear, however, that mortgage originations are not going to continue at the recent rapid rates of growth. The banks have signaled that are they concerned regarding the connection between household debt and home prices. Given that mortgages represent about half of all loans outstanding, this possible slowdown combined with a flattening yield curve will impinge on NII.
We will look at this housing and mortgage topic in Part 3 of this series.
