Stocks are surging today. Two weeks ago, they jumped the most in over ten years. The week before that, equities sold off the most in more than a decade. These wild swings are not the sign of a bottom and we expect the situation will get worse before it gets better. Both in markets and likely for the global economy as well.
The specter of mounting unemployment means consumers will be more careful about how they spend money, painting a grimmer picture of what's likely in store for U.S. and international business.
In a bear market, defensive stocks shine. And the more uncertain the environment the more likely one key consumer staple—food—will still be a household expenditure.
As a result, if things do deteriorate as badly as is feared, with the U.S. economy grinding to a halt for the first time in its history, food stocks will be hot. Among the mega caps in this sector likely to advance as the economy declines is mammoth food and beverage producer, Campbell Soup (NYSE:CPB).
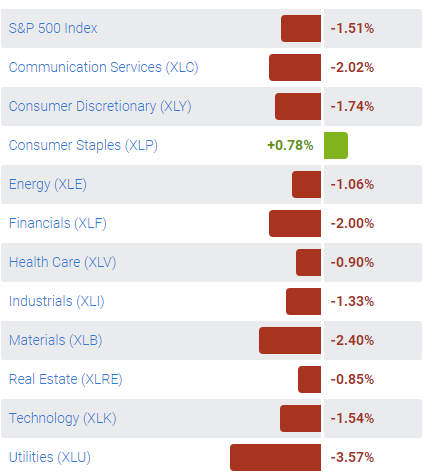
The chart below should make that succinctly clear: it's Friday’s S&P 500 sector breakdown:

The S&P 500 Index is down 26 .6% from its Feb. 19 record peak, while while New Jersey-based Campbell is up 3.6% in the same period, and that's the story in a nutshell.

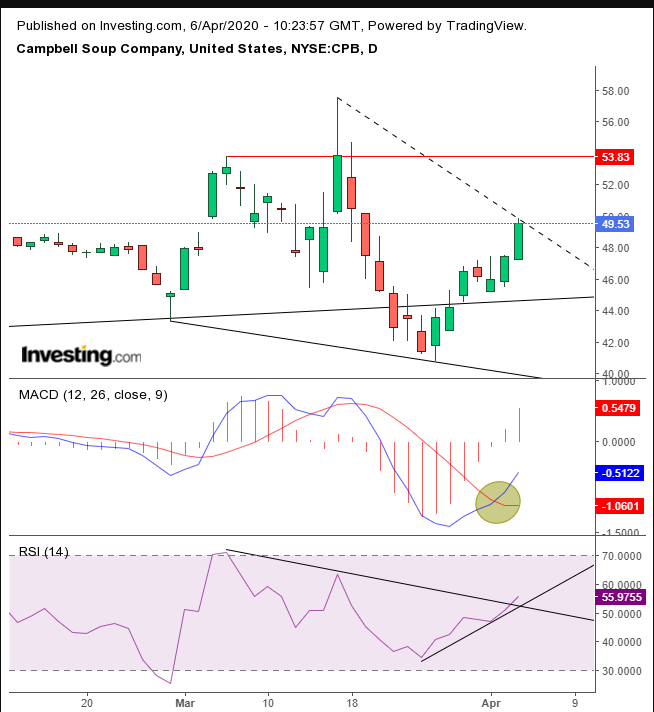
On the technical chart, the multinational foodmaker may be setting up a falling wedge, bullish within the uptrend since the February 2019 bottom. If the stock falls now, or at least slows down, as risk assets rise, it will allow the upper trendline to form, which remains dotted for now, as it's incomplete.
The pattern demonstrates that despite all the selling, there's enough demand to pick it all up. Once there's an upside breakout, it will be proof that demand continues to overtake supply, signaling a continued uptrend.
The MACD’s short MA cross above its long MA from the downside is providing the best buy signal. The RSI has been climbing, breaking through its downtrend line, providing a positive divergence to price and suggesting price action might follow.
If so, the price will not have developed a falling wedge, but simply climbed. Then,the $54 level will be critical, to ascertain whether the stock can close higher than the March 17 close and then the same session’s $57.54 intraday high.
Trading Strategies
Conservative traders would wait either for another fall before a breakout, to complete a falling wedge, or for higher highs, extending the uptrend, before committing to a long position. In either case, conservative traders should wait for a return move that retests support.
Moderate traders are likely to wait for the same moves as conservative traders — a completed wedge or higher highs — then wait for the pullback for a better entry, not necessarily for proof of trend.
Aggressive traders could go long when prices bounce off the pattern’s bottom, complete the pattern or make higher highs.
Trade Sample
- Entry: $45
- Stop-Loss: $44
- Risk: $1
- Target: $49
- Reward: $4
- Risk:Reward Ratio: 1:4
