US dollar bulls and bears may already agree on the path to higher interest rates ahead of today's Fed rate decision. Indeed, traders have already priced in a 92.5 percent probability of a hike.
But given that the anticipated FOMC announcement is just the first of a trifecta of major central bank decisions scheduled to be delivered this week, there may yet be disagreement on whether the ECB or BoJ have the space to tighten policy. Since the Fed's rate hike is likely a foregone conclusion, for savvy FX traders, avoiding the USD trade in favor of a contrarian currency bet provides a better risk-reward ratio.
Any hawkish posture by the ECB or BoJ—even if no action will be taken by either immediately—sets risk to be dollar downside. While there have been hints that the ECB is planning to discuss the end of its easy money, the BoJ is expected to keep the status quo. In fact, an ally of the Japanese central bank's Governor Kuroda indicated that the BoJ will not take any action before the dollar-yen exchange reaches 125-130.
Taking all these factors into account, what's the optimal forex pair to trade? Let’s recap the specifics:
- A dollar hike is priced in. That leaves little room for any further rally on the interest rate decision. And an especially hawkish Fed outlook may, in fact, boost the greenback even more.
- Reportedly, the ECB will turn the tables with an announcement concerning the end of QE which, together with the Fed's hike already priced in, gives the euro a higher probability of strengthening against the dollar. And finally
- The yen appears to have room to weaken to at least 1.25.00 with no intervention, making the yen the weakest of the three.
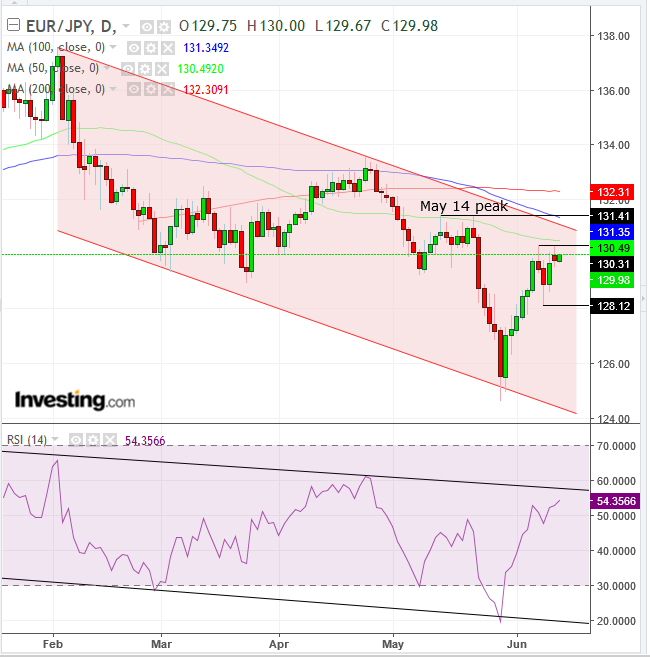
Therefore, a euro-yen long position seems like the best combination. Here's the chart:

The pair has been trading within a falling channel since early February, as both buyers and sellers have been willing to place their respective orders at ever lower prices, thereby agreeing that the euro was overpriced relative to the yen.
This supply-demand dynamic was confirmed with both various price data comparisons and momentum. The triple main moving averages: the 50, 100 and 200 days have entered a bearish formation, in which more recent prices weakened compared to longer averages. The 50 DMA (green) situated itself above the current price cluster and may provide a resistance for technically oriented traders; the 100 DMA (blue) confirms the resistance of the falling channel-top.
The RSI displays that momentum has been falling in tandem with prices and had, in fact, begun falling a full six months earlier, beginning in August.
Therefore, the supply-demand balance suggests a much higher probability that the euro would, in fact, fall against the yen. What might be a catalyst?
The yen's safe haven status, naturally. But why would this weakness be displayed prior to such a driver? The chart illustrates the overall picture since early in the year.
Today, however, the euro is rising against the yen, testing the 130.31 presumed resistance of yesterday’s spinning top, which itself revealed that the there is more supply at this price level that formed Thursday’s shooting star.
On the other hand (and you knew this was coming) an upside breakout—which may be the result of a dovish BoJ-Hawkish ECB combination—would trigger presumed stop-losses. As traders withdraw their sell orders, buyers will have a clear path to bid prices higher.
So, for as long as the price remains below the May 14 peak, at 131.41, the trend is still down, which means it’s more likely to continue lower.
Trading Strategies – Short Position Setup
Conservative traders would wait for a fresh trough, lower than the May 29, 126.61 low, to confirm and prolong the downtrend.
Moderate traders might risk a short with a close below the 128.12, June 8 low. They may place a stop-loss above the 128 range-bottom or above the 131 channel-top, depending on their target, as long as they establish a minimum 1:3 risk ratio.
Aggressive traders may short immediately, placing a stop loss above the 130.31 range top or the 131.41 May-14 peak, depending if they target the 128.12 range bottom or the 125.00 psychological level, nearing the May-29-trough and channel bottom, as they ensure a 1:3 risk-reward ratio.
