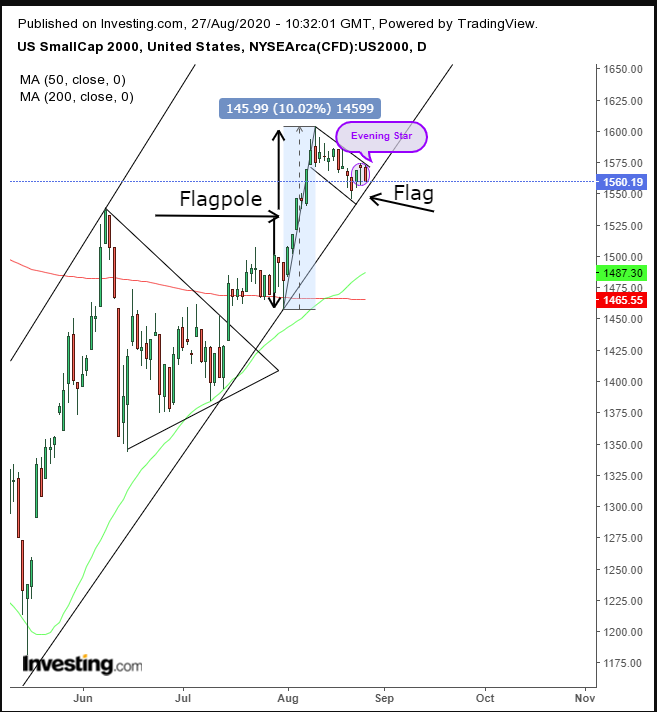
While US stocks—at least since the March bottom—have bestowed investors with the best returns in decades, on a year-to-date basis their performance has been mixed. Within that framework, small cap shares, as listed on the Russell 2000, have displayed the biggest performance disparity over the two timeframes.
Below, results for the four major US benchmarks between those timeframes:

One very glaring anomaly: while the Russell 2000 was the second-best performer since the March bottom, it's by far the primary laggard on a year-to-date basis.
In the same way the Dow has completed an upside breakout of a bullish pattern and is moving higher, similarly, we're betting the Russell 2000 will shortly close the YTD-gap, breaking out of the same bullish pattern the Dow recently completed.
It doesn't hurt that small caps, which are currently undervalued, now provide investors with more growth opportunities. Institutional investors are noticing. According to Lori Calvasina, chief US equity strategist for RBC Markets, we're now seeing a “historical valuation opportunity,” setting up small cap shares to outperform in 2021.
From a technical perspective, the supply-demand picture is looking pretty bullish too.

The benchmark completed an Evening Star, which also confirms Tuesday’s hanging man. However, the bearish edge was taken out of these patterns because of the insignificant rally that preceded it, a 1.9% gain between Friday’s low and Tuesday’s high—which also didn't provide much to give back.
The more critical technical signals are the overall trading pattern of a falling flag—bullish after the 10% surge in just eight days. It's yanked up the 50 DMA over the 200 DMA, triggering the so-called Golden Cross, which is also forming the flagpole.
The fact that the flag coincides with the uptrend line since the March 20 bottom—the bottom of a rising channel—compounds the odds for an upside breakout.
The body of the flag is created when investors who enjoyed the preceding sharp up-move cash out, which is why the price tilts downward. However, new demand props it up and stops it from falling, causing the price to congest. When demand absorbs all available supply, it's forced to raise offers to find less compromising sellers at higher prices.
The fact that the flag is formed at the very bottom of a rising channel is a supply-demand setup for prices to return toward the top of the channel.
Investor expect the upside breakout to repeat the same rally that preceded it, which was 146 points from the cusp of the breakout. If realized, the price would retest its pre-COVID-19 levels.
Trading Strategies
Conservative traders should wait for an upside breakout whose reach should best the 1,603.60 height of the flag, clearing at least 3% from the point of breakout, as well as a 3-day filter, preferably to include a weekend, to sift out a bull-trap. Then, they’d wait for a likely return-move, after the short-squeeze ends and longs take profit, and enter a long position of their own with evidence of continued demand above the flag.
Moderate traders may be content with 2%, 2-day penetration, to reduce the odds of being whipsawed out of a long position.
Aggressive traders may risk an immediate long position, to beat the crowd, provided they understand that the flag’s bullish signal is only triggered upon the upside breakout, which is when the herd stampedes.
Trade Sample – Aggressive Long Position
- Entry: 1,550
- Stop-Loss: 1,530
- Risk: 20 points
- Target: 1,650
- Reward: 100 points
- Risk:Reward Ratio: 1:5
